Research Article - Neuropsychiatry (2018) Volume 8, Issue 6
A Comparison of Different Time Windows for the Detection of Cardiac Right-To-Left Shunt Using Contrast-Enhanced Transcranial Doppler Ultrasonography
- Corresponding Author:
- Ying-qi Xing
Neuroscience Center, Department of Neurology, The First Hospital of Jilin University, No. 71 Xinmin Street, Changchun, China
Tel: 86-15844047846
Fax: 86-431-88782764
Abstract
Objective
Contrast-enhanced transcranial Doppler ultrasonography (c-TCD) is highly sensitive for detecting cardiac right-to-left shunt (RLS). However, the time window to be used with c-TCD for cardiac shunt detection is yet to be standardized. The aim of our study was to standardize the time window to enable easy and widespread use of c-TCD for cardiac shunt detection.
Methods
A total of 239 consecutive patients with suspected cardiac RLS were subjected to simultaneous c-TCD and contrast-enhanced transthoracic echocardiography (c-TTE). We evaluated time windows of 15-, 20-, 25-, 30-, 35-, and 40-s duration for c-TCD. Receiver operating characteristic (ROC) curve analyses and Spearman’s rho rank correlations were performed for the different time windows to calculate the areas under the curve (AUCs) and 95% confidence intervals (95% CIs).
Results
The AUC, and thus the diagnostic accuracy, was highest for the 25-s window (AUC, 0.746; 95% CI, 0.684–0.809). The 15-s window (0.667; 95% CI, 0.598–0.737; P < 0.05) had the least AUC. Spearman’s rho rank correlation identified the 25-s window (rho, 0.627; 95% CI, 0.534–0.708) as having the strongest correlation between c-TCD and c-TTE.
Conclusion
The 25-s window is ideal for c-TCD-aided detection of cardiac RLS.
Keywords
Time window, Right-to-left shunt, Contrast transcranial Doppler, Transthoracic echocardiography
Introduction
A cardiac right-to-left shunt (RLS) is a common condition with a prevalence of 25% [1]. It is present in up to 40% of stroke patients [2], and is more common in the young. A paradoxical embolism through a cardiac shunt is a wellknown cause of cerebrovascular stroke, although the mechanism is unclear. Cardiac RLS is also associated with other conditions such as cryptogenic stroke, transient ischemic attack (TIA), decompression sickness, and migraine [3-6].
Contrast-enhanced transcranial Doppler ultrasonography (c-TCD) is a sensitive and specific method for detecting cardiac RLS [7]. However, the examination protocol for c-TCD is yet to be standardized. Its results may be influenced by several factors including contrast agent, Valsalva maneuver (VM) mode, and the time window after contrast injection for microbubble (MB) detection [8,9].
Several time windows have been used for c-TCDaided detection of cardiac RLS. A time limit of six heartbeats was recommended by Klötzsch et al. in 1994 [10]. Further, studies recommended time-intervals of 25 s and 22 s for Echovist and agitated saline, respectively [9,11].
In this study, we compared a series of time windows (15 s, 20 s, 25 s, 30 s, 35 s, and 40 s) to analyze their efficacy for diagnosing cardiac RLS with c-TCD. The aim of our study was to standardize the time window for c-TCD-aided cardiac shunt detection.
Methods
▪ Patients
This study included 239 consecutive patients (75 men; mean age, 36.76 ± 11.89 y) with suspected cardiac RLS, who were enrolled from January 2016 to November 2016 at the Department of Neurology, The First Hospital of Jilin University. Patients with severe arterial stenosis, inadequate temporal view, and those unable to perform VM owing to severe lung or heart disease were excluded. The clinical presentation of the included patients was as follows: migraine, 111 patients; non-specific headache, 21; transient ischemic attack (TIA), 8; cerebrovascular stroke, 23.
This study was approved by the Ethics Committee of the First Hospital of Jilin University. Informed consent was obtained from all enrolled subjects.
▪ c-TCD and c-TTE
Two independent operators performed c-TCD and contrast-enhanced transthoracic echocardiography (c-TTE) simultaneously for all patients. c-TCD was performed with a TCD detector (EMS-9PB, Delica, China) in the right temporal view with a hand-held 2-MHz ultrasound probe at the right middle cerebral artery (MCA). A HITACHI HA710 device was used for obtaining four-chamber views with a 1.5-MHz probe (type EUP-S70) for the c-TTE examination.
Contrast studies were performed with the patients lying in the left lateral position. The contrast agent was prepared by using two 10 mL syringes connected by a three-way stopcock to mechanically agitate a mixture of 9 mL saline solution, 1 mL air, and a drop of the patient’s blood for a minimum of 30 times [12], and injected into the left cubital vein through an 18-G catheter as a bolus immediately after the mixture was prepared.
Contrast studies were repeated thrice, once at rest and twice with the patient performing VM. Each test involved injection of the contrast agent at 0 s, with the patient performing VM for a duration of 10 s, starting at 5 s. There was a minimum interval of 5 minutes between tests, as measured from the last observed MB. RLS was estimated based on the highest number of MBs detected in each case during VM.
All patients were trained to perform an effective VM, and its effectiveness during a contrast study was confirmed by a reduction in the MCA-peak systolic velocity of > 25%.
▪ Data interpretation
MBs were defined as chirping sounds and high-intensity, short-duration, unidirectional signals within the Doppler flow spectrum. The appearance of MBs in the MCA was recorded based on a five-level categorization (International Consensus Criteria for RLS degree) as: negative, no MBs; grade I, 1–10 MBs; grade II, 11–25 MBs; grade III, > 25 MBs but no curtain; and grade IV, curtain of MBs (impossible to count the number of MBs) [13,14]. Cardiac RLS was considered when at least three MBs appeared in the left atrium within three cardiac cycles following the complete opacification of the right atrium [15-17]. The appearance of MBs in the left atrium was recorded based on a five-level categorization as: negative, no MBs; grade I, 3–9 MBs; grade II, 10–30 MBs; grade III, > 30 MBs; and grade IV, opacification of the left atrium.
c-TTE results were analyzed online, and further reviewed offline by a cardiologist. Online and offline interpretation of the c-TCD data was performed by Neurosonologists who were blinded to the c-TTE results.
▪ Statistical analyses
All data were processed using IBM SPSS Statistics 20.0. Receiver operating characteristic (ROC) curve analyses was used to estimate the diagnostic utility of different time windows. The Spearman’s rho rank correlation coefficient was used to analyze the correlation between c-TCD and c-TTE categorizations for different time windows. Results were reported as areas under the ROC curve (AUCs) and 95% confidence intervals (CIs). Furthermore, the time of first appearance of MBs in cardiac RLS patients was calculated both at rest and during VM. Quantitative data were expressed as mean ± standard deviation (SD). Statistical significance was set at P < 0.05.
Results
▪ Diagnostic accuracy of different time windows (ROC curve analysis)
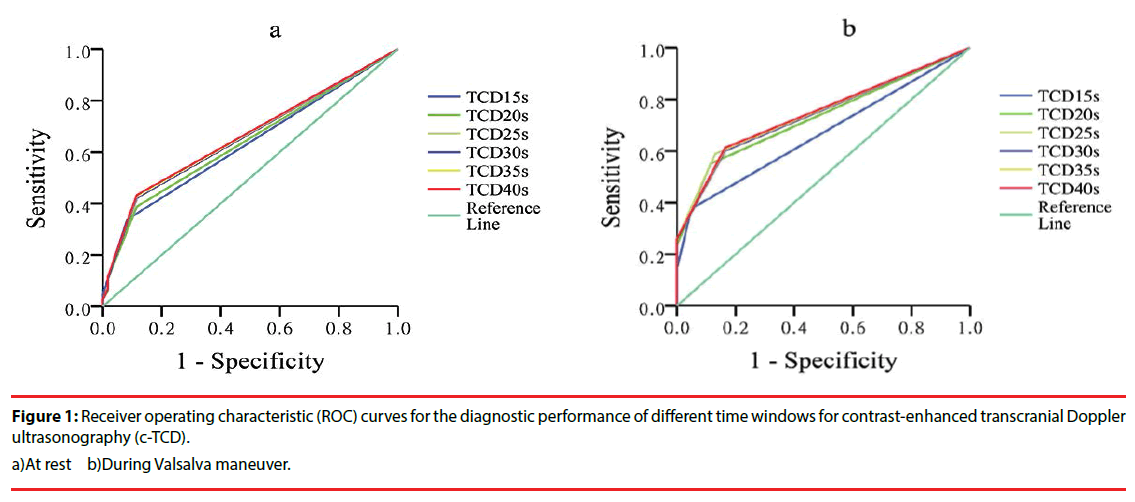
ROC curve analysis was used to estimate the diagnostic performance of different time windows for detecting cardiac RLS on c-TCD. The results of c-TTE for ROC curve analysis were recorded as dichotomous outcomes (cardiac RLS: 0, negative; 1, positive). There were no significant differences in the AUCs between the different time windows, with patients at rest (P > 0.05). On VM, the AUC for the 15-s window (0.667; 95% confidence interval [CI], 0.598– 0.737) was significantly smaller than the AUCs for the other time windows (P < 0.05). Although the AUCs for the 20-, 25-, 30-, 35-, and 40-s windows during VM were similar (P > 0.05), diagnostic accuracy for cardiac shunt detection was best with the 25-s window (AUC, 0.746; 95% CI, 0.684–0.809). This time window had the largest AUC during VM (Figure 1).
▪ Correlation between c-TCD and c-TTE (Spearman’s rho rank correlation)
We analyzed the correlation between RLS categorization by c-TCD and c-TTE at different time windows during VM. The correlation between c-TCD and c-TTE appeared to be better at the 25-s window than at the other time windows (Table 1), although this difference was not significant (P > 0.05).
| time windows | 15-s | 20-s | 25-s | 30-s | 35-s | 40-s | |
| rho | 0.565 | 0.623 | 0.627 | 0.610 | 0.615 | 0.621 | |
| 95% CI | 0.461–0.648 | 0.525–0.702 | 0.534–0.708 | 0.508–0.693 | 0.516–0.700 | 0.528–0.708 | |
Table 1: The Spearman’s coefficient of rank correlation (Rho) between c-TCD and c-TTE at different time windows during VM.
▪ Time of appearance of the first MBs
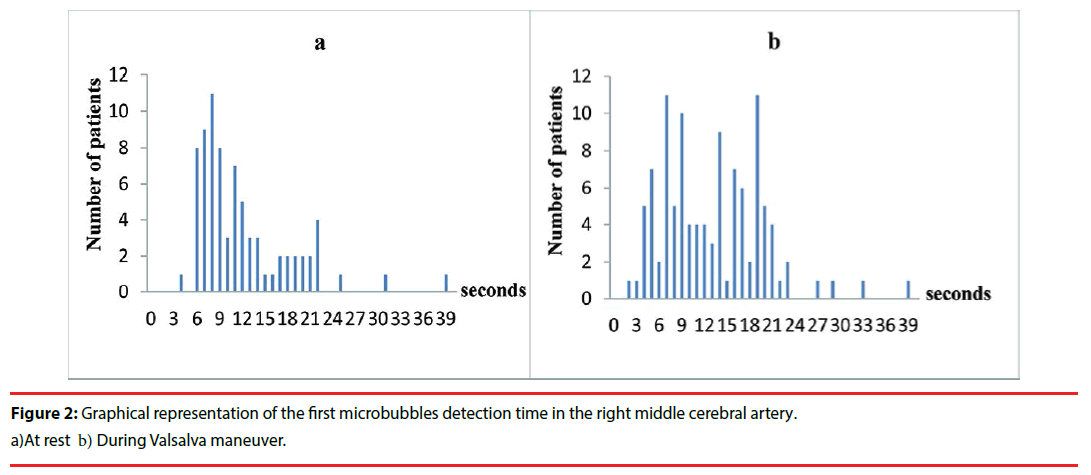
We analyzed a total of 186 positive tests (at rest, 75; during VM, 109) in cardiac RLS patients. The mean values for the time from injection to the appearance of the first MBs in the right MCA blood flow were 12.0 ± 6.3 s and 13.1 ± 6.7 s at rest and during VM, respectively. Among the 186 positive tests, in 180 (96.8%), the first MBs were detected within 25 s following the injection (Figure 2). During VM, MBs appeared beyond the 25-s window in only 4 (3.7%) of the 109 patients who had positive tests; 2 of them had a single MB detected in only one of the three tests.
Discussion
We attempted to determine the optimal time window for detecting cardiac RLS with c-TCD.
The choice of a standard time window for cardiac shunt detection is controversial. A variety of time limits, from 4–15 s to 40 s, have been recommended for various conditions [11,18-20]. The identification of RLS may be considerably influenced by any variation in the time windows, and an appropriately chosen time window may increase the diagnostic accuracy of c-TCD.
Our results recommend the 25-s time window for c-TCD-aided detection of cardiac RLS. The AUC at 25 s was larger than that at 15, 20, 30, 35, and 40 s, implying that the results obtained at 25 s were the most accurate. Time windows shorter than 25 s had higher false-negative results, while those longer than 25 s had higher false-positive results. Further, there was a significant reduction in the predictive competence and reliability of results at the 15-s time window during VM, suggesting a low diagnostic accuracy.
We further analyzed the correlation between RLS gradations obtained on c-TCD and c-TTE at different time windows. Only a few studies have directly analyzed the correlation between c-TCD and c-TTE for detecting cardiac RLS. We found a moderate correlation between c-TCD and c-TTE for the time windows ranging from 15 s to 40 s, with the 25-s window demonstrating the highest correlation. These findings are in support of our choice of the 25-s time window for diagnosing cardiac RLS in clinical practice.
MBs were detected within the first 25 s following injection in most of the positive tests (96.8%). However, in 3.7% of patients, MBs were detected beyond the 25-s time window during VM. We are unable to explain the clinical significance of this finding. There are studies that suggest that only large RLS are pathological, and that the smaller shunts may remain innocuous [21]. However, the minimum number of MBs that indicates clinically relevant RLS is yet to be established [22].
An important concern was if the 25-s monitoring window with c-TCD could differentiate cardiac RLS from pulmonary RLS (pRLS). Some authors have suggested that pRLS should be considered in cases of delayed detection of MBs [11,23]. Jauss et al. [11] suggested that a diagnosis of patent foramen ovale should be considered if at least one MB appears within 25 s of injection, and a diagnosis of pulmonary shunt if MBs are detected later than 25 s. Accordingly, some studies have attempted to determine a “cut-off time-interval” to distinguish the two types of shunts [24]. However, Horner et al. [25] reported that the difference in the meantime-intervals, from cubital injection of the contrast to its detection in the MCA, between cardiac (11 s) and pulmonary shunts (14 s) was small, and not statistically significant. Further, a study by Droste et al. [20] demonstrated that it may be impossible to definitively discriminate between the two shunts by c-TCD, owing to their overlapping time-intervals for the first appearance of MBs in the cerebral circulation. Therefore, although the delayed appearance of MBs may be suggestive of pRLS, there is no evidence in support of a clear “cut-off timeinterval”. Thus, with the current technology, the time window does not contribute to the differentiation between cardiac and pulmonary shunts.
Our study has important clinical implications. c-TCD is the method of choice for confirming cardiac RLS. In addition to being non-invasive and safe, c-TCD is a rapid bedside investigation that can be performed by a single investigator. It is the only technique that can detect the passage of emboli in the brain circulation following intravenous contrast agent injection. Our study identified the 25-s time window as being optimal for c-TCD-aided detection of cardiac RLS. The identification of a single, reliable time window will simplify c-TCD examination and facilitate the acceptance of this technique in the broader clinical community.
This study had several limitations. First, we did not perform contrast-enhanced transesophageal echocardiography (c-TEE) [26], which is considered as the gold standard investigation for the diagnosis of cardiac RLS. However, the purpose of this study was to determine the ideal time window for detecting cardiac shunts with c-TCD, and not to determine the precise cause of RLS. c-TEE is relatively invasive, timeconsuming, and expensive, and may not be applicable for the detection of RLS in developing countries. We performed c-TTE with second harmonic imaging, which is a method used by most hospitals to detect cardiac RLS, and is reported to have sensitivity and specificity that is comparable to that of c-TEE [27,28]. Our study was also limited by its small sample size. Further studies with larger numbers of patients are needed to confirm our results.
In conclusion, our study identified the 25-s time window as being optimal for the detection of cardiac RLS by c-TCD, based on ROC analyses and correlation with c-TTE findings.
Acknowledgements
We thank all the individuals who participated in the study.
Conflict of Interest
The authors declare no potential conflicts of interest with respect to the research, authorship, and/or publication of this article.
References
- Hagen PT, Scholz DG, Edwards WD. Incidence and size of patent foramen ovale during the first 10 decades of life: an autopsy study of 965 normal hearts. Mayo. Clinic proceedings 59(1), 17-20 (1984).
- Lechat P, Mas JL, Lascault G, et al. Prevalence of patent foramen ovale in patients with stroke. The. New. England. Journal. of. Medicine 318(18), 1148-1152 (1988).
- Xu WH, Xing YQ, Yan ZR, et al. Cardiac right-to-left shunt subtypes in Chinese patients with cryptogenic strokes: a multicenter case-control study. European. Journal. of. Neurology 21(3), 525-528 (2014).
- Wozniak L, Mielczarek M, Sabiniewicz R: Paradoxical brain embolism in a young man: is it only a patent foramen ovale? Neurologia. I. Neurochirurgia. Polska 49(1), 61-64 (2015).
- Knauth M, Ries S, Pohimann S, et al. Cohort study of multiple brain lesions in sport divers: role of a patent foramen ovale. BMJ. (Clinical research ed) 314(7082), 701-705 (1997).
- Yang Y, Guo ZN, Wu J, et al. Prevalence and extent of right-to-left shunt in migraine: a survey of 217 Chinese patients. European. Journal. Of. Neurology 19(10), 1367-1372 (2012).
- Komar M, Olszowska M, Przewlocki T, et al. Transcranial Doppler ultrasonography should it be the first choice for persistent foramen ovale screening? Cardiovascular. Ultrasound 12, 16 (2014).
- Schwarze JJ, Sander D, Kukla C, et al. Methodological parameters influence the detection of right-to-left shunts by contrast transcranial Doppler ultrasonography. Stroke 30(6), 1234-1239 (1999).
- Zanette EM, Mancini G, De Castro S, et al. Patent foramen ovale and transcranial Doppler. Comparison of different procedures. Stroke 27(12), 2251-2255 (1996).
- Klotzsch C, Janssen G, Berlit P. Transesophageal echocardiography and contrast-TCD in the detection of a patent foramen ovale: experiences with 111 patients. Neurology 44(9), 1603-1606 (1994).
- Jauss M, Kaps M, Keberle M, et al. A comparison of transesophageal echocardiography and transcranial Doppler sonography with contrast medium for detection of patent foramen ovale. Stroke 25(6), 1265-1267 (1994).
- Hao N, Liu K, Guo ZN, et al. Comparison of two contrast agents for right-to-left shunt diagnosis with contrast-enhanced transcranial Doppler. Ultrasound. In. Medicine. &. Biology 40(9), 2317-2320 (2014).
- Xing YQ, Guo YZ, Gao YS, et al. Effectiveness and Safety of Transcatheter Patent Foramen Ovale Closure for Migraine (EASTFORM) Trial. Scientific. Reports 6, 39081 (2016).
- Han K, Xing Y, Yang Y, et al. Body positions in the diagnosis of right-to-left shunt by contrast transcranial Doppler. Ultrasound. In. Medicine. Biology 41(9), 2376-2381 (2015).
- Schuchlenz HW, Weihs W, Beitzke A, et al. Transesophageal echocardiography for quantifying size of patent foramen ovale in patients with cryptogenic cerebrovascular events. Stroke 33(1), 293-296 (2002).
- Mangiafico S, Scandura S, Ussia GP, et al. Transesophageal echocardiography and transcranial color Doppler: independent or complementary diagnostic tests for cardiologists in the detection of patent foramen ovale? Journal. Of. Cardiovascular. medicine (Hagerstown, Md) 10(2), 143-148 (2009).
- Soliman OI, Geleijnse ML, Meijboom FJ, et al. The use of contrast echocardiography for the detection of cardiac shunts. European Journal Of Echocardiography 8(3), S2-12 (2007).
- Devuyst G, Despland PA, Bogousslavsky J, et al. Complementarity of contrast transcranial Doppler and contrast transesophageal echocardiography for the detection of patent foramen ovale in stroke patients. European. Neurology 38(1), 21-25 (1997).
- Droste DW, Reisener M, Kemeny V, et al. Contrast transcranial Doppler ultrasound in the detection of right-to-left shunts. Reproducibility, comparison of 2 agents, and distribution of microemboli. Stroke 30(5), 1014-1018 (1999).
- Droste DW, Kriete JU, Stypmann J, et al. Contrast transcranial Doppler ultrasound in the detection of right-to-left shunts: comparison of different procedures and different contrast agents. Stroke 30(9), 1827-1832 (1999).
- Job FP, Ringelstein EB, Grafen Y, et al. Comparison of transcranial contrast Doppler sonography and transesophageal contrast echocardiography for the detection of patent foramen ovale in young stroke patients. The. American. Journal. Of. Cardiology 74(4), 381-384 (1994).
- Jauss M, Zanette E. Detection of right-to-left shunt with ultrasound contrast agent and transcranial Doppler sonography. Cerebrovascular. Diseases (Basel, Switzerland) 10(6), 490-496 (2000).
- Yeung M, Khan KA, Shuaib A. Transcranial Doppler ultrasonography in the detection of venous to arterial shunting in acute stroke and transient ischaemic attacks. Journal. Of. Neurology. Neurosurgery. And. Psychiatry 61(5), 445-449 (1996).
- Teague SM, Sharma MK. Detection of paradoxical cerebral echo contrast embolization by transcranial Doppler ultrasound. Stroke 22(6), 740-745 (1991).
- Horner S, Ni XS, Weihs W, et al. Simultaneous bilateral contrast transcranial doppler monitoring in patients with intracardiac and intrapulmonary shunts. Journal. Of. The. Neurological. Sciences 150(1), 49-57 (1997).
- Nicholson WJ, Triantafyllou A, Helmy T, et al. Part 2: use of echocardiography in the evaluation of patients with suspected cardioembolic stroke. The. American. Journal. of. the. Medical. Sciences 330(5), 243-246 (2005).
- Maffe S, Dellavesa P, Zenone F, et al. Transthoracic second harmonic two- and three-dimensional echocardiography for detection of patent foramen ovale. European. Journal. of. Echocardiography 11(1), 57-63 (2010).
- Madala D, Zaroff JG, Hourigan L, et al. Harmonic imaging improves sensitivity at the expense of specificity in the detection of patent foramen ovale. Echocardiography . (Mount Kisco, NY) 21(1), 33-36 (2004).
