Research Article - Imaging in Medicine (2021) Volume 13, Issue 5
Assessment of radiation dose reduction potential and clinical utilization of automatic tube current systems
- Corresponding Author:
- Allen Mhagama
Department of Physics, University of Dodoma, Dodoma, Tanzania
E-mail: allen.mhagama@gmail.com
Abstract
This study investigated the patient dose reduction potential and clinical utilization of Automatic Tube Current Modulation (ATCM) systems in CT examinations. Assessment of the effectiveness of ATCM was conducted using standard CT phantoms of diameters 16 cm and 32 cm, and water phantoms of diameters 20 cm and 22 cm, which were scanned with and without activating ATCM. Assessment of clinical utilization of the ATCM systems was conducted by investigating in real time practice on utilization of ATCM during patient scanning, and from information of scan parameters were extracted from CT database for 125 patients that underwent different routine examinations at six multislice CT scanners acquired by six hospitals. From the database, information about the operation and utilization of automatic tube current modulation systems during different examinations was obtained. This information included the activation/ deactivation status of the systems, reference image quality mAs, effective mAs, mAs per slice and CTDIvol. In the phantom study, systems were found to reduce radiation dose with marginal increase in image noise, and that they are more effective in reduction of radiation dose for smaller patients than the large ones. Direct observations and analysis of the informations extracted from CT database revealed that most technologists had limited knowledge about the operation and utilization of the ATCM systems of respective scanners. These limitations were attributed to lack of standardization of different types and versions of the ATCM systems that are, in addition, not userfriendly. Some technologists claimed that the diagnostic image qualities were low when the ATCM systems were activated for some examinations. The radiographers and radiologists should attend the in-service training programmes to learn on how to operate and effectively utilize the ATCM systems. The CT scanner manufacturers should produce the standard and more user-friendly ATCM systems during future designs.
Keywords
ATCM ▪ Phantom ▪ Clinical ▪ Multislice ▪ Diagnostic
Introduction
High concern about radiation dose and cancer risks associated with CT examinations had been expressed in literature. Like elsewhere, CT examinations had been found to be the leading sources of collective dose in radiology in Tanzania [1,2]. To overcome the problem of radiation dose inherent in CT examinations, automatic tube current modulation systems have been introduced in most multislice CT scanners [3,4]. Tube current modulation adjust patient radiation dose depending on size, shape, and material composition of tissues or organs that constitute the scan region. There are three features of ATCM systems: Angular modulation, longitudinal modulation, and combined modulation as described in Table 1.
| Feature | Principle of modulation |
|---|---|
| Angular modulation | Tube load is adjusted during each gantry rotation according to size shape and attenuation of scanned region. |
| Longitudinal modulation | Tube load is adjusted along the z-axis according to size, attenuation of anatomic region and pre-determined image quality. |
| Combined modulation | Tube load is adjusted both during each gantry rotation and for each slice position. |
Table 1: Features ofATCMsystems [21].
Different manufacturers have different ATCM systems with different operation principle. Care Dose 4D is an ATCM system incorporated in Siemens CT scanners. Care Dose 4D system can be activated provided the topogram, which is alocalizer image for Siemens CT, of patient has been acquired and the image quality reference mAs set. Based on the topogram and the image quality reference mAs setting, the Care Dose 4D system learns patient attenuation profiles of different body sections in order to choose mAs values for different body sections. The mAs values used for different sections are automatically averaged and displayed on the scanner consoles as effective mAs. The effective mAs value can be lower, equal, or larger than the image quality reference mAs value. In the case, the patient size is smaller than the reference patient (32 cm in diameter); the effective mAs value used is lower than the image quality reference mAs value. Similarly, if the patient size is larger than the reference patient, then the effective mAs value displayed on the console will be larger than the image quality reference mAs [5,6]. If the user’s selection is slim, tube load modulation strength can further be selected as weak decrease, average decrease or strong decrease of tube load as described in Table 2. If the selection is obese, then weak, average, or strong selections will result into the weak increase, average increase, or a strong increase of tube current, respectively.
| Patient size | Modulation strengths | ||
|---|---|---|---|
| Weak | Average | Strong | |
| Slim | Weak decrease in tube load | Moderate decrease in tube load | Strong decrease in tube load |
| Obese | Weak increase in tube load | Moderate increase in tube load | Strong increase in tube load |
Table 2: Modulation strengths of Care Dose 4D systems [20].
Dose Right is the dose reduction systems builtin Philips CT scanners. This feature modulates radiation dose based on reference image quality.
The reference image quality setting is made after acquiring the surview of patient. The user then selects the suitable image of the previous examination from CT database. The system stores the selected image data, including the raw projection data and the surview. The stored information is taken as the data of a standard patient size (33 cm in diameter) to be used as a baseline for the Dose Right system when it proposes mAs values for different patient sizes to achieve constant image noise level [7,8]. The Dose Right system operates using three features: Automatic Current Selection (ACS), Dynamic Dose Modulation (D-DOM) and longitudinal dose modulation (Z-DOM). Currently, however, it is not possible to utilize all three modulation features simultaneously but one can use a combination of ACS with D-DOM or ACS with Z-DOM [9,10]. The ACS feature works with patient’s attenuation properties acquired from the surview and matched to the attenuation properties of the reference survey. If the patient size is larger than the reference patient, an increase of mAs values follows and vice versa. However, it is possible to use the mAs value that is different from that suggested by the ACS feature. In which case, the ACS feature will learn the user’s preference mAs settings interactively after few examinations [11,12]. The D-DOM feature is the tube current modulation based on patient’s symmetrical variations in the x-y-plane. This modulation is achieved online during each rotation, by utilizing data of previous rotation to determine the next modulation. The D-DOM feature makes use of the detector dose to assess the part of rotation that would benefit from the reduced dose without loss of diagnostic image quality [13,14]. The Z-DOM feature adjusts tube load according to changes in body attenuation profile along the longitudinal direction. The Z-DOM feature obtains the mAs values from the surview to achieve the same level of image quality along the z-direction.
During scanning, the Z-DOM feature varies mAs values continuously according to the attenuation variations of the body sections in the z-direction [15,16].
The ATCM system used by General Electric scanners is called AutomA 3D system. This system consists of AutomA and SmartmA features that provide longitudinal and rotational (angular) modulation, respectively. To activate the AutomA 3D feature, the scout of patient is acquired first, for the system to learn the attenuation profile of different body sections of patient [17,18]. After the scout has been acquired, the user then specifies noise index, minimum and maximum mA values. The noise index allows the user to set the required image quality and it is referenced to the image noise index, which influences quantum noise, in the central region of homogeneous water phantom [19,20]. The minimum and maximum tube currents define the range of tube current modulation desired for constant image noise for each slice position along the z-axis and during each rotation. The AutomA feature, which controls tube current modulation along the z-direction, can be activated without activating the SmartmA feature. On the other hand, the SmartmA feature, which adjusts tube current for different projection angles during each gantry rotation can only be activated provided the Automa feature is active [21,22]. Sure Exposure 3D is the ATCM system for Toshiba CT scanners. This feature offers two alternatives for image quality settings: the standard deviation of CT numbers or an image quality level. Both alternatives are, however, based on measurements of the standard deviation of CT numbers in a patient-equivalent water phantom [23,24]. To activate the Sure Exposure 3D system, the user first specifies the standard deviation for the image noise, minimum and maximum tube current values required for diagnostic image quality. The process follows with the acquisition of one frontal and one lateral scanogram. Information from the scanogram is used to map the selected image quality level to the corresponding tube currents. The Sure Exposure 3D system then makes use of the frontal and lateral diameters, and the intensity of the X-ray beam reaching the detector to account for the tube current modulation during each gantry rotation [25,26].
It can be evidently predicted from these complicated and unstandardized principles of operation of ATCM systems that the question of proper operation and utilization of the systems for patient dose and image quality optimization needs to be studied. Despite the potential of ATCM systems, questions of clinical utilization of these techniques have gained little or no attention in the literature.
This study therefore assessed radiation dose reduction potential based on patient size and clinical utilization of automatic tube current systems for patient dose and image noise optimization.
Materials and Methods
▪ Phantom study
A study of the influence of patient size on Care Dose 4D system optimization of patients dose and image noise was conducted at three different Siemens CT scanners which were acquired by three hospitals coded AK, TM and HS for privacy purposes and described in Table 3. The remaining three CT scanners in this table have been used in the next study [27,28].
| Hospital | Type and model | No. of detectors | Manufacturer | Manufacturer date | Installation date |
|---|---|---|---|---|---|
| MM | Siemens Somatom Emotion 6 |
6 | China Siemens | Nov 2008 | Jun 2009 |
| RM | Philips Brilliance 64 |
64 | USA Philips | Apr 2009 | Aug 2010 |
| TM | Siemens Somatom Sensation 16 |
16 | Siemens HealthCare German |
Mar 2012 | Aug 2012 |
| MN | Philips Brilliance 6 |
6 | Ohio USA Philips | Feb 2009 | Jun 2009 |
| HS | Siemens Somatom Perspective 128 |
128 | Siemens Shanghai Medical China | Jul 2012 | Sep 2012 |
| AK | Siemens Somatom Emotion 6 |
6 | Siemens HealthCare German |
Nov 2011 | Jul 2012 |
Table 3: Multislice CT scanner types and models acquired between 2009 and 2012.
To study the influence of patient size on the effectiveness of ATCM systems, four homogeneous tissue equivalent phantoms were used. These were two PMMA phantoms of diameters 16 and 32 cm, and two water phantoms of diameters 20 and 22 cm. The water phantoms used in this study were the water sections of the CT performance phantoms made respectively by the CT scanner manufacturers, and the American Association of Physicists in Medicine for evaluation of CT number and image noise [29,30]. For the sake of phantom homogeneity, the PMMA phantoms had their holes fitted with their insert rods.
The 16 cm PMMA phantom was placed in the scan plane, and the topogram image of the phantom was acquired. Based on the topogram, the scan range and the scan parameters settings for routine abdomen protocol were selected. This was followed by activating CareDose 4D system, and then the phantom scanned to acquire CT images of the phantom. The images were reconstructed using filtered back projection algorithm and smoothed using standard kernel for routine abdomen [31,32]. The CT ROI software tool was then used to draw a region of interest of about 0.5 cm2 at the centre of the reconstructed images and obtain the mean and standard deviation of CT numbers were then obtained from the selected region of interest. The same procedures were repeated when the Care Dose 4D system was off. Then, similar measurements were made for the 20 cm water section of manufacturers’ CT performance phantom, 22 cm water portion of ACR phantom, and 32 cm PMMA phantom using the same procedures [33,34]. The scan parameters used, the console CTDIvol values displayed, and the mean and standard deviation of the CT numbers obtained are presented in Appendix 1.
▪ Patient study
Assessment of clinical utilization of the ATCM systems was conducted by investigating in real time about operators practice on utilization of ATCM systems during patient scanning and information about scan parameters extracted from CT database for 125 patients that underwent different routine examinations at six multislice CT scanners acquired by six hospitals: MN, RM, TM, HS, MM, and AK. From the database, information about the operation and utilization of ATCM systems during different examinations was obtained. This information included the activation/deactivation status of the ATCM systems, reference image quality mAs, effective mAs, mAs per slice and CTDI vol.
Results and Discussion
▪ Phantom study
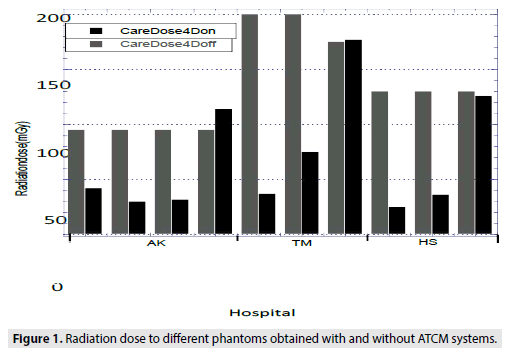
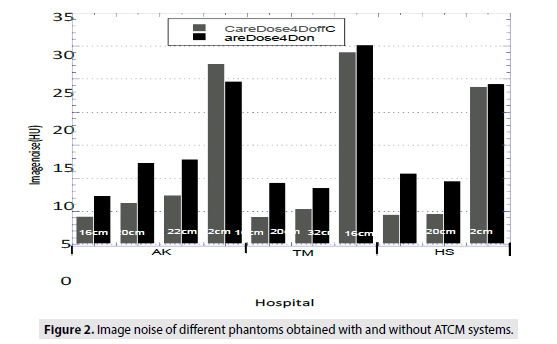
In the phantom study, large variations were observed in radiation dose and the image noise optimization as indicated in Figures 1 and 2. The observed variations could be attributed to differences in tube potentials, image quality reference mAs settings and phantom sizes as presented in Appendix 1.
In general, the Care Dose 4D systems performed dose reduction at the expense of increased image noise [35,36]. Despite the noise increase observed when the Care Dose 4D systems were on, as indicated in Figure 1, the appearance of the images obtained were not significantly different as compared to those obtained when the Care Dose 4D systems were off. On average, the scanner used at HS did well in dose reduction as compared. This can be explained by the use of lower reference image quality mAs setting of 130 mAs as presented in [37].
The Care Dose 4D systems have different dose and noise optimization features for different phantom sizes. It is evident that, radiation dose reduction was significant for small phantoms of diameters 16, 20 and 22 cm, and marginal for large phantom i.e. 32 cm diameter. This was expected because the systems were specifically designed to reduce dose for pediatric and small sized adult examinations. It is evident also from Table 4 that the radiation dose increased for the 32 cm diameter phantom scanned at AK and TM. This was expected because the system learned that this patient was obese. Thus, in order to maintain the preference image quality, the radiation dose had to increase. It was surprising to observe the marginal increase of both radiation dose and image noise for the 32 cm diameter phantom scanned at TM with the Care Dose 4D system activated, as indicated in Figures 1 and 2. This could be attributed to the use of low tube potential of 120 kV that has low penetrating capability at the reference mAs setting of 200 mAs, for large patients [38].
| Routine examination | Hospital | Patient Reg.No. | Patient age (y)/sex | kV | Ref.imagemAs | Eff.mAs or mAs/slice per exam |
|---|---|---|---|---|---|---|
| Chest | MM | 125 | 37/F | 130 | 70 | 52 |
| MM | 64 | 54/F | 130 | 70 | 35 | |
| AK | 332 | 75/F | 130 | 70 | 54 | |
| TM | 119-12 | 28/F | 120 | 100 | 63 | |
| MN | 439 | 32/M | 120 | - | 156 | |
| MN | 434 | 2/F | 120 | - | 79 | |
| MN | 432 | 36/M | 120 | - | 141 | |
| Abdomen | MM | 128 | 65/M | 130 | 120 | 77 |
| MM | 108 | 25/F | 130 | 120 | 93 | |
| MM | 56 | 64/M | 130 | 120 | 78 | |
| MM | 45 | 45/F | 130 | 120 | 63 | |
| MM | 101 | 29/M | 130 | 120 | 64 | |
| AK | 254 | 18/F | 110 | 60 | 24 | |
| AK | 304 | 4/M | 130 | 56 | 59 | |
| AK | 331 | 9/M | 130 | 95 | 27 | |
| TM | 116-12 | 38/M | 120 | 200 | 75 | |
| TM | 117-12 | 34/F | 120 | 200 | 135 | |
| TM | 123-12 | 38/M | 120 | 200 | 82 | |
| TM | 126-12 | 37/F | 120 | 200 | 104 | |
| TM | 127-12 | 56/F | 120 | 200 | 270 | |
| TM | TM-1 | 67/F | 120 | 200 | 171 | |
| TM | 186-12 | 51/F | 120 | 200 | 173 | |
| TM | 188-12 | 55/F | 120 | 200 | 87 | |
| TM | 188b-12 | 50/F | 120 | 200 | 111 | |
| TM | 190-12 | 59/F | 120 | 200 | 242 | |
| MN | 236 | 75/F | 120 | - | 205 | |
| MN | 420 | 59/F | 120 | - | 169 | |
| MN | 429 | 35/F | 120 | - | 213 | |
| C/spine | AK | AK-1 | 32/F | 130 | 190 | 188 |
| HS | 36/12 | 43/M | 130 | 190 | 72 | |
| L/spine | MM | 122 | 33/M | 130 | 190 | 124 |
| AK | 291 | 37/F | 130 | 190 | 172 | |
| AK | 294 | 22/F | 130 | 320 | 294 | |
| AK | 308 | 47/M | 130 | 190 | 132 | |
| HS | 23-Dec | 54/F | 130 | 190 | 180 | |
| HS | HS-1 | 62/F | 130 | 190 | 167 | |
| HS | HS-2 | 54/F | 130 | 190 | 135 | |
| Pelvis | MM | 97 | 20/M | 130 | 120 | 94 |
Table 4: Radiation dose reduction using different ATCM systems in various routine examinations.
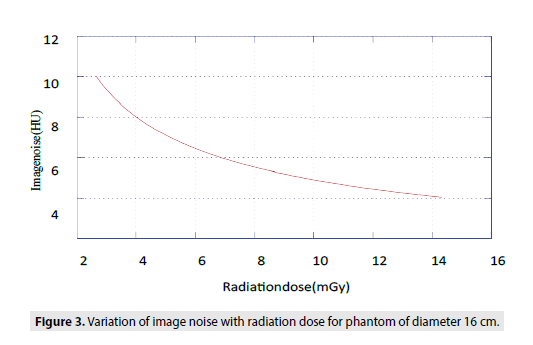
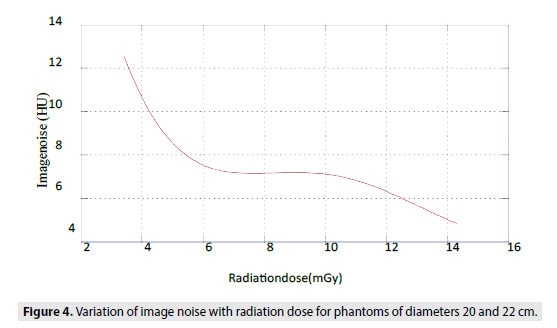
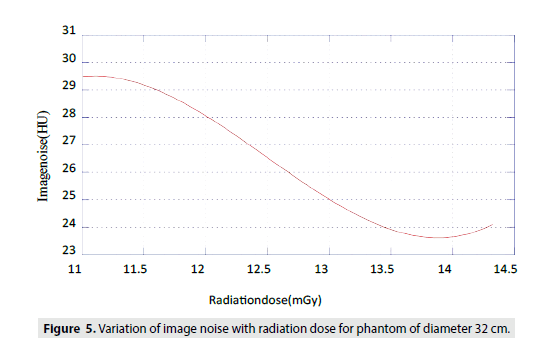
The plots of image noise against radiation dose for different phantoms sizes are presented in Figures 3-5. For small phantom (16 cm diameter), it was observed that noise varied inversely proportional to the square root of dose and shown elsewhere [39]. For medium phantoms (20 cm-22 cm diameters) and large phantom (32 cm diameter), the variations of image noises with radiation doses are less predictable, respectively as observed elsewhere [40]. This phantom study could not be performed at RM and MN because of failure to activate and deactivate the Dose Right systems (features). The same could not be performed at MM because the CT scanner was not working during these measurements.
▪ Patient study
In the patient study, generally, it was observed that most ATCM systems investigated in this study were automatically activated for most routine examinations. Conversely, the Dose Right system used in the Brilliance 64 scanner of RM was observed to be inactive for all examinations. In addition, Brilliance 6 scanner used at MN had only the ACS feature active with the D-DOM feature inactive in all examinations. The Z-DOM feature of Dose Right system could not be seen in scanner used by MN. Failure to activate Dose Right features of Philips scanners was attributed to technical limitations including the complicated procedures to be followed when selecting the preference reference image. It was further observed that, sometimes, the ACS feature of the Dose Right system of Brilliance 6 scanner used at MN was deactivated. This deactivation, however, occurred automatically provided the scan range limit was exceeded [41,42]. Likewise, it was observed that, modulation strength features (weak, moderate and strong) of the Care Dose 4D systems were not utilized. This was attributed to technical limitations including failure to access the software in the Siemens scanner consoles that could allow the selection for the modulation strength such as weak, moderate or strong, and the selection of the patient size as slim or obese.
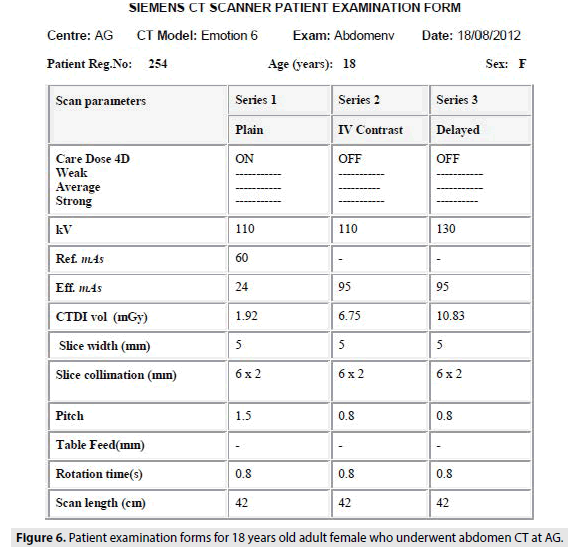
Direct observations revealed that most technologists had limited knowledge about the operation and utilization of the ATCM systems of respective scanners. These limitations were attributed to lack of standardization of different types and versions of the ATCM systems that are, in addition, not user-friendly. Some technologists claimed that the diagnostic image qualities were low when the ATCM systems were activated for some examinations as observed elsewhere [43,44]. This could explain why HS deactivated the Care Dose 4D systems for all examinations except lumbar spine. Similar was observed at AK during abdomen examination to the female patient whose form is shown in Figure 6.
In this case, the Care Dose 4D system was deactivated during the second and third series. The use of fixed mAs in the second and third series delivered radiation dose of 6.75 and 10.83 mGy, respectively as compared to 24 mGy when the Care Dose 4D system was on. Higher dose delivered in the third series was attributed to the use of larger tube potential of 130 kV compared to 110 kV used in the first and second series.
Also, this study assessed dose reduction effectiveness of different ATCM systems to patients undergoing routine examinations in different hospitals by comparing eff.mAs or mAs/ slice used for different examinations as presented, large variations of tube loads (radiation dose) used in similar examinations were observed in different hospitals. This could be attributed to variations of patient sizes, tube potentials and reference image quality mAs settings as presented in Appendix 1. It is evident from that, all the ATCM systems assigned low radiation doses to the chest (thorax). This was expected because the thorax constitutes a large volume occupied with air. High radiation doses assigned for the chest examinations at MN could be attributed to the variations of patient sizes and reference image mAs settings of the Dose Right systems.
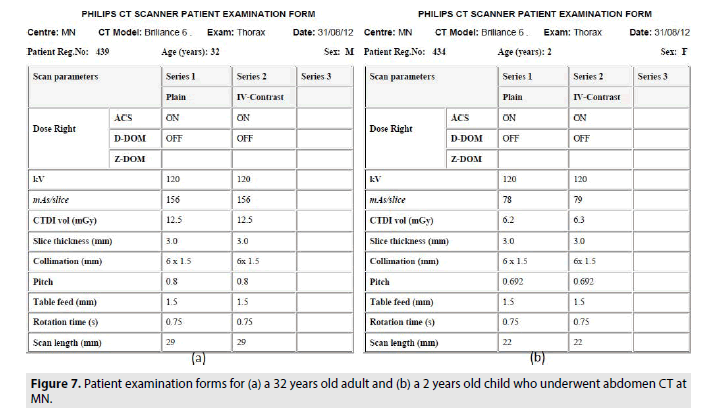
In addition, high doses for the chest (and other) examinations conducted at MN were expected because the Brilliance 6 scanner used at this hospital had only the ACS feature active with the rest (D-DOM or Z-DOM) being inactive or unavailable, respectively. However, it was interesting to observe that the scanner used by this hospital could reduce radiation dose significantly for children compared to adult patients as shown in Figure 7 and presented in Table 4.
Moreover, the Care Dose 4D system for the Emotion-6 scanner used by AK was observed to assign low abdomen dose compared to other scanners as presented. The use of low radiation dose for the abdomen CT at this hospital was attributed to the use of low reference mAs settings such as 56, 60 and 95 for three different abdomen examinations. Despite significantly dose reduction, the variations of the reference mAs settings are not recommended for individual patients but rather to the level of diagnostic image quality required by the hospital [45,46]. It was further observed in this study that, despite using the same settings of the reference image quality mAs (190 mAs) for lumbar spine examinations, the scanners used at MM, AK and HS assigned different radiation dose reduction. This was caused by variations in patient sizes and differences in the scanner designs.
Conclusion
This study assessed the patient dose reduction potential and clinical utilization of automatic tube current systems in CT examinations. In all cases, ATCM systems effectively reduced radiation doses with marginal reduction of subjective image quality. These systems reduced patient radiation doses by as much as 60%-88% for small patients. The dose reduction for larger patients was marginal and in some circumstances, the radiation doses slightly increased in order to maintain constant image noise. The observed dose reduction features were expected because the ATCM systems were specifically designed to be more effective in reducing dose for small patients especially children and young adults. Direct observations and analysis of the information extracted from CT database revealed that most technologists had limited knowledge about the operation and utilization of the ATCM systems of respective scanners. These limitations were attributed to lack of standardization of different types and versions of the ATCM systems that are, in addition, not user-friendly. Some technologists claimed that the diagnostic image qualities were low when the ATCM systems were activated for some examinations.
Recommendations
The technologists and radiologists should attend the in-service training programmes to learn on how to operate and effectively utilize the ATCM systems. The CT scanner manufacturers should produce the standard and more user-friendly ATCM systems during future designs. The use of cylindrical CT phantoms in the assessment the ATCM systems made it difficult to investigate all features of the ATCM systems. Thus, further study should use the anatomically shaped phantoms to assess the effectiveness, in terms of dose reduction, of all features of the ATCM systems.
References
- Ngaile JE, Msaki PK. Estimation of patient organ doses from CT examinations in Tanzania. J ApplClin Med Phys. 7(3): 80-94 (2006).
- Justin Ngaile, Assessment and Optimization of Patient Radiation Doses in Computed Tomography Examinations in Tanzania. MSc Thesis, University of Dares Salaam.
- Hanson KM. Detectability in computed tomographic images. Med Phys. 6(5): 441-451 (1979).
- Iball GR, Brettle DS, Moore AC. Assessment of tube current modulation in pelvic CT. Br J Radiol. 79(937): 62-70 (2006).
- Soderberg M. Automatic exposure control in CT: An investigation between different manufacturers considering radiation dose and image quality. Master of Science Thesis of the Lund University (2008).
- Philips Medical, Automatic dose right ACS customer service clinical education. Nederland B.V. Publication 453567506421 (2008).
- IEC 2003 Medical electrical equipments. Standard 60601-2-44 Ed 2 Amendment 1. ImPACT 2000 CT Patient Dosimetry Calculator Version.
- Kalra MK, Maher MM, Toth TL,et al. Strategies for CT radiation dose optimization.Radiology. 230(3): 619-28 (2004).
- AwedaMA, ArogundadeRA. Patient dose reduction methods in computerized tomography procedures.Int J Phys Sci. 2(1): 1-9 (2007).
- Clavijo CA, PelcNJ. Image quality optimization for dual energy computed tomography (dect) three-material decomposition. Rev Ing Biomed. 3(5): 33-42 (2009).
- Paterson A, Frush DP. Dose reduction in paediatric MDCT: General principles. ClinRadiol.62(6): 507-517 (2007).
- Berrington de GA, Darby S. Risk of cancer from diagnostic X-rays: Estimates for the UK and 14 other countries. Lancet. 363(9406): 345-51 (2004).
- Sodickson A, Baeyens PF, Andriole KP, et al. Recurrent CT, cumulative radiation exposure and associated radiation-induced cancer risks from CT of adults. Radiology. 251(1): 175-84(2009).
- Söderberg M, Gunnarsson M. Automatic exposure control in computed tomography: An evaluation of systems from different manufacturers. ActaRadiol. 51(6): 625-34 (2010).
- Boas FE, Fleischmann D. CT Artifacts causes and reduction techniques. Imaging Med. 4(2): 229-40(2012).
- Brenner DJ, Hall EJ. Computed tomography: An increasing source of radiation exposure. N Engl J Med. 357(22): 2277-84(2007).
- Brown S, Bailey DL, Willowson K, et al. Investigation of the relationship between linear attenuation coefficients and CT Hounsfield units using radionuclides for SPECT. ApplRadiatIsot.66(9): 1206-12 (2008).
- Brix G, LechelU,Veit R, et al. Assessment of a theoretical formalism for dose estimation in CT: An anthropomorphic phantom study. EurRadiol. 14(7): 1275-84 (2004).
- Kalender WA. X-ray computed tomography. Phys Med Biol. 51(13): 29-43 (2006).
- Kanal KM. ACMP Annual Meeting 2008. Seattle, WA: 3-18 (2008).
- Karla MK and Brady TJ Care dose4D new techniques for radiation dose reduction. TheMedical Siemens Magazine (2006).
- Kalra MK, Rizzo SM, Novelline RA. Reducing radiation dose in emergency computed tomography with automatic exposure control techniques. EmergRadiol.11(5): 267-74 (2005).
- Koller CJ, Eatough JP, Bettridge A. Variations in radiation dose between the same model of multislice CT scanner at different hospitals. Br J Radiol.76(911): 798-802 (2003).
- Livingstone RS, Eapen A, Dip NB, Hubert N. Achieving reduced radiation doses for CT examination of the brain using optimal exposure parameters. Indian J RadiolImag. 16(2): 247-251 (2006).
- Muhogora WE, Ahmed NA, Alsuwaidi JS, et al. Paediatric CT examinations in 19 developing countries: Frequency and radiation dose. RadiatProtDosimetry. 140(1): 49-58 (2010).
- Nishizawa K, Maruyama T, Takayama M, et al. Determinations of organ doses and effective dose equivalents from computed tomographic examination. Br J Radiol. 64(757): 20-8 (1991).
- ICRP Managing patient dose in multi-detector computed tomography (2006).
- Dose reduction in CT while maintaining diagnostic confidence: A Feasibility/Demonstration Study. IAEA TECDOC No. 1621 (2009).
- Powsner RA andPowsner ER Essential nuclear medicine physics. Second Edition, Blackwell Publishing, Massachusetts, USA.p133 (2006).
- AAPM Phantoms for performance, evaluation and quality assurance of CT scanners. Report No. 1 (1977).
- AAPM Measurement, reporting and management of radiation dose in CT. Report No. 96 of AAPM Task Group 23: CT Diagnostic Imaging council committee (2007).
- Shrimpton PC, Jones DG, Hillier MC, et al. Survey of CT practice in the UK, Part 2: Dosimetric aspects. National Radiation Protection Board (NRPB). R249, UK (1991).
- Shrimpton PC, Wall BF. CT: An increasingly important slice of the medical exposure of patients. Br J Radiol. 66(791): 1067-8 (1993).
- European guidelines on quality criteria for computed tomography.EUR 16262,Luxemburg, 2012.
- Hidajat N, Mäurer J, Schröder RJ,et al. Relationships between physical dose quantities and patient dose in CT. Br J Radiol. 72(858): 556-61 (1999).
- ElnourAM,Sulieman A. Optimization of patient dose in abdominal computerized tomography. JSci Tech. 12(1):58-64 (2011).
- Shrimpton PC. Assessment of patient dose in CT. Document NRPB-PE/1/2004 of National Radiological Protection Board (2004).
- Seifert H, Hagen T, Bartylla K, et al. Patient doses from standard and spiral CT of the head using a fast twin-beam system. Br J Radiol. 70(839): 1139-1145(1997).
- Shope TB, Gagne RM, Johnson GC. A method for describing the doses delivered by transmission x-ray computed tomography. Med Phys. 8(4): 488-95 (1981).
- Stamm G, Nigel DN. 2012 User’s guide CT-expo (8th Edn) Hannover-Buchholz. StoyanovD and VassilevaJInfluence of exposure parameters on dose and image noise in Computed Tomography. Pol J Med Phy Eng. 15 (4):215-226 (2009).
- Shrimpton PC, Hillier MC, Lewis MA, et al. National survey of doses from CT in the UK: 2003. Br J Radiol. 79(948): 968-80 (2006).
- Toshiba America medical systems sure exposure: Low dose, Diagnostic Image Quality (2012).
- Tsai HY, Tung CJ, Yu CC, et al. Survey of computed tomography scanners in Taiwan: Dose descriptors, dose guidance levels, and effective doses. Med Phys. 34(4): 1234-43 (2007).
- UNSCEAR 2000 Report volume 1: Sources and effects of ionizing radiation. Annex D: Medical Radiation Exposures.
- Wilting J. Technical Aspects of Spiral CT. Medicamundi. 43(1): 34-43 (1997).
- Zoetelief J, Geleijns J. Patient Doses in Spiral CT. British Journal of Radiology. 71 (846): 581-695 (1998).
