Mini Review - Clinical Investigation (2022) Volume 12, Issue 12
Automatic EEG Artifact Removal Using Blind-Source Separation Methods
Abstract
Electroencephalograms are often contaminated with artifacts. In this project, we explore two similar Blind-Source Separation methods that have potential for automated artifact removal. These methods are known as Canonical Correlation Analysis (CCA) and Independent Component Analysis (ICA). We successfully implement muscle artifact removal via CCA, and we also train a simple artificial neural network that can identify eye movement artifacts for removal via ICA with about 92% accuracy.
Keywords
Electroencephalogram • Diagnosis • Blind source
Introduction
An electroencephalogram, or EEG recording is a way of measuring brain activity in clinical settings to assist with diagnosis or monitoring of patients. The recording is captured using electrodes placed on the patient's scalp in a particular arrangement called the international 10 system-20 system then, voltage differences between pairs of electrodes are measured over time to produce an EEG plot. An EEG recording typically consists of 20 or more channels, where each channel is one of the electrode-pair voltage differences over time.
Seizure-related disorders are the primary reason for EEG monitoring. However, some seizures cause a patient to move involuntarily, and this movement creates high-frequency oscillations in the EEG known as muscle artifacts. These muscle artifacts can obscure information that may be important for treatment. For example, they make it difficult for physicians to determine the lateralization and localization of the onset zone of a partial seizure, which is important to know when considering a patient with refractory partial epilepsy for surgery [1]. This is sometimes remedied with high frequency filters, but these can also remove some relevant brain activity, so blind-source separation methods like CCA are preferable.
Other types of artifacts are common in EEGs as well, including artifacts caused by eye movement and “electrode pop” artifacts. In visual analysis of EEGs, these artifacts can be incorrectly mistaken for epileptic activity or other neurological phenomena. Therefore, an artifact removal feature is helpful to allow the interpreter of an EEG to make a more informed analysis. Furthermore, the identification and removal of artifacts is an essential preprocessing step for quantitative analysis of EEGs, in which only cerebral activity is relevant.
Blind-source separation
It is not ideal to simply ignore portions of the data that are contaminated with artifacts, since there may be clinically significant brain activity that is obscured by the artifacts. Ideally, it is best to isolate and remove non-brain activity while preserving the brain activity that occurs simultaneously. BlindSource separation methods are an effective way of solving this problem.
CCA and ICA are both blind-source separation methods and are used in similar ways to remove EEG artifacts with both methods following the same basic structure:
1. Decompose the EEG data into a set of components. Both methods intend to isolate artefactual activity into separate components from brain activity. Each channel of the original EEG data is made up of some linear combination of these components.
2. Determine which components are artefactual.
3. Reconstruct the data using the aforementioned linear combinations of components, while excluding the components that have been determined to be artefactual.
The result of these processes is a clean EEG with any identified artifacts removed from affected channels (with any underlying brain activity intact).
The decomposition into source signals is achieved by an algorithm that computes an unmixing matrix W, which gives the estimated source signals when multiplied by the original EEG data. Different algorithms are used by ICA and CCA. Note that although there are an equal number of EEG channels and source signals, there is not necessarily any correspondence between the two: a single EEG channel may be a linear combination of many or few source signals.
Canonical correlation analysis
One particularly effective technique for reducing the presence of artifacts in EEG data is Canonical Correlation Analysis, or CCA. It is most effective for removing muscle artifacts, due to muscle artifacts having lower autocorrelation than other components
Our implementation of CCA for muscle artifact removal is based on the 2006 paper “Canonical Correlation Analysis to Remove Muscle Artifacts from the Electroencephalogram” [2]. To implement muscle artifact removal using CCA in the Python programming language, we make use of the scikitlearn library's cancor method. The method accepts matrices X and Y as input. For an EEG recording with n samples and c channels, X is a matrix consisting of the first (n-1) samples, while Y contains the final (n-1) samples. Thus X and Y both have shape c* (n1) and contain mostly the same data, but Y is one sample ahead.
After using cancor. Fit, the c by c square transformation matrix W is stored in the attribute cca.x rotations. This is also called a demixing matrix, because multiplying X by this matrix yields a matrix S containing the estimated source components: i.e.the c time series where each is maximally autocorrelated while being uncorrelated with the other components. The inverse of W specifies the linear combinations of these source components that produce each of the channels in the original EEG data.
After obtaining the CCA components, we determine which components contribute most to muscle artifacts using an autocorrelation threshold. Muscle artifacts tend to be less auto-correlated than brain signals in EEG data. We access the autocorrelation value of each component using the corrcoeff method from Numpy. Then, we discard components with an autocorrelation value less than the threshold by changing the columns corresponding to these components in (W) to vectors of zeroes. Since the CCA method gives the components in order of decreasing autocorrelation, this means that some number of columns on the right of the matrix will be zeroed out, depending on the chosen threshold. Finally, we multiply the source signal matrix by the zeroed-out mixing matrix (W) to get the data with muscle artifacts removed.
CCA Results
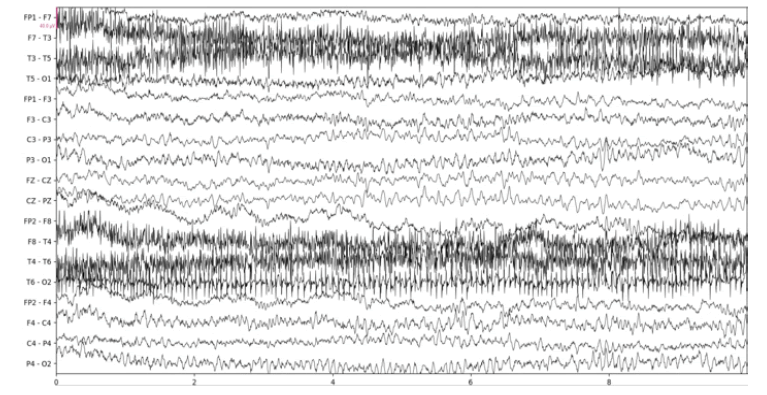
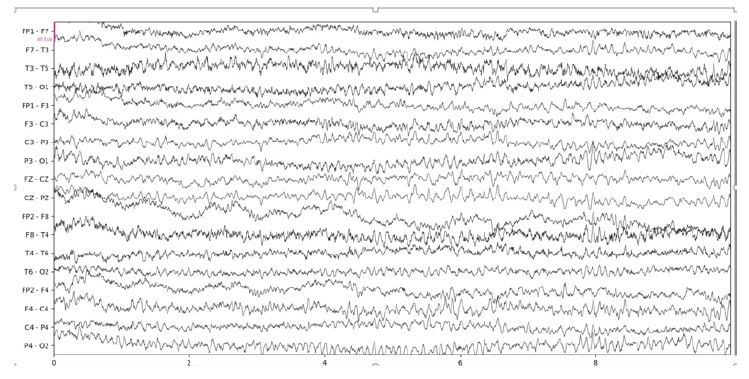
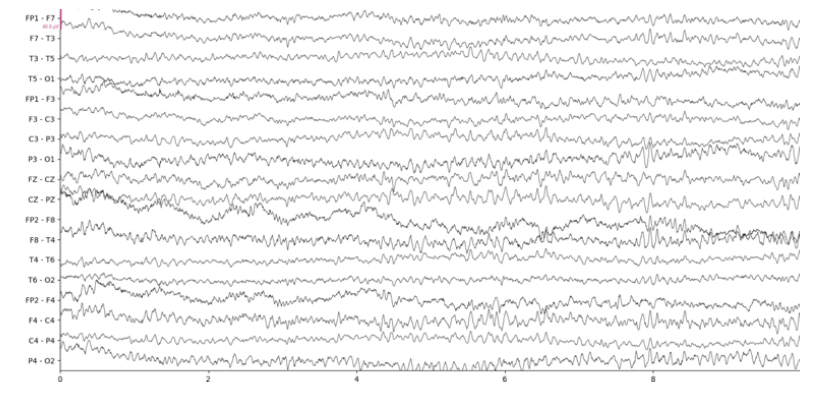
Below we show the results of our implementation of CCA for EEG muscle artifact removal. Figure 1a shows the original EEG recording, which has muscle artifacts affecting channels F7-T3, T3-T5, F8-T4, T4 to T6, and T6-O2. This recording was obtained from the Temple University Hospital EEG Corpus [3]. Figure 1b shows the same recording with muscle artifacts reduced using a conservative autocorrelation threshold of 0.35; and figure 1c shows the recording with muscle artifacts removed using a more aggressive autocorrelation threshold of 0.9. We use the MNE-Python library’s plotting functionality to plot the results
It is remarkable that even when using an aggressive autocorrelation threshold which causes more CCA components to be discarded, channels unaffected by the muscle artifact remain mostly unchanged by visual inspection. This is evidence of the effectiveness of CCA in isolating muscle artifacts. However, there are certainly some notable distortions such as a clear reduction in amplitude at the beginning of the F3- C3 channel. Our CCA Artifact Removal program was tried on various other EEGs with similar results. Collaborator and registered EEG technologist Jared Beckwith confirmed that the program seems to properly remove muscle artifacts.
Independent component analysis
Independent component analysis is another blind-source separation technique, but the source components obtained through this method differ from those obtained through CCA. Whereas CCA gives signals that are maximally auto-correlated and mutually uncorrelated, ICA gives signals that are statistically independent. One ICA algorithm called Info Max achieves this by minimizing the mutual information between the obtained source signals [4].
This is done by repeatedly updating a randomly initialized demixing matrix W until it converges:
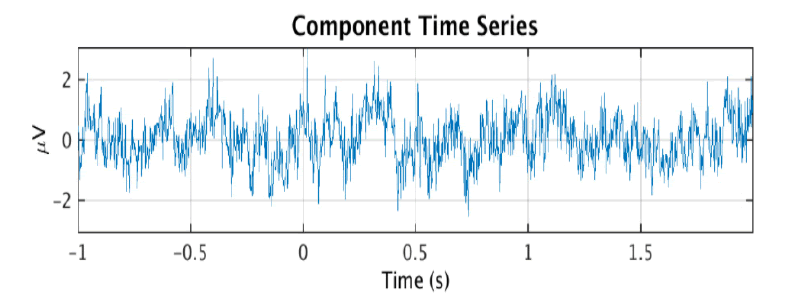
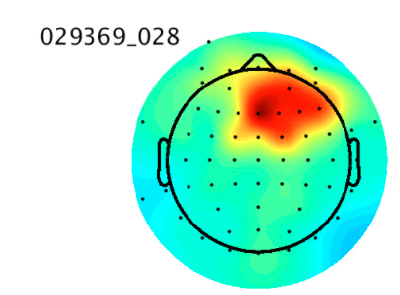
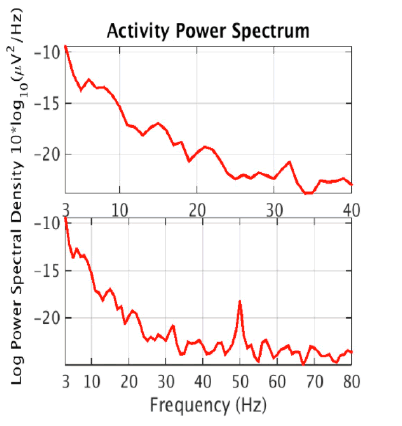
Then, the estimated source components make up the rows of the matrix S where S = WY. Note that tanh(Y) may be substituted for Y - tanh(Y) if the data is sub-gaussian. In practice, an extended version of this algorithm that is better at dealing with data of unknown gaussianity is used by software such as EEGLAB to perform ICA decomposition of EEG data [5]. ICA is more effective than CCA at isolating nonmuscle artifacts, which can include eye movement, heart, or electrical line noise artifacts. However, there is no simple way to automatically determine which of the ICA components are artefactual. This is usually done through manual visual inspection of the components and indicators like a scalp topography map or power spectral density which can be computed separately for each component. The figure below shows an ICA component and its scalp topography map, which is a visual representation of the strength of the component across the scalp. Its activity power spectrum is also shown, which shows the density of different frequencies in the time series. These features are important because they are used as input to our artificial neural networks. Th ese figures 2a, 2b and 2c were obtained from the IC [6] (Figure 2a-c).
Figure 2a:An ICA brain activity component
The scalp topographies of eye components tend to look as if there is a dipole, or small “bar magnet” creating an electrical field centered near the eyes [6]. An activity power spectrum concentrated under 5 Hz is also characteristic of eye components.
Some attempts have been made to automatically classify ICA components. The IC Label Project is one example, which uses Artificial Neural Networks trained on a large crowd-sourced dataset to classify ICA components, giving probabilities than an IC is brain activity or one of the following types of artifacts: muscle, eye, line noise, channel noise, or other [7]. In this project, we use a similar approach and the same dataset as IC Label to attempt to build a simple MLP-based classifier that can detect eye components
ICA automatic eye artifact recognition implementation
Like the CCA artifact remover, we implement the ICA eye component recognizer in Python. We use code provided by IC Label to load and normalize the data. We utilize the scikit-learn library’s MLP class to create and train the neural networks.
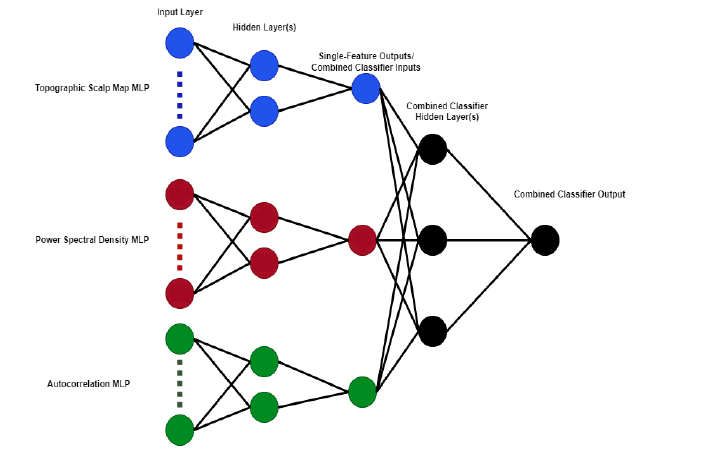
The IC Label dataset does not include the original independent components rather, it has various features that have been calculated from the original data including topographic scalp map images, power spectral density, and autocorrelation functions. We use each of these three features as inputs to separate multilayer perceptrons. Each of these MLPs has two hidden layers of size 2n and n respectively, where n is the size of the input layer. The components in the IC Label training set are labeled with estimated probabilities that the component is either brain activity, muscle artifact, eye artifact, line noise,channel noise, or other. For the purpose of training our classifiers to recognize eye components, we consider a component to be an eye component if that is the category with the highest labeled probability. Thus, in the unlikely worst-case scenario that a component has nearly equal probabilities for all categories, it may still be considered an eye component with a probability as low as 17%. This is a major limitation imposed by our decision to use binary classifiers: hybrid components which cannot be adequately described as a single type of artifact are not accounted for. After optimizing these three single-feature binary classifiers using the stochastic-gradient-descent based “adam” solver, we train a combined MLP that uses the output probabilities of the single-feature classifiers as input (Figure 3).
Results
We tested the three single-feature classifiers as well as the combined classifier on the 130 independent components from the ICLabel test data set, which contains ICs labeled by experts. The test set consists of 28 eye ICs and 102 non-eye ICs. We define an eye IC the same as we did in the training set an eye IC is one for which "eye" is labeled as the highest probability category, and a non-eye IC is any other IC (Table 1).
Table 1. Table of combined independent classifier
| Classifier | Accuracy | True Positives | False Positives | True Negatives | False Negatives |
|---|---|---|---|---|---|
| Topographic | 90% | 25 | 10 | 92 | 3 |
| Autocorrelation | 83% | 7 | 1 | 101 | 21 |
| PSD | 78% | 0 | 0 | 102 | 28 |
| Combined | 92% | 23 | 5 | 97 | 5 |
Of the single-feature classifiers, the topographic classifier is most successful. This classifier has 90% accuracy, and correctly identifies all but 3 of the eye ICs. However, this classifier also has 10 false positives, which is the highest false-positive rate out of the four classifiers.
The PSD classifier appears to have learned very little, if anything it invariably classifies all of the 130 ICs as non-eye ICs. It gives slightly different output probabilities for each IC, ranging between 30 and 40% probability of being an eye IC, but none are over 50% so none are classified as an eye IC.
The autocorrelation classifier is between the other single-feature classifiers in effectiveness. This classifier correctly identifies seven eye ICs with only one false positive; but like the PSD classifier, the output tends to err towards a non-eye classification resulting in many false negatives.
The combined classifier was more effective than any of the single-feature classifiers. It is 92% accurate, showing slight improvement over the topographic classifier. The main area of improvement is a lower false positive rate which raises its accuracy overall even though it identifies two fewer true positives.
Conclusions and Future Improvements
We are pleased with the performance of the CCA Artifact remover, although this is based only on qualitative inspection. In the future, we hope to implement quantitative measures to test its performance. In addition, it would be helpful to plot the original EEG as well as the artifact-removed EEG on the same plot, since this would make it easier to see where channels have been modified, and make comparisons to other methods like high-frequency filters.
performance. In addition, it would be helpful to plot the original EEG as well as the artifact-removed EEG on the same plot, since this would make it easier to see where channels have been modified, and make comparisons to other methods like high-frequency filters.
We did not expect great performance from any of the single-feature classifiers, as even an expert cannot usually classify an IC with confidence without looking at multiple features. Despite its high falsepositive rate, the topographic classifier exceeded expectations and was surprisingly effective. The combined classifier which took the scalp topography, power spectral density, and 1 second autocorrelation functions into account performed best, but only slightly better than the topographic classifier. We expect that we could get better results by using more advanced neural network architectures. Our neural network structure is extremely minimal, as we use only basic multilayer perceptrons with a couple of hidden layers. A more sophisticated approach would involve convolutional neural networks these are the types of artificial neural networks that were used to train the classifier used in the original IC Label study. CNNs are especially good at recognizing shapes in image data, which makes them well-suited for identifying the "dipole near the eyes" shape that is characteristic of the scalp topography maps of eye components.
Although the IC Label training dataset is incredibly large, containing over 200,000 components, only 5937 of these are labeled with category probabilities. Since our classifier was supervised, we could only use these 5937 IC components for training. A semi-supervised rather than completely supervised approach would allow us to better leverage the size of the dataset to improve training results.
References
- Vergult A, De Clercq W, Palmini A, et al. Improving the interpretation of ictal scalp EEG: BSS-CCA algorithm for muscle artifact removal. Epilepsia. 48(5):950–58(2007).
[Google Scholar] [Crossref]
- De Clercq W, Vergult A, Vanrumste B, et al. (2006). Canonical correlation analysis applied to remove muscle artifacts from the electroencephalogram. IEEE trans bio-med eng. 53(12):2583–87(2006).
- Obeid, I., & Picone, J. The Temple University Hospital EEG Data Corpus. Augment. Brain Funct: Facts Fict Controv. 1:394–398(2018).
- Langlois D, Chartier S, and Gosselin D. An Introduction to Independent Component Analysis: InfoMax and FastICA algorithms. Tutor Quant Methods Psychol. 6(1):31–8(2010).
[Google Scholar] [Crossref]
- Lee TW, Girolami M, and Sejnowski TJ. Independent component analysis using an extended infomax algorithm for mixed subgaussian and supergaussian sources. Neural comput. 11(2):417–41(1999).
- SCCN: Independent Component Labeling. (2022).
[Google Scholar] [Crossref]
- Pion TL, Kreutz DK, and Makeig S. ICLABEL:An automated electroencephalographic independent component classifier, dataset, andwebsite. NeuroImage. 198:181-197(2019).
