Research Article - Neuropsychiatry (2018) Volume 8, Issue 6
Cathepsin B Regulates the Activation of NLRP3 Inflammasome by Calcium Signaling
- Corresponding Author:
- Hua Bai
The Medical Experiment Center at Third Affiliated Hospital of Guizhou Medical University, China
Abstract
Cathepsin B (CatB) is a proteolytic enzyme present in the cytosol which catalyzes the hydrolysis of benzoyl-L-argininamide. Whether CatB can regulate the activation of NLRP3 inflammasome by affecting calcium signal is worth studying. The specific siRNA targeting CatB gene was designed. CatB gene silencing cell line (CB-si-BV2) was established in microglia BV2, and BV2 cells were treated with hydrogen peroxide. GdCl3, Cat-B inhibitor CA-074Me, calcium ion chelating agent BAPTA-AM were used to treat cells simultaneously or separately. NLRP3 protein was detected by Western Blot. NLRP3 mRNA was detected by qPCR. IL-1β and Caspase-1 were detected by ELISA. Cell viability was detected by MTT assay. Cell apoptosis was detected by Hoechst33258 staining. After treatment with hydrogen peroxide, the expression of NLRP3 protein and caspase-1 mRNA increased in BV2 cells. After adding GdCl3, the expression of NLRP3, NLRP3 mRNA, Caspase-1 and IL-1β were significantly increased. After treated with GdCl3, some NLRP3 protein was detected in CB-si-BV2 cells, NLRP3mRNA and Caspase-1 increased, compared with the control group, the difference was statistically significant. After treated with BAPTA-AM, NLRP3, NLRP3mRNA and Caspase-1 were significantly reduced. The growth rate of some CB-si-BV2 cells was significantly slowed down. There was more apoptosis of CB-si-BV2 cells in H2O2 group and (H2O2+GdCl3) group. In the microglial oxidative stress model, CatB plays a role in regulating the activation of NLRP3 inflammasome, which is probably mediated by calcium signaling.
Keywords
Hydrogen peroxide, Cathepsin B, NLRP3 inflammasome, Gadolinium trichloride, Gene silencing
Introduction
Alzheimer’s disease (AD) is a brain degenerative disease with progressive development that seriously endangers human health. Beta amyloid (Aβ) is closely related to onset of AD [1]. Aβ activates microglia Nucleotides in the cell bind to the inflammasome of the oligomerized domainlike receptor protein 3 (NLRP3), leading to a Neuro-inflammatory response in the brain that promotes the development of AD [2]. BV-2 cells are immortalized cells that are obtained by inoculation of primary cultured mouse microglia with the retrovirus carrying the oncogene v-myc, which basically possesses the morphology of primary cultured microglia, Phenotypes and various functional features. Oxidative stress injury models induced by hydrogen peroxide (H2O2) -induced BV-2 cells have been used to study neurodegenerative diseases such as AD intuitively [3]. The correlation between calcium ion and NLRP3 inflammasome activation has made great progress. Murakami et al. [4] found that calcium flux plays a key role in the activation of NLRP3 inflammasome after a variety of stimuli, blockade of calcium flux can inhibit the assembly and activation of NLRP3 inflammasome, calcium ion Signal-mediated mitochondrial damage induces the activation of NLRP3 inflammasome. Adenylate cyclase agonist Forskolin can increase intracellular cAMP and inhibit the activation of NLRP3 inflammasome. Lee et al. [5] found that Calcium Sensitive Receptor (CASR) activates the NLRP3 inflammasome by increasing intracellular calcium concentration and decreasing intracellular cAMP. CASR can activate the NLRP3 inflammasome by phospholipase C, which occurs during this process, catalyzes the production of 1, 4,5 trimethylolmethanephosphoinositide and thereby induces the release of calcium ions from the endoplasmic reticulum storage pool. However, some of the upstream signals of calcium-regulated NLRP3 inflammasome activation remain unclear. Cathepsin B (CatB) is a proteolytic enzyme present in the cytosol that catalyzes the hydrolysis of benzoyl-Largininamide, an end peptidase similar to papain. CatB has recently been found to have a close relationship with apoptosis. The multiple intracellular and extracellular stimuli can cause changes in lysosomal membrane permeability, leading to the release of CatB from the lysosome into the cytoplasm, which is involved in the activation of apoptotic pathways [6,7]. Liu et al. [8] found that the CatB inhibitor cyclooxygenase succinyl methyl ester (CA-074Me) attenuated cardiac insufficiency and promoted myocardial remodeling by the NLRP3 signaling pathway in an experimental rat myocardial infarction model [8]. The release of lysosomal rupture has the effect of activating the NLRP3 inflammasome, most likely CatB at work, and CatB reactivates NLRP3 inflammasome by degrading the NLRP3 inhibitory protein. We hypothesize that CatB is an upstream signal of activation of the NLRP3 inflammasome and this activation may require mediation of calcium signaling. Apart from activating NLRP3 inflammasome by Ca++ combination with CASR, extracellular calcium can also activate NLRP3 inflammasome via G-protein coupled receptors [9]. We have found that the expression of caspase-1 and IL-1βprotein did not change significantly in SHSY5Y cells treated with H2O2 alone. After treated with calcium ionophore A23187, NLRP3 protein expression increased significantly, caspase-1 and IL-1β expression also significantly increased, suggesting that calcium overload may promote NLRP3 inflammasome activation [10]. Based on the above research results, this project focuses on whether CatB can regulate the activation of NLRP3 inflammasome by affecting the changes of calcium signal in cellular oxidative stress and specific gene silencing cell models.
Materials and Methods
▪ Experimental Materials
BV-2 cells were purchased from Shanghai Tongpai Biotechnology Co., Ltd in China. Hydrogen peroxide (H2O2) and gadolinium trichloride (GdCl3) were purchased from Sigma Company from USA. Calcium complexing agent BAPTA-AM was purchased from Calbiochem Company in USA. CA-074Me was purchased from Shanghai Haoran Biotechnology Co., Ltd in China. DMEM / F12 medium, fetal bovine serum, 0.25% trypsin, PBS were purchased from Shanghai Geno Pharmaceutical Biotechnology Co., Ltd IN China. Rabbit anti-human NLRP3 antibody, Tubulin and HRP-labeled anti-biotin antibody were purchased from Cell signaling Technology, USA. ELISA Kit for detecting Casepase-1 and IL-β was purchased from Bio- Rad Laboratories. Fluorescent probe Fluo 3-AM was purchased from Shanghai Dong Ren Chemical Technology Co., Ltd in China. Low-temperature desktop centrifuge and CO2 incubator were purchased from Germany Heraeus Company. Vertical electrophoresis and MDL550 enzyme quantitative detector were purchased from the United States BIO-RAD company. BCA protein quantitative kit was purchased from Boster Biological Engineering Co., Ltd. ECL hypersensitivity Western blot detection kit was purchased from Amersham in USA. ABC complex and DAB color were purchased from Vector Company of the United States. Real-time quantitative PCR instrument was purchased from the United States BIORAD company.
▪ Experimental methods
▪ Cell culture and group processing
BV2 cells were adherently grown in RPMI1640 medium supplemented with 12% fetal bovine serum (plus low concentrations of penicillin and streptomycin) and incubated at 37°C in a 5% CO2 incubator for 4-6 days of passage once; select the logarithmic growth phase of the cell experiments. Experiment divided into 4 groups. The first group was PBS treatment group, as the control group, the cells were incubated with PBS 5ml for 20 minutes, and then the RNA or total protein of the cells were extracted or cultured according to the experimental requirements. The second group was H2O2 group, which was treated with 0.5 mmol/L H2O2 incubate the cells for 20 minutes and then extract the RNA or total protein of the cells. The third group was (H2O2 + GdCl3) group. The cells were treated with 0.5 mmol / L H2O2 for 20 min and then treated with 2 mmol/L GdCl3 for 15 min. Finally, the cellular RNA or total protein was extracted. The fourth group was (The cells were pre-treated with 5 μmol/L CA-074Me (or BAPTA-AM) for 10 min, followed by the addition of 0.5 mmol/L H2O2 to co-treat with H2O2 + GdCl3 + CA-074Me or H2O2 + GdCl3 + BAPTA- Cells for 20 min, and then replaced with 2 mmol / L of GdCl3 treated cells for 15 min, the final cellular RNA or total protein extraction. If you want to analyze the cell growth, after the above treatment is continued to replace the 1640 medium according to the required program culture.
▪ Plasmid construction and cell transfection
The complete sequence of the human CatB gene was obtained from Gene Bank. Note the more than 20 nucleotides downstream and remove the sequence with high homology to other genes. The selected sequence is: 5’-CGGCTGTAATGGTGGCTAT-3’. Using pSilencer-U6 as the plasmid vector, two DNA templates of single shRNA were designed and synthesized for single strand of selected SiRNA sequence, annealed in vitro to form doublestranded SiRNA fragments, T4 DNA ligase was inserted into the double linear digestion of BamHⅠand HindIII PSilencer-U6, the ligated plasmid was transformed into competent E. coli. Then send the gene sequencing identification, a large number of plasmid preparations after success. When empty vector was used as a blank control, BV2 cells were transfected into BV2 cells with Lipofectamine-2000 transfection reagent when the cells grew to about 70%. The culture was continued at a G418 screening concentration for 10-20 days; single clones were picked and expanded. The transfected cells obtained were named CB-s-BV2 cells. BV2 cells and CB-s-BV2 cells were passaged for 4-6 days at the same time, total protein was extracted, and Western blotting analysis was used to identify and compare the expression of cathepsin.
▪ MTT colorimetric assay cell growth activity
The CB-s-BV2 cells were seeded in 96-well plates, after each group of reagents treatment, in the medium by adding 1g/L of thiazolyl blue, incubated for 4 h at 37°C, aspirate the medium, each hole by adding 150 μl of Methyl sulfoxide (DMSO), shaken for 10 min. The experimental operation set the zero holes, the control hole and dosing hole; zero hole plus medium, MTT, DMSO; control wells and dosing wells should add cells, culture medium, MTT, DMSO. The micro plate reader was used to detect the optical density of each well at a wavelength of 490 nm. The number of viable cells was indirectly measured and the cell growth curve was analyzed.
▪Western Blot
The expression of NLRP3 protein was detected by Western Blot and the specific operation points were as follows. After the cells in each group reached the processing time, the culture broth was discarded, washed once with pre-cooled PBS, added with 200 μl of RIPA cell lysate and PMSF, lysed on ice for 20 min, centrifuged at 12000 g and 4°C for 10 min, supernatant, BAC protein quantitative detection. Take 30 μg protein for SDS-PAGE electrophoresis, electrophoresis at 80 V for 30 min, then electrophoresis at 120 V 90 min, then electroporation at 250 mA 80 min. Block with TBST (10 mmol / L Tris-HCI + 0.15 mol/L NaCI + 0.1% Tween-20) containing skim milk powder for 60 min. Add appropriate dilution of primary antibody (NLRP3 antibody and Tubulin antibody) overnight at 4°C, then add the corresponding biotinylated secondary antibody, at room temperature for 120 min; then add the ABC complex, at room temperature for 30 min, then add DAB color. Tubulin for the control, under the same conditions repeated 3 times. The banding gray of the Western Blot test was done using BIO-RAD’s Quantity-One analysis software.
▪ Real-time quantitative polymerase chain reaction
Mononuclear cells (BMNCs) in blood were isolated by Ficoll density gradient centrifugation and stored in a freezer at -80°C for later use. The sample RNA was extracted by Invitrogen’s TRIzol kit and reverse transcribed into cDNA by reverse transcriptase kit instructions. Primer sequence design based on DNAMAN software.
NLRP3 upstream primer: 5 ’ . C C A C A A G A T C G Y G A G A A A A . CCC. 3’, downstream primer: 5’ -CGGTCCTATGTGCTCGTCA-3’ , β-actin upstream primer: 5’ ATGATGGCTTATTACAGTGGCAA-3’, and downstream primer: 5’-GTCGGAGATTCGTAGCTGGA-3’. Reaction conditions: 95℃ 30 S pre-denaturation, 95℃, 15 S denaturation, 60℃ 1 min annealing, 60℃ 1 min extension, 40 cycles. The relative expression level of mRNA was calculated according to the convention formula. Β-actin as an internal reference.
▪ ELISA
Detection of casepase-1 and IL-1β in cells was performed by double antibody sandwich enzyme-linked immunosorbent assay (ELISA), and the ELISA kits were all constructed in Shanghai Arashi Biotechnology Co., Ltd. strictly according to the reagents Box instructions operation. Using BIO-RAD-680 micro plate reader, 630/450nm dual wavelength OD value, the OD value of the vertical axis, the sample concentration as the abscissa, draw a standard curve and calculate the sample concentration. Each test repeated 5 times, take the average.
▪ Analysis of cell apoptosis by Hoechest 33258 staining
CB-si-BV2-treated cells in each group were fixed with acetic acid/ethanol fixing solution; PBS was rinsed for 5 minutes; stained with Hoechst 33258 working solution for 15 minutes at room temperature; PBS rinsed three times, each time for 5 minutes; finally with a mixture of glycerol and PBS ratio of 1: 9 mixture, the fluorescence microscope. The morphological changes of apoptotic cells were blue fluorescence. Each group of cells with a counter count the number of apoptotic cells in 100 cells, a total of 3 times, takes the average, calculate the incidence of apoptosis.
Determination of intracellular calcium ion concentration
Prepare the BV2 cells treated with adherent growth on glass coverslips, rinse once with HEPES solution, add fluorescent probe Fluo 3-AM 1 μL at a concentration of 1 mol/L, waiting for 5-10 seconds, followed by laser scanning confocal microscope (US BIO-RAD MRC- 1024 type) detection of intracellular calcium ion concentration. The excitation light parameters were 488nm and the emission parameters were 530nm. The result was the relative value of fluorescence phase in each group.
▪ Statistical analysis
SPSSl6.0 statistical software is used to analyze the experimental data and the experimental data using mean + / - standard deviation (X ± SD), according to comparison between groups using single factor analysis of variance (One - way ANOVA), and compared by t-test in the group. P<0.05 was considered to be statistically significant.
Results
▪ P Silencer-cathepsin B plasmid construction and cell transfection
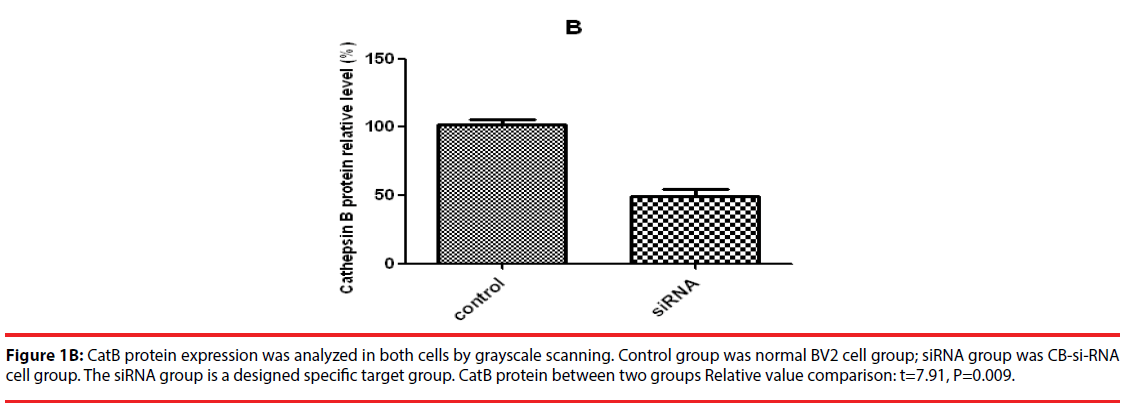
Western blot was used to detect the expression level of cathepsin B in transfected cells. The results showed that the protein expression level of cathepsin B in siRNA-1 interference group was significantly lower than that in control group the expression of cathepsin B protein was significantly different from that of β-actin protein. The relative optical density values of cathepsin B were compared while β-actin as an internal control. The result showed that the difference was statistically significant (Figure 1A and B).
Figure 1B: CatB protein expression was analyzed in both cells by grayscale scanning. Control group was normal BV2 cell group; siRNA group was CB-si-RNA cell group. The siRNA group is a designed specific target group. CatB protein between two groups Relative value comparison: t=7.91, P=0.009.
▪ NLRP3 protein expression in BV2 cells and transfected cells at each group
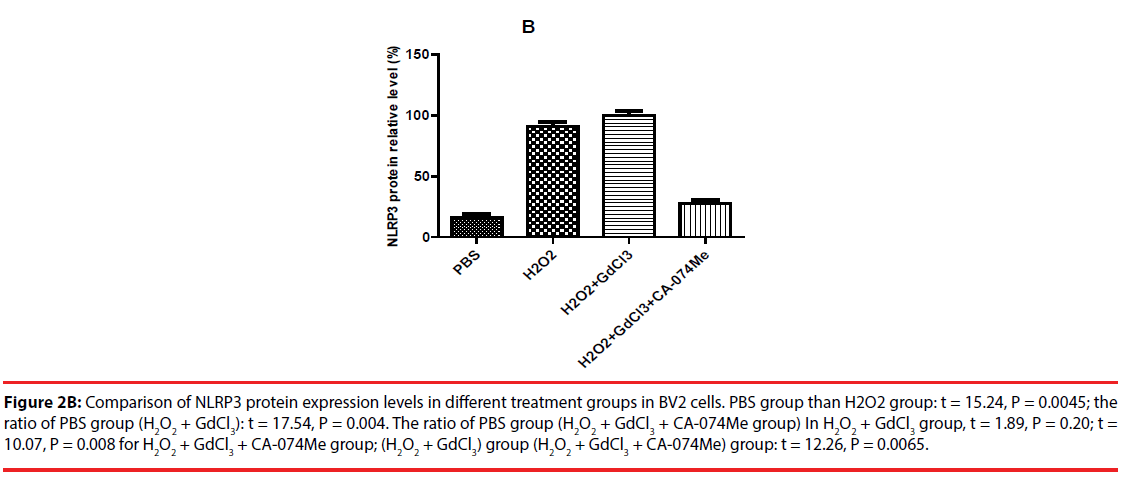
The expression of NLRP3 protein in H2O2- treated group was increased by about 70% compared with PBS-treated group. The expression level of NLRP3 protein in (H2O2+GdCl3) group was increased by about 80% compared with PBS treatment group. The treatment group (H2O2+ GdCl3 + CA- 074Me) was about 12% higher than the control group. In addition, the comparison of NLRP3 protein expression between H2O2 group and (H2O2+ GdCl3+CA-074Me) group (P=0.008), or the comparison between (H2O2+GdCl3) group and (H2O2+ GdCl3+ CA-074Me) group were statistically significant (P=0.0065) (Figure 2). There was no statistically difference between H2O2 group and (H2O2+GdCl3) group (P>0.05).
Figure 2B: Comparison of NLRP3 protein expression levels in different treatment groups in BV2 cells. PBS group than H2O2 group: t = 15.24, P = 0.0045; the ratio of PBS group (H2O2 + GdCl3): t = 17.54, P = 0.004. The ratio of PBS group (H2O2 + GdCl3 + CA-074Me group) In H2O2 + GdCl3 group, t = 1.89, P = 0.20; t = 10.07, P = 0.008 for H2O2 + GdCl3 + CA-074Me group; (H2O2 + GdCl3) group (H2O2 + GdCl3 + CA-074Me) group: t = 12.26, P = 0.0065.
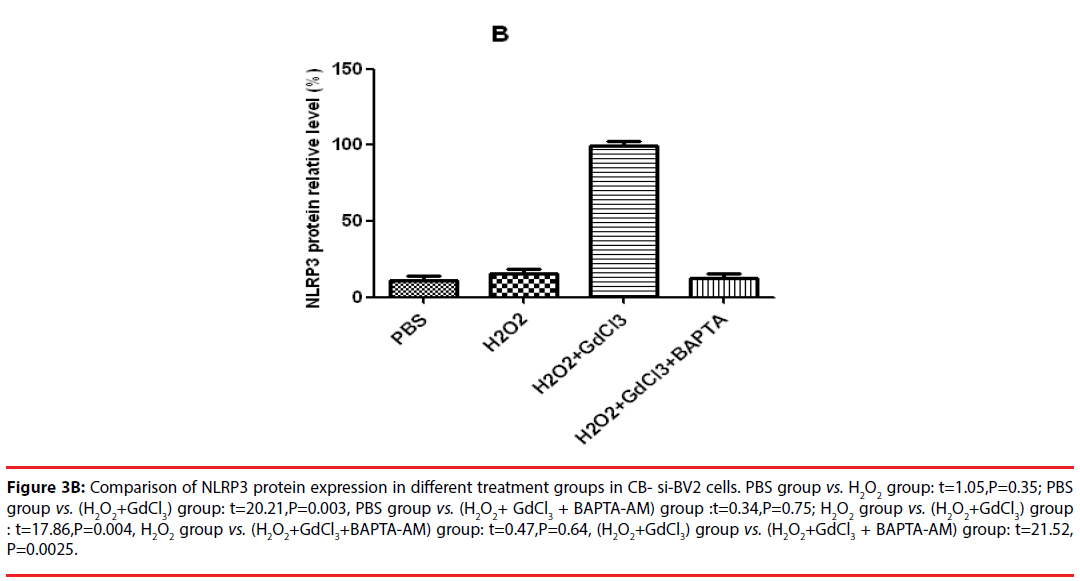
In the analysis of CB-si-BV2 cells, it was found that the expression level of NLRP3 protein in (H2O2 + GdCl3) group was increased by about 40% compared with that in normal control group. Compared with PBS group or H2O2 group, (H2O2 + GdCl3 + CA-074Me) group, the difference of NLRP3 protein expression level was statistically significant (t = 20.21, P = 0.003. t = 17.86, P = 0.004. t = 21.52, P = 0.0025).
There was no significant difference between the other groups (P > 0.05) (Figures 3A and 3B).
Figure 3B: Comparison of NLRP3 protein expression in different treatment groups in CB- si-BV2 cells. PBS group vs. H2O2 group: t=1.05,P=0.35; PBS group vs. (H2O2+GdCl3) group: t=20.21,P=0.003, PBS group vs. (H2O2+ GdCl3 + BAPTA-AM) group :t=0.34,P=0.75; H2O2 group vs. (H2O2+GdCl3) group : t=17.86,P=0.004, H2O2 group vs. (H2O2+GdCl3+BAPTA-AM) group: t=0.47,P=0.64, (H2O2+GdCl3) group vs. (H2O2+GdCl3 + BAPTA-AM) group: t=21.52, P=0.0025.
▪ NLRP3mRNA expression changes in BV2 cells and transfected cells at each group
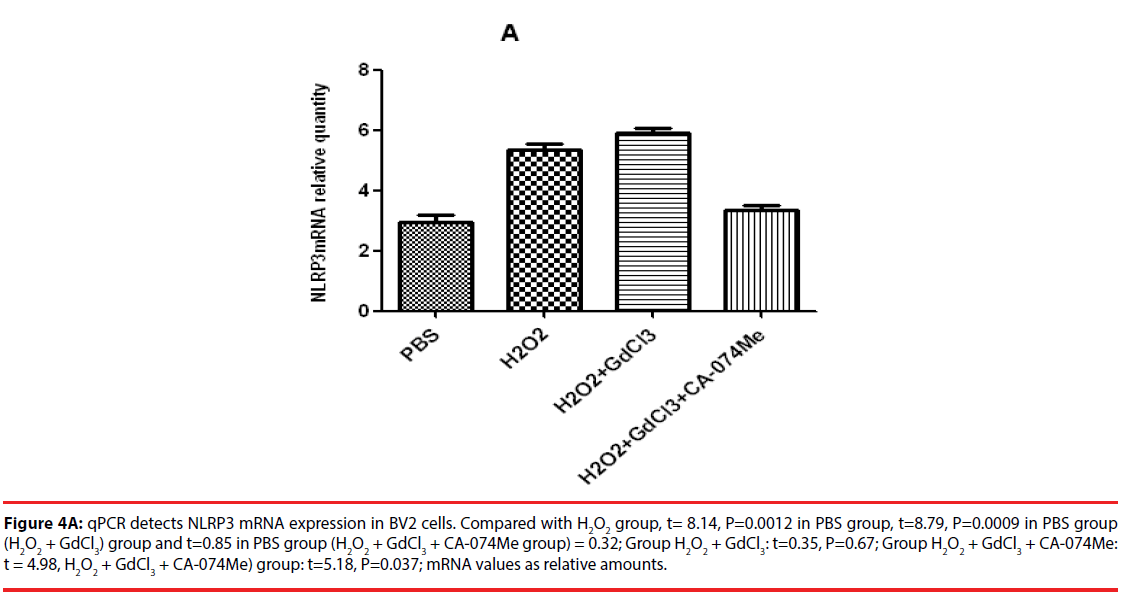
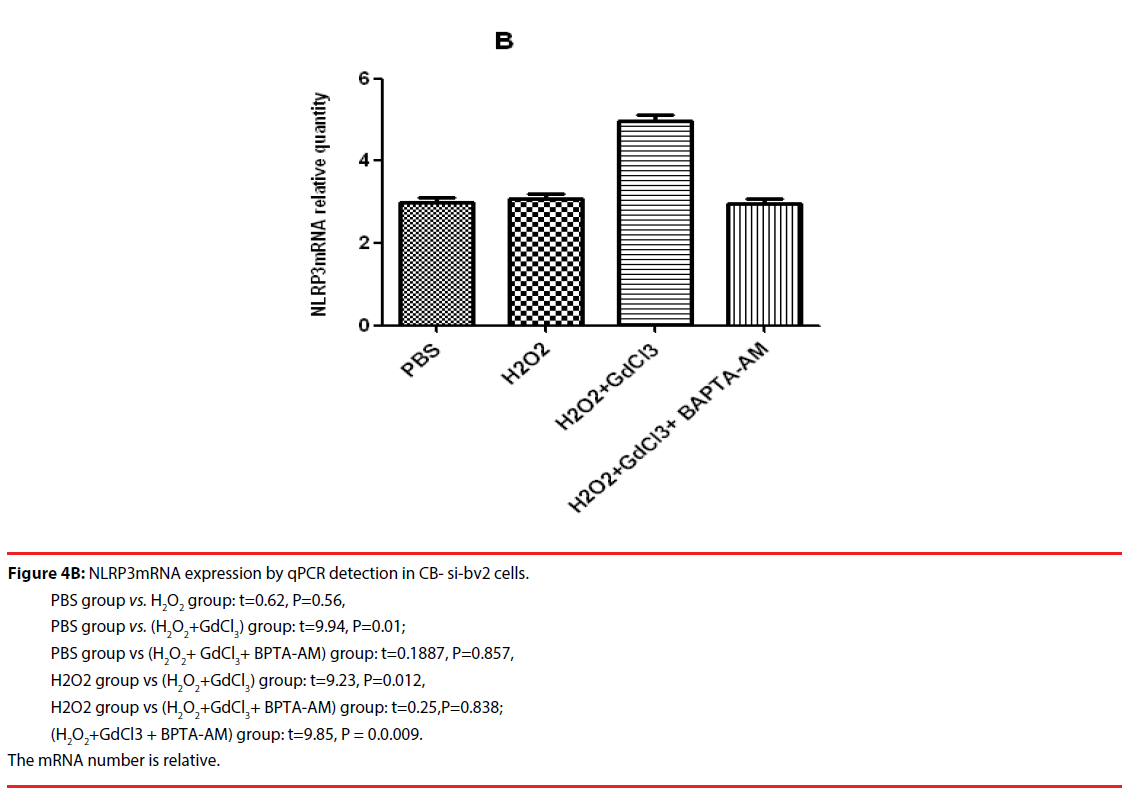
The results of qPCR showed that the relative contents of NLRP3mRNA in PBS, H2O2, (H2O2 + GdCl3) and (H2O2 + GdCl3 + CA-074Me) groups were 3.24 ± 0.45, 5.45 ± 0.78 and 5.96 ± 0.81, 3.19 ± 0.38, respectively. Compared with H2O2 group or (H2O2 + GdCl3) group, the relative content of NLRP3 mRNA in PBS group was significantly different (t = 8.14, P = 0.0012. t = 8.79, P = 0.0009). Comparison between H2O2 group and (H2O2 + GdCl3+ CA-074Me) group, or comparison between (H2O2 + GdCl3) group (H2O2 + GdCl3+ CA-074Me) group, the difference was statistically significant. The remaining group’s comparison each other, the difference was not statistically significant (Figure 4A). The qPCR results of CB-si-BV2 cells showed that the relative content of NLRP3 mRNA in PBS, H2O2, (H2O2 + GdCl3) and (H2O2 + GdCl3 + BAPTA-AM) groups were 3.36 ± 0.48, 3.65 ± 0.55, 5.29 ± 0.63, 3.46 ± 0.34. There was no significant difference in the relative content of NLRP3 mRNA between PBS group and H2O2 group or (H2O2 + GdCl3 + BAPTA-AM) group. The relative content of NLRP3 mRNA in PBS group was significantly lower than that in (H2O2 + GdCl3) group (t= 9.94, P = 0.01). In addition, comparison between H2O2 group and (H2O2 + GdCl3) group (t=9.23, P=0.012), (H2O2 + GdCl3) group and (t=9.85, P=0.0.009) were statistically significant. There was no significant difference between H2O2 group and (H2O2 + GdCl3 + BAPTA-AM) group (t = 0.25, P = 0.838) (Figure 4B).
Figure 4A: qPCR detects NLRP3 mRNA expression in BV2 cells. Compared with H2O2 group, t= 8.14, P=0.0012 in PBS group, t=8.79, P=0.0009 in PBS group (H2O2 + GdCl3) group and t=0.85 in PBS group (H2O2 + GdCl3 + CA-074Me group) = 0.32; Group H2O2 + GdCl3: t=0.35, P=0.67; Group H2O2 + GdCl3 + CA-074Me: t = 4.98, H2O2 + GdCl3 + CA-074Me) group: t=5.18, P=0.037; mRNA values as relative amounts.
Figure 4B: NLRP3mRNA expression by qPCR detection in CB- si-bv2 cells.
PBS group vs. H2O2 group: t=0.62, P=0.56,
PBS group vs. (H2O2+GdCl3) group: t=9.94, P=0.01;
PBS group vs (H2O2+ GdCl3+ BPTA-AM) group: t=0.1887, P=0.857,
H2O2 group vs (H2O2+GdCl3) group: t=9.23, P=0.012,
H2O2 group vs (H2O2+GdCl3+ BPTA-AM) group: t=0.25,P=0.838;
(H2O2+GdCl3 + BPTA-AM) group: t=9.85, P = 0.0.009.
The mRNA number is relative.
▪Changes of Caspase-1 and IL-1β in BV2 cells and transfected cells
The level of Caspase-1 in BV2 cells treated with H2O2 and calcium ion receptor agonist was significantly higher than that in control group (treated with PBS only), which was found by ELISA Statistical significance (P <0.05). There was no significant difference in Caspase-1 among other groups. (H2O2 + GdCl3) group compared with the normal group (t = 4.70, P <0.01); (H2O2 + GdCl3 + CA-074Me) group and (H2O2 + GdCl3) (H2O2 + GdCl3 + CA-074Me) group compared with the normal group, the difference was not statistically significant (P <0.05); H2O2 alone treatment group compared with the normal group was no significant difference Significance (P> 0.05). In addition, the expression of caspase-1 protein in CB-si-BV2 cells was detected by ELISA and found that (H2O2 + GdCl3) group increased significantly compared with the normal group, the other groups showed no significant difference compared with the normal group; CB-si-BV2 cells IL-1βprotein analysis, (H2O2 + GdCl3) group than in the normal group was significantly increased (t = 3.99, P<0.05); other groups compared with the control group, no significant difference (Table 1).
| Group | n | Caspase-1(pmol/L) | IL-1β(pg/ml) |
|---|---|---|---|
| PBS(control) | 5 | 35.7±14.5 | 216.5±48.5 |
| H2O2 | 5 | 292.9±68.2 | |
| H2O2 + GdCl3 | 5 | 86.3±26.2* | 445.2±97.3** |
| H2O2+GdCl3+CA- | 5 | 92.5±46.6* | |
| 074Me | 39.4±16.7 |
Table 1: Comparing for Caspase-1 and IL-1β in BV2 cell groups from four groups by ELISA(͞x ±SD).
▪ Cell growth activity by MTT assay
Four groups of CB-si-BV2 cells with different treatment were used to analyze cell viability. Cells in each group were subjected to the above treatment and then transformed into 1640 medium for 5 days. Cell growth and cell viability were observed daily, and cells were indirectly cultured by MTT method Count and compare (Figure 4). The results showed that (H2O2 + GdCl3) group grew slowest, H2O2 group grew slowly, and PBS group grew relatively fast (Figure 4).
▪The apoptosis analysis of CB-si-BV2 cells in each treatment group’
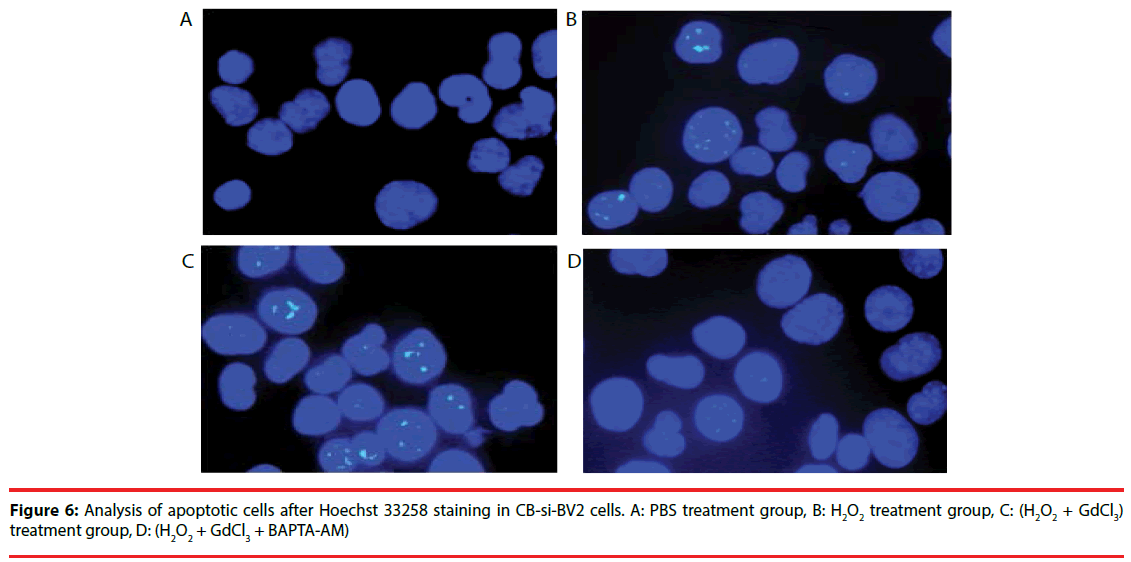
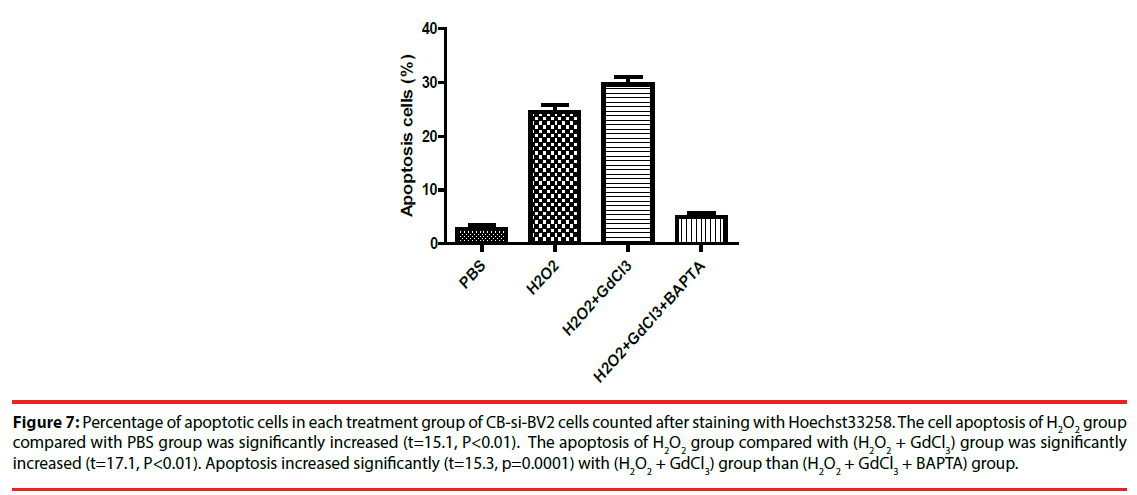
Four groups of CB-si-BV2 cells were selected for Hoechst 33258 staining and analyzed under a fluorescence microscope. The results were seen in Figures 5 and 6. The results showed that the cell apoptosis rates in PBS group, H2O2 group, (H2O2 + GdCl3) group and (H2O2 + GdCl3 + BAPTA-AM) group were 4.3%, 25.6%, 39.1% and 5.8%, respectively. The apoptosis rates of H2O2 group or (H2O2 + GdCl3) compared with ones of the PBS group appeared higher by histogram. (H2O2 + GdCl3 + BAPTA-AM) group compared with the PBS group, it showed no significant difference in the proportion of apoptosis (Figure 7).
Figure 5: The comparison of the cell growth curves in different treated CB-si-BV2 cells by MTT.
Figure 6: Analysis of apoptotic cells after Hoechst 33258 staining in CB-si-BV2 cells. A: PBS treatment group, B: H2O2 treatment group, C: (H2O2 + GdCl3) treatment group, D: (H2O2 + GdCl3 + BAPTA-AM)
Figure 7: Percentage of apoptotic cells in each treatment group of CB-si-BV2 cells counted after staining with Hoechst33258. The cell apoptosis of H2O2 group compared with PBS group was significantly increased (t=15.1, P<0.01). The apoptosis of H2O2 group compared with (H2O2 + GdCl3) group was significantly increased (t=17.1, P<0.01). Apoptosis increased significantly (t=15.3, p=0.0001) with (H2O2 + GdCl3) group than (H2O2 + GdCl3 + BAPTA) group.
▪ The intracellular calcium ion concentration analysis for each treatment group
In BV2 cells, the concentration of intracellular calcium in H2O2-treated group was significantly higher than that in control group (t = 2.566, P<0.05). The intracellular calcium concentration in H2O2 + GdCl3 group was significantly higher than that in control group (t = 2.715, P <0.05). There was no significant difference between the two groups (t = 0.532, P> 0.05) in intracellular calcium concentration of (H2O2 + GdCl3 + BAPTA-AM) In CB-si-BV2 cells, the intracellular calcium concentration of (H2O2 + GdCl3) treatment group was significantly higher than that of control group (t = 3.138, P <0.05). There was no significant difference between the one of other two groups and the control group Table 2 and 3. This laser scanning confocal microscope detected intracellular calcium ion concentrations are relative.
| Group | n | Caspase-1(pmol/L) | IL-1β(pg/ml) |
|---|---|---|---|
| PBS(control) | 5 | 32.4±13.6 | 223.4±55.4 |
| H2O2 | 5 | 36.4±18.7 | 281.7±56.5 |
| H2O2 + GdCl3 | 5 | 71.5±28.9* | 372.1±62.3* |
| H2O2+GdCl3+BAPT-AM | 5 | 28.6±12.5 | 242.5±68.8 |
Table 2: Comparing for Caspase-1 and IL-1β in CB-si-BV2 cell from 4 groups by ELISA(͞x ±SD).
| Group | n | BV2 cells | CB-si-BV2 cells |
|---|---|---|---|
| PBS(control) | 5 | 25.1±4.5 | 24.5±3.6 |
| H2O2 | 5 | 33.8±6.1* | 28.9±4.4 |
| H2O2 + GdCl3 | 5 | 34.5±6.3* | 34.2±5.9* |
| 074Me | 5 | 26.7±5.0 | -- |
| H2O2+GdCl3+BAPTA- | |||
| AM |
Table 3: Comparing for Calcium concentration in BV2 and CB-si-BV2 cells from four groups(͞x ±SD).
Discussion
In this study, we found that the expression of NLRP3, NLRP3 mRNA, Caspase-1 and IL- 1β were significantly increased after treatment with hydrogen peroxide and adding with GdCl3. In addition, NLRP3mRNA and Caspase-1 increased in CB-si-BV2 cells. After treated with calcium ion chelating agent, NLRP3, NLRP3mRNA and Caspase-1 were significantly reduced. We also found that there was more apoptosis of CB-si-BV2 cells in H2O2 group and (H2O2+GdCl3) group. NRLP3 is an important pattern recognition receptor in human innate immunity. NLPR3 is assembled with the downstream adapter protein Apoptosis-related speckle (ASC) and the effector protein Caspase-1 to form NLPR3 inflammasome, which serves as the core protein NLPR3 of inflammasome. The cytoplasm plays a role as a sensor of stress response to endogenous dangerous signals and exogenous microorganisms [11,12].
It is generally considered that the initiating factors of NRLP3 inflammasome activation are various pathological crystals (such as urate crystals, silica crystals, calcium pyrophosphate crystals, cholesterol crystals, etc.) and related viruses (such as encephalitis virus and respiratory syncytial virus etc.). The other mechanisms involved in the activation of the NRLP3 inflammasome are mitochondrial damage, reactive oxygen species activation, potassium efflux, lysosomal rupture, calcium signaling and other factors [13]. Some scholars have found that β-amyloid protein (Aβ) can activate the microglial NLRP3 inflammasome by causing glial inflammation in the brain and causing degeneration and death of neurons, resulting in AD [14]. In addition, Researchers found that cathepsin B promotes the binding of NRLP-3 to ASC and Caspase-1 through its binding to the Leucine-rich repeat domain (LRR) on NRLP3 to degrade the inhibitory protein of NRLP3 and to activate the apoptotic pathway [15]. In this experiment we used CatB as a starting point to explore a new pathway of NRLP3 inflammasome activation. Microglia, as the major immune cells that make up the Neuro-microenvironment, may have dual efficacy in the early to mid-stage of AD pathogenesis, and on the one hand they are often activated and attracted to the surrounding senile plaques that have formed in an attempt to phagocytize A [beta] to suppress AD progression, on the other hand, they may also secrete some inflammatory cytokines and promote the Neuro inflammatory reaction and progression of AD. The BV2 cells used in this experiment are mouse-derived, immortalized microglia, and the experimental study of oxidative stress in this cell may play a role in the activation of NLRP3 inflammasome during AD onset similar [16]. The results of NLRP3 protein expression in BV2 cells by immuno blotting showed that the expression level of NLRP3 protein in H2O2 group increased by about 70% compared with PBS group (P<0.01). The NLRP3 protein experiment in (H2O2 + GdCl3) group was increased about 80% compared with PBS group, and the difference was statistically significant (P<0.05). Compared with normal control group, NLRP3 protein increased by about 12% in (H2O2+GdCl3+ CA-074Me) group. The difference was not statistically significant (P>0.05). First of all, it was considered the need to use hydrogen peroxide to induce the oxidative stress model of BV2 cells for above processing group, and then considering whether the calcium sensitive receptor agonist, gadolinium chloride, can enhance this oxidative stress response. Lastly, we need observe whether the above oxidative stress response can be partially retarded by using the cathepsin B inhibitor CA-074Me. Gadolinium trichloride has been reported as a calcium-sensitive receptor agonist or as an inhibitor of Kupffer cells [17]. The experimental results and the expected results are basically more consistent. Regarding the expression of NLRP3 mRNA, we used real-time quantitative PCR method to detect. The results showed that in H2O2 group or (H2O2 + GdCl3) group in BV2 cells were significantly increased compared with PBS control group, which was consistent with the result of NLRP3 protein detection. Lee et al. [18] found that calciumsensitive receptor agonists promote the activation of NLRP3 inflammasome through calcium signaling and cyclic adenosine monophosphate mediated activation. Cathepsin B inhibits human SHSY5Y cell growth and induces apoptosis through the JAK2 / STAT3 and MAPK signaling pathways [19]. In this experiment, the CatB gene silencing cell line CB-si-BV2 was established in microglial BV2, which specifically inhibits the expression of CatB by targeting CatB gene. While treated with H2O2, GdCl3 and BAPTA-AM alone, simultaneously or sequentially, CB-si-BV2 cells treated with (H2O2 + GdCl3) got the slowest growth rate. Among them, the calcium overload may also play a certain role as GdCl3 is a calciumsensitive. These results suggest that CatB can affect the growth of BV2 cells to a certain extent. At the same time, the change of calcium concentration in BV2 cells and CB-si-BV2 cells were examined by laser scanning confocal microscopy and found that there was a higher calcium concentration in both types of cells with (H2O2+GdCl3) treatment group. The intracellular calcium ion concentration was also higher in BV2 cells with H2O2 treatment group. The results showed that CatB may play a role in the activation of NLRP3 inflammasome through calcium signaling. The important role of NLRP3 inflammasome activation in AD pathogenesis has been supported by more evidence. Some scholars have found that NLRP3 is activated in AD patients due to the high expression of caspase-1 gene and contributes to APP / PS -1 transgene in the brain, and contributes to the clearance of Aβ by reducing the activity of caspase-1 and IL-1β in the brain [20]. In this experiment, we hope to further explore whether cathepsin B has the function of regulating the activation of NLRP3 inflammasome, so as to provide new ideas for further exploring the pathogenesis of AD. Then we performed a study of the down-regulation of cathepsin B and its effects on downstream signaling and cell function. First, we obtained the complete sequence of human cathepsin B gene from Gene Bank and designed a target sequence that can specifically silence cathepsin B gene compared with the genome database. The protein was analyzed by Western blot and compared with the negative control; BV2 transfected cells have significantly silenced cathepsin B gene function. Next step, this new CP-si-BV2 cells were also divided into four groups and were treated, and then NLRP3 protein and mRNA were detected by Western blot and real-time quantitative PCR in the four groups, respectively. But BAPTAAM instead of cathepsin B inhibitor CA-074Me was used in the fourth group. The results showed that both NLRP3 protein and mRNA expression were significant increase in (H2O2 + GdCl3) group than those of other groups (P <0.05). It is suggested that the down-regulation of CatB gene can inhibit the activation of NLRP3 inflammasome in the oxidative stress model of BV2 transfected cells that make CatB gene relatively silenced. Strong calcium ion signal only partially inhibited the activation of NLRP3 inflammasome, and when the calcium signal was completely controlled, the CatB gene induced Activation of the NLRP3 inflammasome can also be more completely inhibited. BAPTA-AM, a cell-permeant chelator and used to control the level of intracellular calcium ions, can induce delayed necrosis in the mouse cortical medium through lipoxygenase-mediated free radical. In HEK 293 cells, BAPTA-AM showed an open channel blocking effect on hERG, hKv1.3 and hKv1.5 channels [21]. CatB can produce N-truncated pGlu-Aβ, which has been shown to be the most neurotoxic peptide in various forms of Aβ peptide. Hook et al. [22] found that the CatB inhibitor E64d can reduce the production of pGlu-Aβ and other related Aβ peptides, and E64d and CatB knockout can lead to improvement of memory impairment in AD mouse models [22]. After detecting blood samples from AD patients Johan et al. [23] found that CatB levels in blood were significantly increased, compared with healthy controls, which suggesting that CatB might be a marker for the diagnosis of AD. These results support the above conclusion that CatB induces the onset of AD. However, Wang et al. [24] reported that CatB was able to degrade the beta amyloid precursor protein Aβ42 derived from the familial AD wild-type gene mutation in a transgenic AD mouse model and showed the potential to treat AD. This difference of above results may be due to the use of different concentrations of CatB or Ca2 + signals involved in the different conduction. We note that there were many experimental results that support CatB was ability to induce certain tumor formation and promote tumor metastasis. Some scholars also found that CatB has a neuroprotective effect in the study of neurodegenerative diseases. These experimental results seem to contradict this experiment. We think that CatB induced neuroinflammatory changes in nature is an immune inflammatory response and appropriate immune response may have Neuro protective effects. If the immune response over, it will induce or aggravate the occurrence of AD. As the activation of NLRP3 inflammasome is not only the high expression of NLRP3, but also the activation or high expression of some downstream signaling molecules [25]. In the next experiment, so we detected the changes of caspase-1 and IL-1β protein in BV2 cells and CP-si-BV2 cells by ELISA. The results showed that in BV2 cells, H2O2 group or (H2O2 + GdCl3) group Caspase- 1 protein in BV2 cells was significantly higher than that in control group. The expression of IL-1β protein in (H2O2 + GdCl3) group was significantly higher than that in control group, while the level of IL-1β protein in H2O2 group was not significantly higher than that in control group , which suggesting that the activation of some downstream molecules in different cell lines may be incomplete or the activation time lags behind. The results of CB-si-BV2 assay showed that the expressions of caspase-1 and IL-1β in (H2O2 + GdCl3) group were significantly increased compared with those in control group. After treatment with calcium ion complexing agent, caspase-1 and IL- 1β protein expression were no longer increased. It is suggested that Calcium ions cannot be activated by CatB signaling pathways and it is possible to activate NLRP3 inflammatory cells through other pathways with the oxidative stress model of transfection cells in the down-regulated expression of CatB gene. Calcium overload causes the mitochondrial inner membrane to form a permeability transition pore (MPTP), and the increased membrane permeability can cause mitochondrial swelling, ATP depletion, and apoptosis [26]. Rossol et al. [27] suggested that extracellular calcium can also activate NLRP3 through the G-protein coupled receptor (GPCR) signaling pathway apart from calcium can bind to the calcium-sensitive receptor (CASR) to activate the NLRP3 inflammasome. Further analysis of the cell growth and apoptosis in CB-si-BV2 cells treated with different agent supports that cathepsin B mediates the activation of NLRP3 inflammasome by calcium signaling. However, the calcium ion signal itself may activate NLRP3 inflammasome by activation signals in other pathways. Then, Hoechst33258 staining was used in this experiment and there were more cell apoptosis found in (H2O2+GdCl3) group and H2O2 group. However, the inhibition of CatB gene to BV2 cell growth was gradually occurring and the inhibitory effect on cell growth is significantly reduced when the calcium complex is treated. Some scholars have confirmed that the conduction of calcium ion signal regulates the activation of NLRP3 inflammasome [28] in the upstream, starting from the beginning to the assembly of the complex. The calcium ion sensitivity receptor plays an important role in the activation of NLRP3 inflammasome by the mediation of intracellular calcium ion and cyclic adenosine [29]. Based on the results of this experiment, we conclude that CatB gene can regulate the growth and apoptosis of BV2 cells through the signaling pathway of NLRP3 inflammasome under certain conditions. The activation of NLRP3 inflammasomes plays an important role in the development and progression of many chronic nonspecific inflammatory diseases including AD, diabetes, obesity, arteriosclerosis, multiple myeloma and other diseases [30]. This study specifically mentions the effect of activation of the NLRP3 inflammasome on the pathogenesis of AD, not only because the enhancement of calcium signaling has had a positive effect on the activation of the NLRP3 inflammasome, but there is more evidence that Aβ can induces activation of the NLRP3 inflammasome, whereas activation of the NLRP3 inflammasome enhances the progression of AD through a detrimental chronic tissue inflammatory response [31-33]. In addition, Bruchard et al suggested [34] that CatB activates NLRP3 inflammasome by degrading the inhibitory protein of NLRP3, recruiting ASC and pro- Caspase proteins. Recently, Tseng et al. [35] found that lysosomal calcium signaling regulates high glucose-mediated interleukin-1β secretion in human monocytes through the transcription factor EB (TFEB), which involves calcineurin/TFEB pathway and its target genes, CatB, cathepsin D and LAMP-1, to mediate lysosomal exocytosis. Yang et al. [36] suggested that neurotransmitter dopa inhibits the activation of the NLRP3 inflammasome by acting on the dopamine D1 receptor, making it possible to control the systemic inflammatory response. This experiment selected and focused CatB studies, and confirmed that it is likely to be as an upstream signal of NLRP3 inflammasome activation which still needs calcium ion signal mediation to a large extent. In conclusion, the study for the activation of NLRP3 inflammasome has important medical and biological significance on the pathogenesis of AD. CatB can affect glial cell growth and induce cell apoptosis. CatB may mediate the activation of NLRP3 in microglia through calcium signaling pathway and promote AD pathogenesis to a large extent.
Competing Interests
The authors declare no competing interests.
Acknowledgements
This work was supported by grants from Department of Science and Technology in Guizhou Province in China, Project Number: Basic [2016]1131 of Qian-Ke-He (H.B) and grant from Department of Health and Family Planning Commission [ Project Number: 2015-326] in Guizhou province in China (H.B) , and Fund from Less Developed Regions of the National Natural Science Foundation of China (No.81560482, QF. Z).
References
- Matěj R, Rohan Z, Holada K et al. The contribution of proteinase-activated receptors to intracellular signaling, Trans cellular transport and autophagy in Alzheimer’s disease. Curr. Alzheimer. Res 12 (1), 2-12. (2015).
- Choi AJ, Ryter SW. Inflammasomes: molecular regulation and implications for metabolic and cognitive diseases. Mol. Cells 37 (1), 441-448. (2014)
- Lv C, WangL, LiuX, et al. Geniposide attenuates oligomeric Aβ(1-42)- induced inflammatory response by targeting RAGE-dependent signaling in BV2 cells. Current. Alzheimer. Research 11(5), 430-440 (2014).
- Murakami T, Ockinger J, Yu J, et al. Critical role for calcium mobilization in activation of the NLRP3 inflammasome[J]. Proc. Natl. Acad. Sci. USA 109(28), 11282-11287 (2012)
- Heneka MT, O’Banion MK. Inflammatory processes in Alzheimer’s disease [J]. J. Neuro. Immunol 184 (1) 69-91 (2007).
- Gan L, Ye S, Chu A, et al. Identification of cathepsin B as a mediator of neuronal death induced by Abeta-activated microglial cells using a functional genomics approach. J. of. Boil. Chem 279 (7), 5565-5572 (2004).
- Gregory Hoo, Jin Yu, Thomas Toneff, et al. Brain pyro glutamate amyloid-β is produced by cathepsin B and is reduced by the cysteine protease inhibitor E64d, representing a potential Alzheimer's disease therapeutic. J. Alzheimer's. Dis41(1):129-149 (2014).
- Liu A, Gao X, Zhang Q, et al. Cathepsin B inhibition attenuates cardiac dysfunction and remodeling following myocardial infarction by inhibiting the NLRP3 pathway. Mol. Med. Rep 8(2), 361-366 (2013).
- Schroder K and Tschopp J. The inflammasomes [J] Cell 140 (6), 821-832 2010.
- Bai H, Zhao X, Zhang Q, et al. Ca2 + -enhanced oxidative stress in neuroblastoma cells induced by NLRP3 inflammasome [J]. Chinese. J. Behavioral. Med. Cerebral. Sci 25 (3), 210-214 (2016).
- Krauthausen M, Kummer MP, Zimmermann J, et al. CXCR3 promotes plaque formation and behavioral deficits in an Alzheimer’s disease model [J]. J. Clin. Invest 125 (1), 365-378 (2015)
- Khan S, Ghouse HP, Fatima-Shad K. Role of NLRP3 inflammasome in Alzheimer’s disease [J]. Austin J. Clin. Neuro 2(3), 1029-1035 (2015).
- Wen H, Ting JP O’Neill LA. A role for the NLRP3 inflammasome in metabolic diseases - did Warburg miss inflammation? [J] Nat. Immunol 13: (1), 352-357 (2012).
- Halle A. The NALP3 inflammasome is involved in the innate immune responseto amyloid-beta [J]. Nat. Immunol 9 (8), 857-865 (2008).
- Bryan NB. Activation of inflammasomes requires intracellular redistribution of the apoptotic apeck-like protein containing a capase recruitment domain [J]. J. Immunol 182 (5), 3173-3182 (2009).
- Mizushina Y,Shirasuna K,Usui F, et al. NLRP3 protein deficiency exacerbates hyperoxia -induced lethality through Stat3 protein signaling independent of interleukin-1β. J. Biol. Chem 290(8), 5065-5077 (2015)
- Kartamihardja AA, Nakajima T, Kameo S, et al. Impact of Impaired Renal Function on Gadolinium Retention After dministration of Gadolinium-Based Contrast Agents in a Mouse Model. Invest. Radiol 51(10), 655-660 (2016).
- Lee GS, Subramanian N, Kim A I, et al. The calcium-sensing receptor regulates the NLRP3 inflammasome through Ca2+ and Camp [J]. Nature 492 (7427), 123-127 (2012)
- Zhang Q, Liu Y, Liu W, et al. Cucurbitacin B inhibits growth and induces apoptosis through the JAK2/STAT3 and MAPK pathways in SH-SY5Y human neuroblastoma cells [J]. Mol. Med. Rep 10: 89-94. (2014).
- Heneka MT, Kummer MP, Stutz A, et al. NLRP3 is activated in Alzheimer's disease and contributes to pathology in APP/PS1 mice[J]. Nature 493(7434), 674-678 (2013).
- Rcom-H'cheo-Gauthier A, Goodwin J, et al Interactions between calcium and alpha-synuclein in Neuro degeneration. Bio. Mol 4 (3), 795-811 (2014).
- Hook G, Yu J, Toneff T, et al. Brain pyro glutamate amyloid-β is produced by cathepsin B and is reduced by the cysteine protease inhibitor E64d, representing a potential Alzheimer's disease therapeutic. J. Alzheimer's. Dis41(1), 129-149 (2014).
- Johan S, Oskar S, Maria H, et al. Higher cathepain B levels in plasma in Alzheimer’s disease compared to healthy controls. J. Alzheimer's. Dis 22(4), 1223-1230 (2010).
- Wang C, Sun B, Zhou Y, et al. Cathepsin B degrades amyloid-β in mice expressing wild-type human amyloid precursor protein. J. Bio. chem 287(47), 39834-39841 (2012).
- Di Lisa F, Carpi A, Giorgio V, et al. The mitochondrial permeability transition pore and cyclophilin D in cardio protection [J]. Biochem. Biophys. Acta, 1813(7), 1316-1322. (2011)
- Hornung V, Bauernfeind F, Halle A, et al. Silica crystals and aluminum salts activate the NALP3 inflammasome through phagosomal destabilization. Nature. Immunol 9 (8), 847-856 (2008).
- HookG, HookVYH, Kindy M. Cysteine protease inhibitors reduce brain beta-amyloid and beta-secretase activity in vivo and are potential Alzheimer's disease therapeutics. Biol. Chem 388(9), 979-983 (2007).
- Kindy MS, Yu J, Zhu H, et al. Deletion of the cathepsin B gene improves memory deficits in a transgenic Alzheier's disease mouse model expressing AβPP containing the wild-type β-secretase site sequence.J. Alzheimer's. Dis 29 (4), 827-840 (2012).
- Cui, Lv C, Wang L, LiuX, et al. Geniposide attenuates oligomeric Aβ(1-42)- induced inflammatory response by targeting RAGE-dependent signaling in BV2 cells. Cur. Alzheimer. Res 11(5), 430-440 (2014)
- Yasser A, AldhamenYA, David PW, et al. Autoimmune disease-associated variants of extracellular endoplasmic reticulum amino peptidase 1 induces altered innate immune responses by human immune cells.J. Innate. Immun 7(3), 275-289 (2015).
- Rossol M, Pierer M, Raulien N, et al. Extracellular Ca is a danger signal activating the NLRP3 inflammasome through G protein-coupled calcium sensing receptors [J]. Nat. Commun 3 (1), 2339 (2012).
- Chen G, Wu D, Wu P, et al. Fluoxetine insensitive mice depression and interleukin-1β expression in the brain of the correlation [J] . Chinese. J. Behavioral. Med. Cerebral. Sci 24 (5), 385-388 (2015).
- Zhou R, Yazdi AS, Menu P, et al. A role for mitochondria in NLRP3 inflamma-ome activation [J]. Nature 469 (7329), 221-225 (2011).
- Bruchard M, Mignot G, Derangere V, et al. Chemotherapy triggered cathepsin B release in myeloid-derived suppressor cells activates the Nlrp3 inflammasome and promotes tumor growth. Nat. Med 19 (1), 57-64 (2013).
- Tseng HHL, Vong CT, Kwan YW, et al. Lysosomal Ca2+ Signaling Regulates High Glucose-Mediated Interleukin-1β Secretion via Transcription Factor EB in Human Monocytic Cells. Front. Immunol 8 (1), 1161 (2017)
- Yan Y, Jiang W, Liu L, et al. Dopamine controls systemic inflammation through inhibition of NLRP3 Inflammasome. Cell 160 (1-2), 63-72 (2015)

