Review Article - Interventional Cardiology (2014) Volume 6, Issue 1
Cost-effectiveness assessment of cardiac interventions: determining a socially acceptable cost threshold
- Corresponding Author:
- William S Weintraub
Cardiology Section, Christiana Care Health System/Thomas Jefferson University
4755 Ogletown-Stanton Road, Newark, DE 19718, USA
E-mail: wweintraub@christianacare.org
Abstract
In the current environment of astronomically rising healthcare costs, it has become imperative to seek the value of any new medical intervention especially where there is already standard treatment available. Cost–effectiveness analysis (CEA) offers tools that assist decision-makers in reviewing the relative value of health interventions. It involves evaluating competing therapies with the aim of informing medical and policy decisions. However, the limitations of CEA have led to some criticism.
Keywords
clinical trials, cost–effectiveness, percutaneous coronary intervention, prevention, transcatheter valve therapy
In the current environment of astronomically rising healthcare costs, it has become imperative to seek the value of any new medical intervention especially where there is already standard treatment available. Cost–effectiveness analysis (CEA) offers tools that assist decision-makers in reviewing the relative value of health interventions. It involves evaluating competing therapies with the aim of informing medical and policy decisions. However, the limitations of CEA have led to some criticism. Critics of CEA state that it perpetuates the concept that there is a fixed value for all clinical interventions irrespective of medical disciplines and characteristics of patient populations [1]. A threshold sum of US$50,000 per quality-adjusted life-year has been widely cited in the USA as a threshold above which interventions may not be considered cost effective [2]. However, this has been arbitrarily based on CEA studies from renal dialysis [3], where willingness to pay (WTP) was agreed upon before the CEA studies were published. Critics of CEA further argue that potentially life-saving interventions may be perceived as being without economic merit if their costs are above US$50,000 or any other threshold, giving rise to concern that ‘death panels’ could make therapeutic decisions, with far-reaching consequences on choice of healthcare services made available to patients [1].
Conversely, CEA proponents emphasize that these methods should only act as a guide or, better still, used to provide insight into the value of a particular intervention, and not as a means to deny access to certain healthcare services with the goal of reducing healthcare expenditures [2]. In addition, proponents argue that if society is not aware of how much value a particular intervention offers, then it would lose information towards responsible appropriation and utilization of increasingly scarce healthcare resources [4]. Given the diversity of opinions, the aim of this review is to highlight how the CEA, a key method employed in health economic analytics, is used to assess the relative value of health interventions to the society with respect to the costs. Its unique ability to display cost–effectiveness ratios at different thresholds thereby making for a better informed decision will be discussed. Cost–effectiveness analyses of certain studies in interventional and preventive cardiology will be discussed for illustrative purposes.
The fundamental metric in cost–effectiveness research is the incremental cost–effectiveness ratio (ICER). When additional costs and incremental measures (and their individual distributions) of effectiveness of a new form of therapy as well as the previous standard are available, an ICER as well as its distribution can be measured [5]. The ICER is the ratio of the incremental cost of the new therapy compared with the standard divided by the incremental measure of benefit. It can be measured in cost per life-year or quality-adjusted life-year gained if the measure of benefit is expressed in life-years or quality-adjusted life-years respectively. The ICER should not be evaluated only as a single point-estimate number because of the uncertainty of both the measures of cost and effectiveness. Thus, determining the uncertainty surrounding cost–effectiveness requires the investigation of the joint distribution of the costs and effects [6]. Indeed, examining the distribution of the ICER is more informative than the point estimate. When patient level data are available, the distribution of the ICER can be estimated by using bootstrap methods to evaluate error based on chance (stochastic error). The Bayesian probabilistic sensitivity modeling (or alternative approaches) can also be employed to evaluate additional potential error in the underlying assumptions. These types of analyses permit simulation of incremental cost and effect pairs from which a scatter plot is created in the cost–effectiveness plane [7].
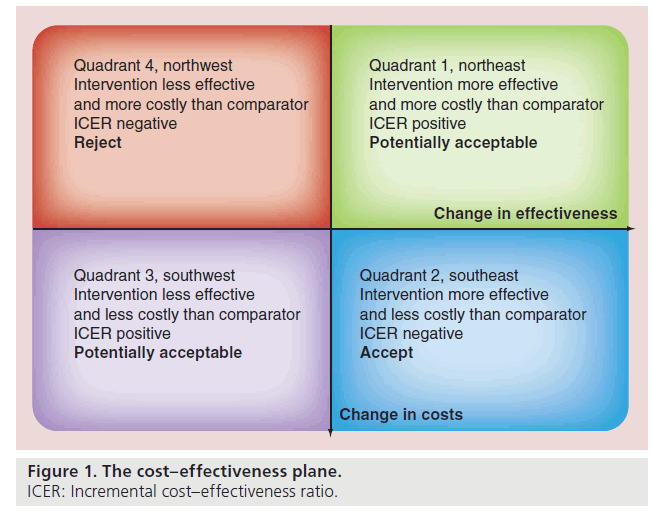
The cost–effectiveness plane is a graphical way of presenting cost–effectiveness results, with the difference in costs on the vertical axis and the difference in health benefits on the horizontal axis (Figure 1). The differences between cost and effectiveness can be plotted on the plane, providing a scattergram of distribution of the ICER. Since incremental costs and health benefits can both be either positive or negative, there are four possible combinations, which are reflected in the four quadrants of the cost–effectiveness plane. When the ICER falls in quadrant 2 (southeast) where a certain intervention has more benefits and lower costs than its comparator otherwise called ‘dominant’, it represents the ideal situation. In the ‘dominated’ (quadrant 4: northwest) where a certain intervention has less benefits and higher costs, the appropriate decision is to reject the intervention in favor of its comparator. Decision- making becomes more complex in quadrant 3 (southwest) where an intervention has fewer benefits as well as lower costs than its comparator. It may be important to consider adopting the intervention where there are scarce economic resources with a finite budget, though the ethical nature of the decision may hinder its implementation.
Most frequently encountered is quadrant 1 (northeast) where the intervention yields more benefits but also incurs higher costs. The economic merit of the intervention then depends, primarily on whether the ICER is lower than the threshold cost society or policy-makers are prepared to pay for an increase in health benefit. In health economics, quadrant 1 and quadrant 3 are sometimes treated similarly due to the complexity of decision-making involved in both scenarios. Unlike in dominant or dominated therapies where decision making is straightforward, the ICER in quadrant 1 applies to situations where there are potential opportunity costs for adopting a more expensive, albeit more effective intervention. Herein lies the dilemma.
The complementary approach to visualizing CEA results is a cost–effectiveness acceptability curve,which displays a range of willingness-topay thresholds on the x-axis and probability that the new therapy has an ICER below the threshold on the y-axis [8]. This curve is a different way of displaying the same data illustrated by the different quadrants discussed above. In quadrant 1 of the CE plane, when the entire scattergram of the distribution is contained within the quadrant, as the threshold value of the ICER is varied from low to high, the probability of the ICER being below that threshold increases [9]. A key advantage of this approach is that the probability that an intervention is cost effective when compared with an alternative will be displayed for a range of maximum cost the decision-maker will be willing to pay to gain a certain benefit, for example, 1 year of life. Therefore, this information de-emphasizes the potential limitation of the arbitrary threshold of US$50,000 in decision-making, thereby offering a greater understanding of value and costs of the intervention in question.
Cost–effectiveness analysis may be performed as simulations or alongside clinical trials using patient level data. A distinct advantage of CEA alongside clinical trials is that it preserves randomization and the use of patient level data, permitting consideration of stochastic error with fewer assumptions than pure modeling exercises. The time horizon in a cost–effectiveness study alongside a clinical trial may consider in-trial data, but may also include modeling beyond the trial period. Using a lifetime time horizon permits fuller consideration of effectiveness and costs than in-trial data permit, albeit with additional assumptions, which may also be subject to sensitivity analysis.
If CEA was perfectly informed, then presumably a societal threshold can be used to pay for those things that are below the threshold. However, CEA always involves multiple assumptions concerning both costs and efficacy. In addition, there is the ‘rule of rescue’, which highlights the ethical inclination to use scarce resources to care for patients with acutely life threatening problems as opposed to programs for prevention. Both the uncertainty in the data and the rule of rescue limit the applicability of CEA to prevention, where there may be long term therapies with upfront costs, but with benefit years in the future. Nevertheless, CEA can be used to make the underlying assumptions concerning therapeutic effectiveness and costs more apparent and thus help inform policy decisions in the public sphere. Thus, CEA can inform without setting a threshold.
Furthermore, it should be noted that cost of health services can be different between countries and this difference may affect the results of the cost analyses. Different costs have been reported in USA and Europe for percutaneous coronary intervention (PCI) [10]. There are different determinants of costs in different geographical areas [11] or even clinical practice models which may include financial incentives, availability of resources versus demand, institutional policies, and variations in cost of devices amongst others. Therein lies the need for putting all these variables into account when cost-analysis of a certain intervention is being conducted. Moreover, it is imperative to note that cost analysis conclusions also vary according to the subsets of population. An intervention is likely to be more cost effective in a sicker group of patients than a healthier subgroup. Hence, it is important not to consider patients as a single homogenous population. Finally, aforementioned economic consequences of medical decisions, especially with regards to new technologies, have become forefront considerations in recent years. This applies to all aspects of medicine and is especially important in the field of interventional cardiovascular medicine where innovation and exponential growth within the last 10–15 years is arguably unparalleled by most other fields in medicine. PCI is the poster child of escalating healthcare costs as well as potential improvement in clinical outcomes with these phenomenal advances in cardiovascular medicine. Consequently, this highly technical subspecialty will serve as an illustration of the economic assessment of the value of new technology to the health of the society as a whole.
COURAGE: PCI versus optimal medical therapy
• CE Plane: Quadrants 1 & 4
The COURAGE trial compared PCI in addition to intensive pharmacologic and lifestyle intervention with optimal medical therapy (OMT) alone as an initial strategy in reducing the risk of cardiovascular events in patients with stable ischemic heart disease [12]. After 4.6 years, there was no difference in the primary endpoint of death or myocardial infarction, although PCI improved quality of life.
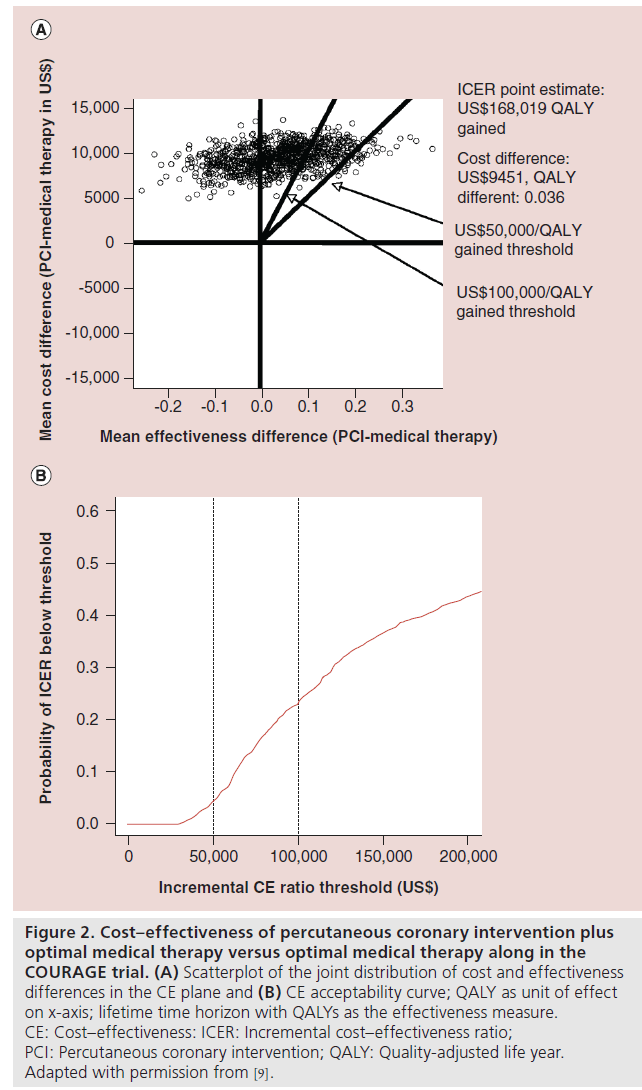
In the CEA of this trial, the point estimate for the in-trial ICER for PCI was US$206,229 per quality-adjusted life year (QALY) gained [9]. The frequency with which medical therapy dominated PCI and the absence of domination by PCI indicated considerable probability that medical therapy alone provided better clinical outcome at lower cost (Figure 2A). A cost–effectiveness acceptability curve (Figure 2B) shows that the bootstrapderived cost–effectiveness estimates were rarely <US$50,000 per QALY gained, and a minority were <US$100,000 per QALY gained. With an in-trial point estimate ICER for PCI approximately US$200,000 per QALY gained and the life time projected ICER for PCI of more than US$160,000 per QALY gained with considerable uncertainty in both cases (in-trial and lifetime projected estimates), including the possibility that OMT alone is actually a dominant strategy, it would seem unlikely society will be willing to pay that high price for PCI as an initial therapy in stable ischemic heart disease.
Figure 2: Cost–effectiveness of percutaneous coronary intervention plus optimal medical therapy versus optimal medical therapy along in the COURAGE trial. (A) Scatterplot of the joint distribution of cost and effectiveness differences in the CE plane and (B) CE acceptability curve; QALY as unit of effect on x-axis; lifetime time horizon with QALYs as the effectiveness measure. CE: Cost–effectiveness: ICER: Incremental cost–effectiveness ratio; PCI: Percutaneous coronary intervention; QALY: Quality-adjusted life year. Adapted with permission from [9].
One of the important benefits in COURAGE was seen in the improvement of quality of life among patients with PCI. The ICER for PCI was calculated as the difference in costs divided by the difference in proportion of patients with clinically significant improvement in angina severity. There was significantly greater improvement in angina for PCI patients in severe and moderate angina, but not in patients with mild angina. For one additional patient to reach significant clinical improvement in health status, ICERs ranged from US$80,000 up to US$330,000 for the severe and moderate, and from US$520,000 to more than US$3 million for patients with mild angina. Thus, the incremental cost of PCI to provide meaningful clinical benefit above that achieved by OMT alone was lower for patients with severe angina than in those with mild or no angina.
In conclusion, the results from COURAGE demonstrate that compared with OMT alone, PCI as an initial strategy did not provide significant benefit in life years, even with much higher cost. However PCI can improve quality of life and relieve angina severity, but with extremely high cost, which may be beyond a socially acceptable WTP level for many patients.
PARTNER (A & B) trial: transcatheter aortic valve replacement
The PARTNER trial was a randomized trial comparing transcatheter aortic valve replacement (TAVR) with standard-of-care therapies in high-risk patients with aortic stenosis. Patients were randomized within either the high surgical risk or inoperable cohorts. In the highrisk cohort, patients were first assigned to either transfemoral (TF-TAVR) or transapical (TATAVR) categories and were then randomized to either TAVR or surgical aortic valve replacement (AVR). Overall, 34% of the screened patients were randomized in the PARTNER trial.
1-year mortality outcomes from PARTNER demonstrated that TAVR was superior to standard therapy in patients who could not undergo surgery [13] and was noninferior to surgical AVR in high-risk patients who could undergo surgery [14]. The economic analyses of both studies, as discussed below, illustrate the wide range of distributions of ICER for the same therapy in different patient populations and consequently the influence of the study findings on the societal WTP threshold [15,16].
• PARTNER B: TAVR versus medical therapy
CE Plane: Quadrant 1
The PARTNER trial B randomized 358 patients with severe aortic stenosis who were considered inoperable to standard medical (n = 179) therapy and TAVR (n = 179). After 1 year of follow-up, it was found that there was a significant reduction in all-cause mortality, repeat hospitalization and cardiac symptoms in the TAVR group, although a higher incidence of major strokes and other vascular events were also reported. To fully evaluate the value of this intervention and assess how much the society is willing to pay for an increment in effectiveness of this therapy in this elderly cohort, a health economic analysis of this procedure was subsequently performed [15].
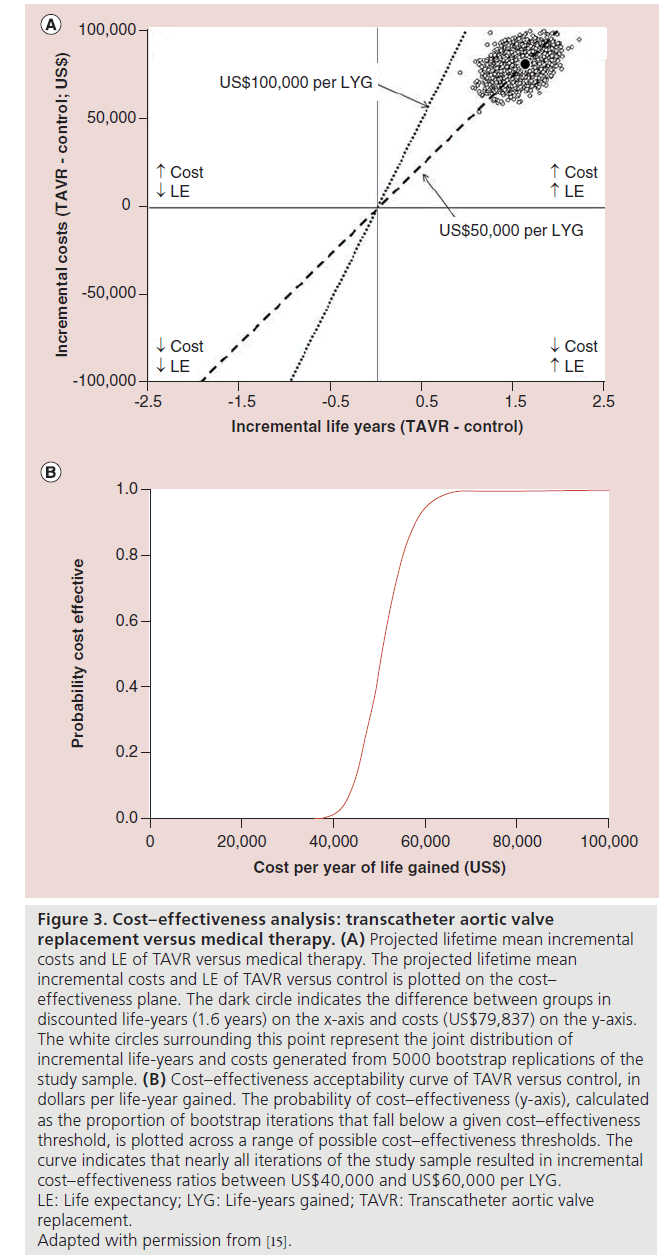
Based on the first 12 months of follow-up and trial-based survival and cost projections, a lifetime ICER of US$50,212 per life-year gained was estimated. Bootstrap simulation demonstrated that the ICER was fairly stable, with 95% of replicates <US$60,000 per life-year gained and 100% <US$100,000 per life-year gained.
Mean utility scores in this population remained lower than ideal, even after successful TAVR. Consequently, the gain in quality-adjusted survival was smaller than the gain in absolute survival, and the cost-utility analysis resulted in an ICER of US$61,889 per QALY gained. Sensitivity analyses did not meaningfully impact the results. In conclusion, for patients with severe aortic stenosis who are not candidates for surgery, TAVR increases life expectancy at an incremental cost per life-year gained reasonably close to the traditional WTP threshold in the USA of $50,000/QALY gained (Figure 3).
Figure 3: Cost–effectiveness analysis: transcatheter aortic valve
replacement versus medical therapy. (A) Projected lifetime mean incremental
costs and LE of TAVR versus medical therapy. The projected lifetime mean
incremental costs and LE of TAVR versus control is plotted on the cost–
effectiveness plane. The dark circle indicates the difference between groups in
discounted life-years (1.6 years) on the x-axis and costs (US$79,837) on the y-axis.
The white circles surrounding this point represent the joint distribution of
incremental life-years and costs generated from 5000 bootstrap replications of the
study sample. (B) Cost–effectiveness acceptability curve of TAVR versus control, in
dollars per life-year gained. The probability of cost–effectiveness (y-axis), calculated
as the proportion of bootstrap iterations that fall below a given cost–effectiveness
threshold, is plotted across a range of possible cost–effectiveness thresholds. The
curve indicates that nearly all iterations of the study sample resulted in incremental
cost–effectiveness ratios between US$40,000 and US$60,000 per LYG.
LE: Life expectancy; LYG: Life-years gained; TAVR: Transcatheter aortic valve
replacement.
Adapted with permission from [15].
• PARTNER A: TAVR versus surgical AVR
CE plane: quadrant 1 & 2 (TF-TAVR); quadrant 4 (TA-TAVR)
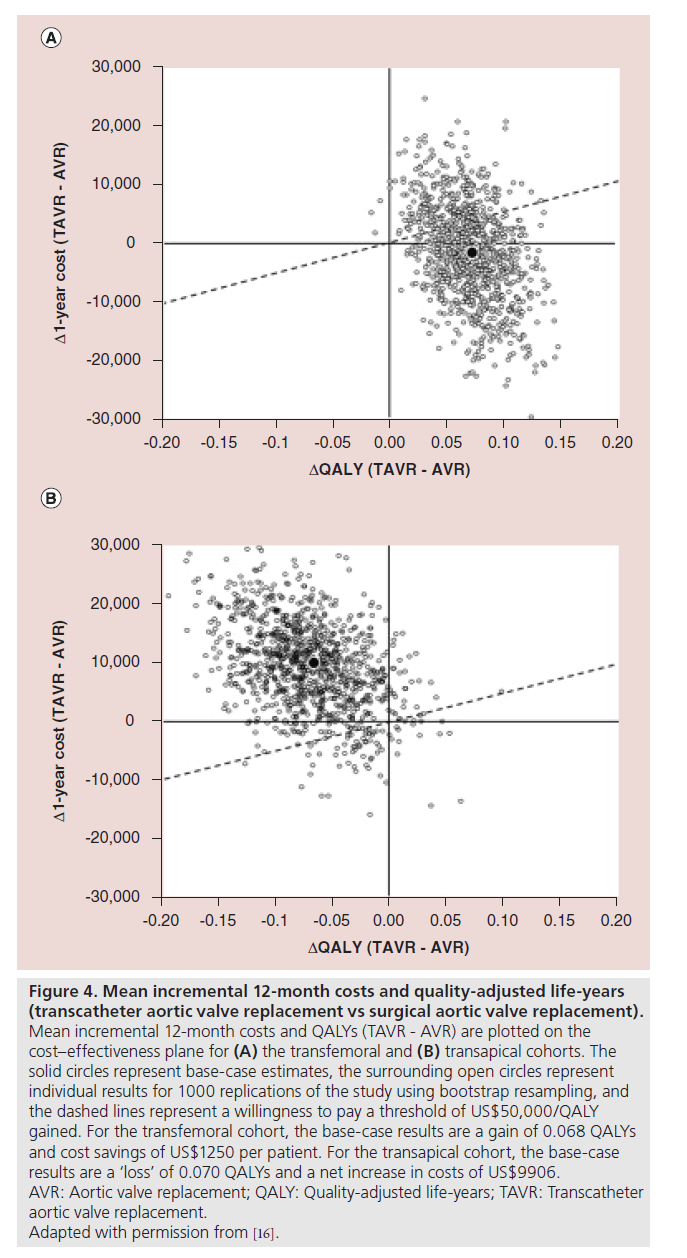
All 699 patients with severe aortic stenosis and cardiac symptoms who were eligible for conventional surgical aortic-valve repair but judged to be high operative risk were randomly assigned to undergo either TAVR or surgical AVR [14]. After 1‑year of follow-up, the TAVR group was similar to the surgical AVR group with respect to rates of death from any cause. However, while TAVR did result in significant early health-related quality of life benefit, this was not only diminished after 6–12 months but was associated with only the TF-TAVR placement and not with TA-TAVR [17]. Consequently, TAVR resulted in slightly higher 12‑month costs and a small gain in QALYs with a resulting ICER of US$76,877/QALY gained. This result was thought to be highly uncertain, because TAVR was found to be dominant in only 34.5% of bootstrap replicates and either dominated or economically unattractive (ICER US$100,000/QALY) in 48.5%. Furthermore, the CE results differed substantially according to access site. Among patients who underwent TF-TAVR, cost savings of US$1250 per patient and a modest gain in QALYs compared with surgical AVR were reported.
Bootstrap simulation demonstrated that TF-TAVR was economically dominant compared with surgical AVR in 55.7% of replicates and economically attractive at an ICER of US$50,000/QALY gained in 70.9% ( Figure 4A). On the other hand, among patients who underwent TA-TAVR, higher 12‑month costs and lower quality-adjusted life expectancy than surgical AVR were reported and the procedure was economically dominated by surgical AVR in 86.6% of bootstrap replicates (Figure 4B). At an ICER threshold of US$50,000/QALY, TATAVR was economically attractive relative to surgical AVR in just 7.1% of replicates.
Figure 4: Mean incremental 12‑month costs and quality-adjusted life-years
(transcatheter aortic valve replacement vs surgical aortic valve replacement).
Mean incremental 12‑month costs and QALYs (TAVR - AVR) are plotted on the
cost–effectiveness plane for (A) the transfemoral and (B) transapical cohorts. The
solid circles represent base-case estimates, the surrounding open circles represent
individual results for 1000 replications of the study using bootstrap resampling, and
the dashed lines represent a willingness to pay a threshold of US$50,000/QALY
gained. For the transfemoral cohort, the base-case results are a gain of 0.068 QALYs
and cost savings of US$1250 per patient. For the transapical cohort, the base-case
results are a ‘loss’ of 0.070 QALYs and a net increase in costs of US$9906.
AVR: Aortic valve replacement; QALY: Quality-adjusted life-years; TAVR: Transcatheter
aortic valve replacement.
Adapted with permission from [16].
Procedural costs for both TF-TAVR and TATAVR were greater than surgical AVR, primarily due to difference in costs of the valves of the two different procedures. However, length of stay was shorter in the TF-TAVR and the associated cost savings as well as higher quality of life in the TF-TAVR arm compensated for the more expensive percutaneous valves. These advantages were not apparent in the TA-TAVR group. In conclusion, in the PARTNER A trial, when TAVR was compared with surgical AVR, distinctively different results were obtained with CEA by access site with TF-TAVR as a dominant therapy and TA-TAVR as a dominated therapy.
PCI-CURE: clopidogrel versus placebo
• CE Plane: quadrant 1 with a low ICER
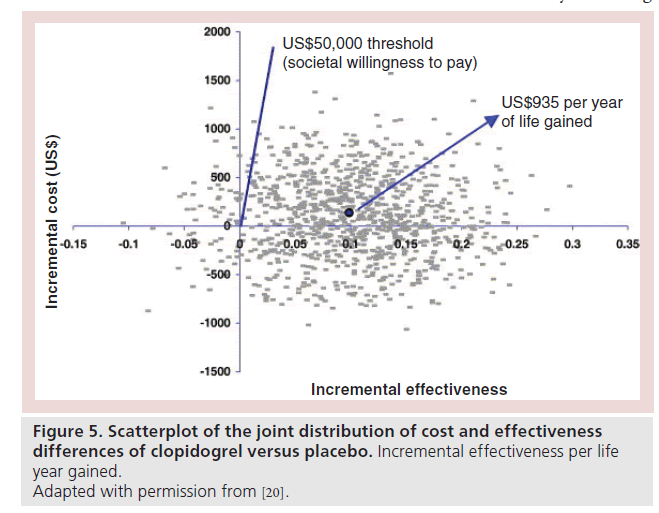
The PCI-CURE study was a pre-specified analysis of efficacy of clopidogrel in patients undergoing PCI during the course of the CURE trial where >12,000 patients with acute coronary syndrome already on aspirin were randomized to pre-treatment with loading dose of clopidogrel or placebo [18,19]. The primary clinical outcome, the composite of cardiovascular death, MI, or urgent target-vessel revascularization within 30 days of PCI was significantly lower for clopidogrel (4.5 vs 6.4%; p = 0.03). From PCI to the end of follow-up, there was a 25% relative reduction in the composite outcome or MI or cardiovascular death in the clopidogrel group. The aim of the subsequent economic analysis of the PCI-CURE study was to evaluate the cost–effectiveness of the pretreatment with clopidogrel in this patient population who were already receiving aspirin therapy with those who had no pretreatment with clopidogrel [20].
The incremental cost per life year gained with clopidogrel for the overall population ranged from US$2856 to US$4775. Treatment with clopidogrel was a dominant strategy for the early PCI subgroup. In addition, there was a life expectancy benefit with cost savings as the estimated incremental cost per life year gained with clopidogrel was US$935. In the plots of the joint distribution of cost and effectiveness differences derived from bootstrap resampling, 94% of the overall population and 92.4% of the early PCI subgroup lie below a societal WTP of US$50,000 per year of life gained (Figure 5).
Figure 5: Scatterplot of the joint distribution of cost and effectiveness
differences of clopidogrel versus placebo. Incremental effectiveness per life
year gained.
Adapted with permission from [20].
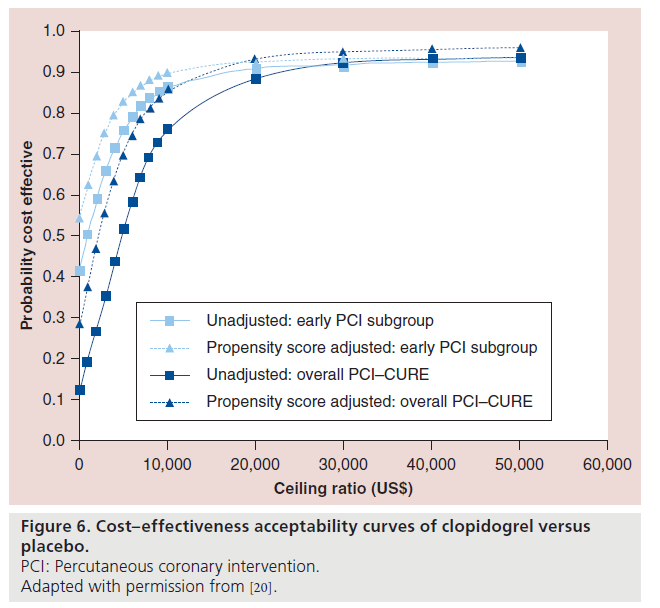
Cost–effectiveness acceptability curves are presented in Figure 6. In CURE, PCI was post-randomization, so that there may have been some treatment selection, which was adjusted for by propensity score methods. After adjusting for the propensity score, in the early PCI subgroup, there was a 90% probability of clopidogrel being cost effective at a threshold ratio of US$10,000 per life year gained. It can also be seen that the therapy with clopidogrel has a >80% probability of being cost effective at a threshold of US$10,000 per life year gained in the entire cohort as well. Overall, therapy with clopidogrel meets the societal WTP at a range of ceiling ratios.
Figure 6: Cost–effectiveness acceptability curves of clopidogrel versus
placebo.
PCI: Percutaneous coronary intervention.
Adapted with permission from [20].
The authors stated that this economic analysis did not incorporate health-related quality of life into the life expectancy gains due to lack of available data. However, when they assumed an average utility for all postacute coronary syndrome patients to be as low as 0.80, the estimated cost per quality-adjusted life year gained with clopidogrel based on Medicare costs was estimated to be US$5975. This ICER value is highly favorable when compared with the societal WTP threshold of US$50,000.
It should be noted that, as is the case with variation in costs of economic goods, changes in the cost of stents, medications and overall healthcare resource utilization over time will affect the economic analyses of any intervention. Hence, there is need to interpret these results in the light of recent or at least near-recent cost estimations and/or modest extrapolations from available data.
FAME 2 trial: fractional flow reserve-guided PCI versus best medical therapy
• CE plane: quadrant 1
The FAME 2 trial was a prospective, multicenter, randomized, controlled trial that enrolled patients with stable angina and CAD amenable to PCI with a second-generation drug-eluting stent [21]. Fractional flow reserve (FFR) was measured across all lesions that appeared angiographically significant prior to randomization. Patients with an FFR ≤0.80 across one or more lesions were randomly assigned to either PCI or to best medical therapy. A total of 888 patients were randomized. There was a significant reduction in subsequent coronary revascularization among patients who were randomized to PCI compared with best medical therapy although there was no difference in mortality.
The recently published economic analysis of this study was conducted to compare the economic and quality of life implications of the FFR-guided PCI strategy used in the FAME 2 trial [22]. Medical costs were calculated based on resource use and clinical events during the index procedure, hospitalization, and subsequent follow up. All follow-up events were assigned costs based on the Medicare reimbursement rate for the appropriate diagnosis-related group. Angina was assessed at baseline and again at one, 6 and 12 months. Quality of life was assessed using the Euro Quality of Life 5D questionnaire with US weights at baseline and one month. Because the trial was stopped early due to the rate of urgent revascularization in the medical group, which was significantly higher when compared with the FFR-directed PCI group, only 11% of patients had 12-month quality-of-life data. The quality-oflife outcome was calculated by projecting 1-month Euro Quality of Life 5D change scores.
The analysis showed that the mean 1-year cost of FFR-guided PCI was US$11,374 compared with US$8866 for medical therapy. The mean cumulative cost difference of US$5482 at baseline decreased to US$2508 at 12 months based on increasing costs for follow-up care in the medical therapy group. Quality of life at 1 month increased to 0.054 for the PCI group and 0.003 for the medical therapy group (p < 0.001). The combination of cost and quality of life changes yielded a QALY cost of US$53,000 for PCI based on in-trial results, and US$32,000 based on 3‑year projections. The conclusion of this analysis was that FFR-guided PCI significantly improved quality of life when compared with medical therapy and therefore is cost effective, especially in the long term (Figure 7).
Figure 7: Cost–effectiveness analysis:
fractional flow reserve-guided
percutaneous coronary intervention versus
best medical therapy. (A) Bootstrap
replications of the incremental cost–
effectiveness of the strategy of percutaneous
coronary intervention in the setting of an
abnormal fractional flow reserve compared
with best medical therapy. Each of the 10,000
points represents the results of one bootstrap
replication. The difference in cumulative costs is
displayed in the vertical axis, and the difference
in QALYs is displayed on the horizontal axis.
Willingness-to-pay thresholds of US$50,000 per
QALY added (solid line), US$100,000 per QALY
added (dashed line), and US$150,000 per QALY
added (dotted line) are indicated in the plane.
The fractions of replications in each sector of
the plane are indicated (e.g., 0.0023 of the
replications had a cost difference <0 and QALY
difference >0). (B) Cost–effectiveness
acceptability curve of the incremental
cost–effectiveness of the fractional flow
reserve–guided strategy compared with best
medical therapy. Based on 10,000 bootstrap
replications. The cumulative percentage of
replications (vertical axis) below various
willingness-to-pay thresholds (horizontal axis) in
dollars per QALY is shown. The points on the
curve indicate the cumulative proportion of
replications below thresholds of
US$25,000/QALY (18%), US$50,000/QALY
(80%), US$75,000/QALY (97%),
US$100,000/QALY (99.5%), US$125,000/QALY
(99.9%) and US$150,000/QALY (99.97%).
QALY: Quality-adjusted life year.
Adapted with permission from [22].
Preventive therapies in cardiovascular disease: ICERs are low but difficult to estimate
While cardiovascular disease is preventable to an extent, there has been controversy as to whether prevention offers good value. As is generally known, the clinical substrates for clinical cardiovascular disease (CVD) begin early in life and are influenced over time by potentially modifiable risk factors, behaviors and the environment. Studies have demonstrated the association of lower lifetime risk for CVD mortality and increased survival and quality of life [23]. Hence the emphasis on the need for prevention of CVD at all levels – primordial, primary and secondary. Given the significant benefits that can be derived from effective primary preventive strategies and their low costs relative to most treatment options, it becomes evident their cost–effectiveness value will almost always be below the societal WTP, at least when compared with the standard treatment options. Overall, high risk groups tend to benefit the most.
• Cholesterol screening & prevention
Full adherence to ATP III primary prevention guidelines would prevent 20,000 myocardial infarctions and 10,000 CVD deaths at a total cost US$3.6 billion or US$42,000 per QALY if low-intensity statins cost US$2.11 per pill. At a US$50,000 WTP threshold, statins are cost effective up to US$2.21 per pill [24]. Given that at present, a 30‑day supply of generic statin can cost as low as US$4, statin therapy is very cost effective even at much lower WTP thresholds [101].
• Physical activity interventions such as walking programs
ICERs ranging from US$14,000 to US$69,000 per QALY gained relative to no intervention have been estimated [25–27].
• Hypertension treatment
Medication therapy of hypertension for primary prevention of CVD has an ICER of approximately US$37,100 per life year saved and therefore meets the generally accepted societal WTP threshold [28].
•Tobacco control & prevention
The most yield is seen with excise taxes on prices of cigarettes where it has been estimated that a 40% tax will reduce smoking prevalence to 15.2% by 2025 with QALYs of up to 13 million and total cost savings of US$682 billion [29]. A comprehensive coverage of tobacco cessation programs in Medicaid programs have been demonstrated to lead to reduced hospitalizations for myocardial infarction with net savings of US$10.5 million or a US$3.07 return on investment for every US$1 spent [30].
Conclusion
The economic merit of an intervention with respect to its effectiveness is variable and depends on whether the ICER is higher or lower than the threshold value the society or policy-makers are willing to pay at that particular point in time. However, since CEA has a certain degree of uncertainty in its computation and, therefore, is not perfectly informed, the adoption of a stoic stance to pay for only the interventions that are below a certain threshold may not be appropriate. Nonetheless, critically evaluating CEA results alongside those of clinical trials or outcome studies may serve as a much-needed restraint on the present burgeoning healthcare expenditure in the USA. By accomplishing this lofty goal, CEA would have achieved a fundamental purpose – informing without setting a threshold.
Executive summary
Cost–effectiveness analysis
• Cost–effectiveness analysis
• Incremental cost–effectiveness ratio (ICER) is the fundamental metric in cost–effectiveness research and examining its distribution is more informative than the point estimate.
• Results of analyses are presented graphically in the cost effectiveness plane with four quadrants reflecting positive or negative ICERs.
• The evaluation of ICER is critical in situations where there are potential opportunity costs for adopting a more expensive albeit more effective intervention, but not as much in dominant or dominated therapies where decision-making is straightforward.
• Economic merit depends on whether the ICER is lower than the threshold cost society or policy-makers are prepared to pay (willingness to pay [WTP] threshold) for an increase in health benefit.
ICER & percutaneous cardiac interventions
• In the COURAGE trial, PCI as an initial treatment strategy for stable ischemic heart disease did not provide significant benefit in life years, even with much higher cost when compared with optimal medical therapy. However, PCI can improve quality of life and relieve angina severity, but with extremely high cost which may be beyond a socially acceptable WTP level for many patients.
• In the PARTNER B trial, in patients with severe aortic stenosis who were not candidates for surgery, transcatheter aortic valve replacement (TAVR) increased life expectancy at an incremental cost per life-year gained reasonably close to the WTP threshold when compared with standard therapy.
• In the PARTNER A trial, when TAVR was compared with surgical AVR, distinctively different results were obtained with cost–effectiveness analysis by access site with transfemoral-TAVR as a dominant therapy and transapical-TAVR as a dominated therapy.
• In the PCI-CURE trial, when compared with placebo, treatment with clopidogrel was a dominant strategy for the early PCI subgroup with life expectancy benefit with significant cost savings.
• In the FAME 2 trial, fractional flow reserve-directed PCI in patients with stable coronary artery disease was considered an economically attractive alternative to optimal medical therapy.
ICER & cardiovascular disease preventive therapies
• Significant benefits derived from effective primary preventive strategies, and their low costs relative to most treatment options led to a cost–effectiveness value which is almost always below the societal WTP threshold when compared with the standard treatment options.
• Overall, high-risk groups tend to benefit the most.
Future perspective
The methods for conducting CEA both as simulations as alongside clinical trials are well developed. The limitations of these CEA are also well understood. We are likely to see CEA alongside clinical trials frequently in the future. However, the use of CEA in helping to guide medical decision-making and public policy remains uncertain and contentious. Indeed, clinicians should be patient advocates, and cannot realistically make societal decisions concerning cost while taking the best care of their patients. This does not mean that physicians should ignore cost. Where outcomes are equivalent, as far as we know, physicians should choose the less expensive alternative. In addition, physicians can be constrained to make cost effective choices by guidelines or public policy.
Building cost–effectiveness into professional society guidelines has proven to be difficult. In the USA, while clinical effectiveness is used explicitly in determining insurance coverage, cost–effectiveness is not. In the UK, NICE does use cost–effectiveness to help guide policy recommendations to the National Health Service for coverage determinations. How to more explicitly use CEA to guide public policy in the USA will likely an issue in the coming years.
Financial & competing interests disclosure
The authors have no relevant affiliations or financial involvement with any organization or entity with a financial interest in or financial conflict with the subject matter or materials discussed in the manuscript. This includes employment, consultancies, honoraria, stock ownership or options, expert testimony, grants or patents received or pending, or royalties.
No writing assistance was utilized in the production of this manuscript.
References
Papers of special note have been highlighted as:
• of interest
•• of considerable interest
- Diamond GA, Kaul S. Cost, effectiveness, and cost–effectiveness .Circ. Cardiovasc. Qual. Outcomes 2(1), 49–54 (2009).
- Weintraub WS, Cohen DJ. The limits of cost–effectiveness analysis. Circ. Cardiovasc. Qual. Outcomes 2(1), 55–58 (2009).
- Rettig R A, Marks EL. Implementing theEnd-Stage Renal Disease Program of Medicare (Rep. R-2505-HCFA/HEW). The Rand Corporation, CA, USA (1980).
- Neumann PJ, Weinstein MC. Legislating against use of cost–effectiveness information. N. Engl. J. Med. 363(16), 1495–1497 (2010).
- Nease RF Jr. Introduction to cost– effectiveness analysis. In: Cardiovascular Health Care Economics. Weintraub WS (Ed). Humana Press, NJ, USA, 111–121 (2003).
- Fenwick E, Marshall DA, Levy AR, Nichol G. Using and interpreting cost–effectiveness acceptability curves: an example using data from a trial of management strategies for atrial fibrillation. BMC Health Serv. Res. 6, 52 (2006).
- Briggs AH, Gray AM. Handling uncertainty when performing economic evaluation of healthcare interventions. Health Technol. Assess. 3(2), 131–134 (1999).
- Löthgren M, Zethraeus N. Definition, interpretation and calculation of cost–effectiveness acceptability curves. Health Econ. 9(7), 623–630 (2000).
- Weintraub WS, Boden WE, Zhang Z et al. Cost–effectiveness of percutaneous coronary intervention in optimally treated stable coronary patients. Circ. Cardiovasc. Qual. Outcomes 1(1), 12–20 (2008).
- Durand-Zaleski I, Dupouy P, Coste Carrié DP et al. A. A tale of two countries: costs and financial incentives for provisional stenting during percutaneous coronary intervention in France and the United States. Eur. J. Health Econ. 3(4), 235–239 (2002).
- Jones WS, Patel MR, Holleran SA, Harrison JK, O’Connor CM, Phillips HR 3rd. Trends in the use of diagnostic coronary angiography, percutaneous coronary intervention, and coronary artery bypass graft surgery across North Carolina. Am. Heart J. 162(5), 932–937 (2011).
- Boden WE, O’Rourke R A, Teo KK et al. Optimal medical therapy with or without PCI for stable coronary disease. N. Engl. J. Med. 356, 1503–1516 (2007).
- Leon MB, Smith CR, Mack M et al. Transcatheter aortic-valve implantation for aortic stenosis in patients who cannot undergo surgery. N. Engl. J. Med. 363, 1597–1607 (2010).
- Smith CR, Leon MB, Mack MJ et al. Transcatheter versus surgical aortic-valve replacement in high-risk patients. N. Engl. J. Med. 364, 2187–2198 (2011).
- Reynolds MR, Magnuson EA, Wang K et al. Cost–effectiveness of transcatheter aortic valve replacement compared with standard care among inoperable patients with severe aortic stenosis: results from the placement of aortic transcatheter valves (PARTNER) trial (Cohort B). Circulation 125 (9), 1102–1109 (2012).
- Reynolds MR, Magnuson EA, Lei Y et al. Cost–effectiveness of transcatheter aortic valve replacement compared with surgical aortic valve replacement in high-risk patients with severe aortic stenosis: results of the PARTNER (Placement of Aortic Transcatheter Valves) trial (Cohort A). J. Am. Coll. Cardiol. 60(25), 2683–2692 (2012).
- Reynolds MR, Magnuson EA, Wang K et al. Health-related quality of life after transcatheter or surgical aortic valve replacement in high risk patients with severe aortic stenosis: results from the PARTNER trial (cohort A). J. Am. Coll. Cardiol. 60, 548–558 (2012).
- Mehta SR, Yusuf S, Peters RJ et al. Effects of pretreatment with clopidogrel and aspirin followed by long-term therapy in patients undergoing percutaneous coronary intervention: the PCI-CURE study. Lancet 358(9281), 527–533 (2001).
- Yusuf S, Zhao F, Mehta SR et al. Effects of clopidogrel in addition to aspirin in patients with acute coronary syndromes without ST-segment elevation. N. Engl. J. Med. 345(7), 494–502 (2001).
- Mahoney EM, Mehta S, Yuan Y et al. Long-term cost–effectiveness of early and sustained clopidogrel therapy for up to 1 year in patients undergoing percutaneous coronary intervention after presenting with acute coronary syndromes without ST-segment elevation. Am. Heart J. 151(1), 219–227 (2006).
- De Bruyne B, Pijls NH, Kalesan B, Barbato E et al. Fractional flow reserve-guided PCI versus medical therapy in stable coronary disease. N. Engl. J. Med. 367(11), 991–1001 (2012).
- Fearon WF, Shilane D, Pijls NH et al. Cost–effectiveness of percutaneous coronary intervention in patients with stable coronary artery disease and abnormal fractional flow reserve. Circulation 128(12), 1335–1440 (2013).
- Lloyd-Jones DM, Leip EP, Larson MG et al. Prediction of lifetime risk for cardiovascular disease by risk factor burden at 50 years of age. Circulation 113(6), 791–798 (2006).
- Pletcher MJ, Lazar L, Bibbins-Domingo K et al. Comparing impact and cost–effectiveness of primary prevention strategies for lipid- lowering. Ann. Intern. Med. 150, 243–254 (2009).
- Roux L, Pratt M, Tengs TO et al. Cost effectiveness of community-based physical activity interventions. Am. J. Prev. Med. 35(6), 578–588 (2008).
- Hagberg LA, Lindholm L. Cost–effectiveness of healthcare-based interventions aimed at improving physical activity. Scand. J. Public Health 34(6), 641–653 (2006).
- Graves N Cost–effectiveness of a telephone- delivered intervention for physical activity and diet. PLoS ONE 4, e7135 (2009).
- Grover S, Coupal L, Lowensteyn I et al. Preventing cardiovascular disease among Canadians: is the treatment of hypertension or dyslipidemia cost-effective? Can. J. Cardiol. 24(12), 891–898 (2008).
- Ahmad S, Franz GA. Raising taxes to reduce smoking prevalence in the US: a simulation of the anticipated health and economic impacts. Public Health 122(1), 3–10 (2008).
- Land T, Rigotti NA, Levy De et al. A longitudinal study of medicaid coverage for tobacco dependence treatments in Massachusetts and associated decreases in hospitalizations for cardiovascular disease. PLos Med. 7, 12 (2010).
• Interesting perspective on the use of cost–effectiveness analysis in health economics and decision-making.
• Resourceful article on the limitations of the methods used in cost–effectiveness analysis and alternative strategies of analyses that may yield more objective results.
•• Landmark paper on cost–effectiveness of transcatheter aortic valve replacement when compared with standard care in patients with severe aortic stenosis who were not eligible for surgery.
•• Landmark paper on cost–effectiveness of clopidogrel and aspirin when compared with only aspirin in patients undergoing percutaneous coronary intervention.
•• Landmark paper on cost–effectiveness of fractional flow reserve-directed percutaneous coronary intervention when compared with optimal medical therapy in patients with stable coronary artery disease.
Website
101. Consumer Reports. Statins: Summary of Recommendations. www.consumerreports.org/health/best-buydrugs/statins.htm (Accessed 26 June 2013)
