Research Article - Clinical Practice (2018)
C-reactive protein and hepatocellular carcinoma: analysis of its relationships to tumor factors
- Corresponding Author:
- Brian I. Carr
Izmir Biomedicine and Genome Institute, Dokuz Eylul University, Izmir, Turkey
E-mail: brianicarr@hotmail.com
Abstract
C-reactive protein (CRP) is a blood marker for inflammation and is an independent prognostic factor for many human cancers. Combined with albumin levels, it forms the basis of the Glasgow Index for cancer prognosis. We reviewed the literature on CRP and HCC and also evaluated blood CRP levels and combination CRP plus albumin levels in a large HCC cohort. In order to understand the prognostic significance of CRP, we retrospectively examined a large HCC cohort and examined the relationship of CRP levels to tumor parameters. We report, that CRP alone and CRP plus albumin combined as well, significantly correlated with parameters of HCC aggressiveness, such as maximum tumor dimension (MTD), portal vein thrombosis (PVT) and blood alpha-fetoprotein (AFP) levels, both as individual parameters and all parameters together (Aggressiveness Index). This extends current thinking, to suggest a possible explanation for the usefulness of blood CRP levels in HCC prognostication.
Keywords
C-reactive protein, HCC, aggressiveness.
Abbreviations
C-reactive protein (CRP) has long been recognized to be part of the acute phase response and to be associated with chronic inflammatory diseases [1], and is synthesized in the liver and is secreted into the plasma as a pentamer, belonging to the family of pentraxins, together with serum amyloid protein [2]. It is also considered to be a marker both of inflammation as well as of cancer [3,4]. Although it is secreted in the presence of HCC, it is not considered to be a diagnostic marker for HCC [5], but it has nevertheless been reported to have significant prognostic value [6-8]. More recently, CRP has come to be seen in the context of systemic inflammation and cancer. The Glasgow score, consisting only of the 2 parameters, CRP and albumin, has been found to be an important and independent prognosticator for several cancer types, including HCC [9-18]. Furthermore, there is evidence that CRP is produced not just by hepatocytes, but also by HCC cells [19]. However, the function, biological role and significance in determining HCC prognosis are still unclear. The reason behind the prognostic significance of CRP for HCC has not been clearly explored. This study was undertaken to examine whether there might be any relationship between blood CRP levels and indices of HCC clinical biology. We report an association between blood CRP levels and clinical indices of HCC aggressiveness, namely MTD, PVT, AFP and tumor multifocality. This forms the basis for considering in future that CRP itself might be a target for new therapies.
Methods
Patient data
We retrospectively analyzed a database of 995 prospectively-accrued HCC patients who had full baseline tumor parameter data, including CT scan information on HCC size, number of tumor nodules and presence or absence of PVT and plasma AFP levels; complete blood count; routine blood liver function tests, (total bilirubin, GGTP, ALKP, albumin, transaminases) and patient demographics. Diagnosis was made either via tumor biopsy or according to international guidelines. Inclusion criteria included patients with a known HCC diagnosis and had CRP data at baseline. Patients were excluded who did not have CRP data. Database management conformed to legislation on privacy and this study conforms to the ethical guidelines of the Declaration of Helsinki and approval for this retrospective study on de-identified HCC patients was obtained by the Institutional Review Board. Survival information was not available for this analysis.
Aggressiveness Index was calculated as the sum of scores [20,21]: MTD (cm, in tertiles): MTD<4.5; 4.5 ≤ MTD ≤ 9.6; MTD>9.6; scores 1, 2, 3 respectively; AFP ng/ml (cutoff): AFP<100; 100 ≤ AFP ≤ 1000; AFP>1000; scores 1, 2, 3 respectively; PVT (No/Yes): PVT(No); PVT(Yes); scores 1, 3 respectively; Number of Tumor Nodules: Nodules ≤ 3; Nodules>3; scores 1, 3 respectively.
Statistical analysis
Mean and SD for continuous variables, and relative frequency for categorical variables, were used as indices of centrality and dispersion of the distribution. For categorical variables, the Chi-square and z test for proportions were used. The Wilcoxon rank-sum (Mann-Whitney) test was to test the difference between two categories, and the Kruskal-Wallis rank test to test the difference among categories.
Logistic regression model was to evaluate the associations between PVT (No/Yes) on single variables examined.
Final multiple linear or logistic regression models were obtained with the backward stepwise method and the variables that showed associations with p<0.10 were left in the models.
When testing the null hypothesis of no association, the probability level of α error, two tailed, was 0.05. All the statistical computations were made using STATA 12.1 Statistical Software (StataCorp) 2014, release 12 (College Station, TX).
Results
CRP in relation to HCC patient demographics, liver and tumor parameters
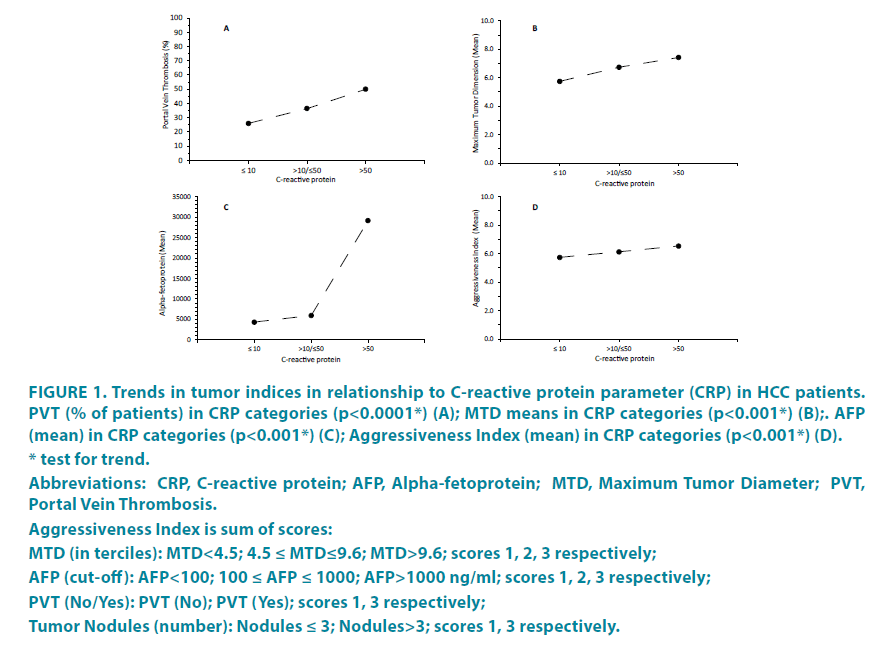
The total cohort was initially dichotomized according to normal and abnormal (>10 mg/dL) serum levels of CRP (TABLE 1). Demographic features such as age, gender, percent HBV and HCV were similar in the 2 groups. However, percent cirrhosis and alcohol consumption were significantly higher in the high CRP group, as were ALKP, AST and total bilirubin levels, but blood albumin levels were significantly lower. There were 4 tumor parameters, namely maximum tumor diameter (MTD), tumor multifocality, portal vein thrombosis (PVT) and blood alphafetoprotein (AFP) levels and they were each significantly higher in the high CRP group, except for tumor multifocality. The trends in the tumor parameters of MTD, percent PVT and alpha-fetoprotein (and their combination, expressed as a Tumor Aggressiveness Index) were then plotted as a function of blood CRP values (FIGURE 1). In each case, there was a significant relationship (for PVT, p<0.0001); for MTD and AFP, p<0.001). The high and low CRP groups were then dichotomized according to small or large (>5 cm MTD) tumor size (TABLE 2). The differences between high and low CRP groups were found to be confined mainly to the patients with larger tumors, although an increase in MTD and percent PVT and a decrease in blood albumin was found in the high CRP groups for both small and large size tumors.
| Variables * | CRP≤10 (mg/L) | CRP>10 (mg/L) | p ψ |
|---|---|---|---|
| Gender (Males) (%) | 512 (80.13) | 292 (81.79) | 0.52 ^ |
| Age (yr) | 63.12 ± 11.15 | 63.28 ± 10.75 | 0.99 |
| Cigarettes smoking (yes) (%) | 178 (47.21) | 89 (47.85) | 0.89 ^ |
| Alcohol (yes) (%) | 57 (14.39) | 56 (22.40) | 0.009 ^ |
| Cirrhosis (yes) (%) | 501 (78.65) | 311 (88.10) | <0.001 ^ |
| HbsAg(+ve) (%) | 371 (59.36) | 204 (61.82) | 0.46 ^ |
| HCV(+ve) (%) | 142 (22.68) | 65 (19.76) | 0.30 ^ |
| Hemoglobin (g/dL) | 12.42 ± 2.23 | 11.44 ± 2.16 | <0.0001 |
| Platelet counts (103/μL) | 145.42 ± 83.92 | 156.87 ± 107.62 | 0.58 |
| Albumin (g/dL) | 3.22 ± 0.75 | 2.88 ± 0.63 | <0.0001 |
| PT (%) | 14.77 ± 4.93 | 17.31 ± 6.45 | <0.0001 |
| CRP (mg/L) | 3.43 ± 2.78 | 42.74 ± 42.53 | <0.0001 |
| ALKP (U/L) | 191.88 ± 204.48 | 289.80 ± 500.30 | 0.0001 |
| GGTP (U/L) | 137.06 ± 152.11 | 175.53 ± 211.89 | 0.11 |
| AST (U/L) | 142.03 ± 587.81 | 188.41 ± 429.44 | 0.003 |
| Total Bilirubin (mg/dL) | 2.40 ± 3.75 | 5.38 ± 7.47 | 0.0004 |
| Multifocality (n ≥ 2) | 178 (31.23) | 93 (32.40) | 0.73 ^ |
| MTD (cm) | 5.74 ± 3.95 | 6.89 ± 4.53 | 0.0003 |
| Portal Vein Thrombosis (%) | 149 (26.00) | 109 (39.78) | <0.001 ^ |
| AFP (IU/mL) | 4310.48 ± 29213.30 | 12291.33 ± 64664.53 | 0.001 |
| Platelet counts <100 (103/μL) (%) | 219 (34.49) | 124 (34.93) | 0.89 ^ |
| AFP (IU/mL) (%) | 0.01 ^ | ||
| ≤20 | 296 (47.28) | 128 (37.10) | |
| >20/≤100 | 102 (16.29) | 62 (17.97) | |
| >100/≤1000 | 114 (18.21) | 71 (20.58) | |
| >1000 | 114 (18.21) | 84 (24.35) | |
| MTD (cm) (%) | <0.001 ^ | ||
| <3.5 | 176 (30.72) | 59 (21.69) | |
| ≥3.5/<6.5 | 224 (39.09) | 95 (34.93) | |
| ≥6.5 | 173 (30.19) | 118 (43.38) |
* All values: Means±Standard Deviation as continuous; Frequences and Percentage (%) as categorical.
ψ Wilcoxon rank-sum (Mann-Whitney) test; ^ Chi-square test.
Abbreviations: CRP, C-Reactive Protein; PT, Prothrombin Time; AFP, Alpha-fetoprotein; ALKP, Alkaline phosphatase; GGTP, gamma glutamyl transpeptidae; AST, Aspartate aminotransferase; ALT, Alanine transaminase; MTD, Maximum Tumor Diameter.
Table 1: HCC patient characteristics, comparing CRP (≤ 10/>10 mg/L) categories
Figure 1: Trends in tumor indices in relationship to C-reactive protein parameter (CRP) in HCC patients.
PVT (% of patients) in CRP categories (p<0.0001*) (A); MTD means in CRP categories (p<0.001*) (B);. AFP
(mean) in CRP categories (p<0.001*) (C); Aggressiveness Index (mean) in CRP categories (p<0.001*) (D).
* test for trend.
Abbreviations: CRP, C-reactive protein; AFP, Alpha-fetoprotein; MTD, Maximum Tumor Diameter; PVT,
Portal Vein Thrombosis.
Aggressiveness Index is sum of scores:
MTD (in terciles): MTD<4.5; 4.5 ≤ MTD≤9.6; MTD>9.6; scores 1, 2, 3 respectively;
AFP (cut-off): AFP<100; 100 ≤ AFP ≤ 1000; AFP>1000 ng/ml; scores 1, 2, 3 respectively;
PVT (No/Yes): PVT (No); PVT (Yes); scores 1, 3 respectively;
Tumor Nodules (number): Nodules ≤ 3; Nodules>3; scores 1, 3 respectively.
| MTD<5.0 (cm) | MTD ≥ 5.0 (cm) | |||||
|---|---|---|---|---|---|---|
| Parameter* | CRP ≤ 10 (mg/L) | CRP>10 (mg/L) | p ψ | CRP ≤ 10 (mg/L) | CRP>10 (mg/L) | p ψ |
| Platelet counts (103/μL) | 130.00 ± 70.49 | 133.56 ± 85.74 | 0.96 | 166.22 ± 95.42 | 190.55 ± 120.27 | 0.08 |
| Hemoglobin (g/dL) | 12.44 ± 2.29 | 11.51 ± 1.98 | 0.0003 | 12.46 ± 2.16 | 11.84 ± 1.90 | 0.002 |
| CRP (mg/L) | 3.02 ± 2.71 | 35.30 ± 34.05 | <0.0001 | 3.72 ± 2.80 | 39.78 ± 38.78 | <0.0001 |
| GGTP (U/L) | 120.02 ± 150.81 | 199.63 ± 372.32 | 0.51 | 161.78 ± 158.41 | 165.39 ± 156.91 | 0.81 |
| ALKP (U/L) | 162.79 ± 198.47 | 267.44 ± 284.20 | 0.26 | 226.26 ± 217.71 | 249.92 ± 174.48 | 0.09 |
| Total Bilirubin (mg/dL) | 2.13 ± 2.96 | 4.82 ± 6.30 | 0.10 | 2.49 ± 3.94 | 3.49 ± 5.03 | 0.33 |
| Albumin (g/dL) | 3.25 ± 0.76 | 2.88 ± 0.63 | <0.0001 | 3.13 ± 0.73 | 2.94 ± 0.66 | 0.005 |
| AFP (IU/mL) | 1946.10 ± 12949.39 | 3512.07 ± 17519.91 | 0.08 | 7478.00 ± 42279.77 | 12511.47 ± 44520.54 | 0.66 |
| MTD (cm) | 3.01 ± 1.05 | 3.02 ± 1.00 | 0.99 | 8.74 ± 3.78 | 9.48 ± 4.11 | 0.05 |
| Tumor Nodule | 0.57 ^ | 0.28 ^ | ||||
| % Multifocality (n≥2) | 79 (26.60) | 26 (23.85) | 93 (34.83) | 47 (29.75) | ||
| PV Thrombosis (%) | 44 (15.02) | 16 (15.69) | 0.87 ^ | 95 (35.58) | 70 (47.95) | 0.01 ^ |
| Cirrhosis (%) | 234 (78.52) | 93 (86.11) | 0.09 ^ | 216 (79.12) | 139 (86.34) | 0.06 ^ |
* All values: Means ± Standard Deviation as continuous; Frequences and Percentage (%) as categorical.
ψ Wilcoxon rank-sum (Mann-Whitney) test; ^ Chi-square test.
Abbreviations: GGTP, gamma glutamyl transpeptidase; ALKP, Alkaline phosphatase; AFP, Alpha-fetoprotein; MTD, Maximum Tumor Diameter; PVT, Portal Vein Thrombosis; CRP, C-Reactive Protein.
Table 2: Comparisons amongst HCC patients between CRP (≤10/>10 mg/L) groups in single MTD categories in the total cohort.
Tumor parameters in relation to blood CRP +/- albumin groupings
Although the Glasgow tumor inflammation index is based on <10> mg/L CRP values, we found that a more detailed tumor parameter picture was obtained using 2 CRP cutoffs, namely, <10, 10-50 and >50 mg/L blood CRP values (TABLE 3). We found as significant trend for increase in each of AFP, MTD and percent PVT parameters, with increase in CRP grouping. Actual values for AFP, MTD and percent PVT were significantly different when patients with CRP <10 mg/L were compared to patients with CRP 10-50 mg/L, as well as to patients with CRP >50 mg/L. When patients with CRP 10-50 mg/l were compared with patients with CRP >50 mg/L, only AFP and PVT were significantly different.
| C-reactive Protein (mg/L) | |||||||
|---|---|---|---|---|---|---|---|
| CRP≤10 | 10<CRP≤50 | CRP>50 | Comparisons | ||||
| Parameter* | (n=639) | (n=258) | (n=99) | p-value ψ | p-value # | ||
| (a) | (b) | (c) | (b)vs(a) | (c)vs(a) | (c)vs(b) | ||
| AFP (IU/mL) | 4310.48 ± 29213.30 | 5966.78 ± 30776.48 | 29179.23 ± 111.913.40 | 0.0003 | 0.06 | 0.0001 | 0.01 |
| MTD (cm) | 5.74 ± 3.95 | 6.73 ± 4.49 | 7.42 ± 4.69 | 0.0007 | 0.004 | 0.004 | 0.26 |
| PV Thrombosis (%) | 38 (26.00) | 75 (36.41) | 55 (50.50) | <0.001 ^ | 0.007 † | 0.0002 † | 0.05 † |
* All values: Means ± Standard Deviation as continuous; Frequences and percentage (%) as categorical.
ψ Kruskal-Wallis rank test; # Wilcoxon rank-sum (Mann-Whitney) test; ^ Chi-square test; † Test z for proportions.
Abbreviations: CRP, C-reactive Protein; AFP, Alpha-fetoprotein; MTD, Maximum Tumor Diameter; PVT, Portal Vein Thrombosis.
Table 3: Comparisons among C-reactive protein groups for tumor characteristics in HCC patients.
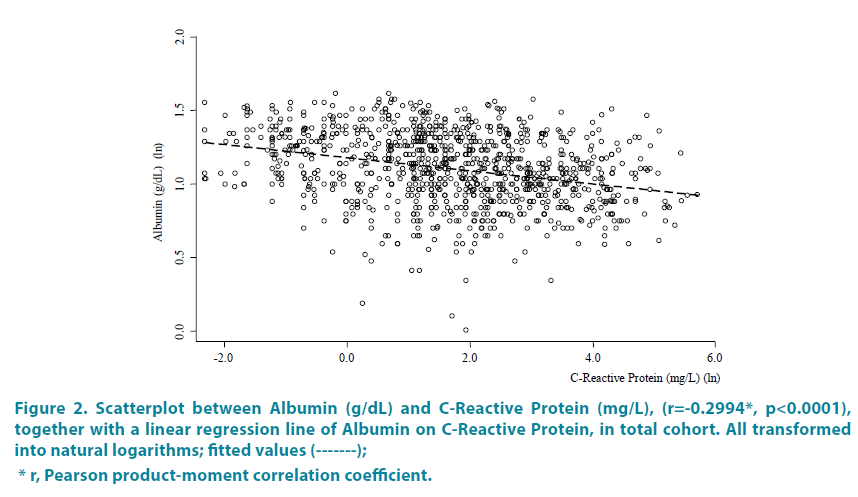
Each of the 3 CRP groups was then subdivided by addition of either high (>3.5 g/ dL) or low (<3.5 g/dL) blood Albumin values, as done in the Glasgow Index [9-16] and as shown in TABLE 4. Patients with low albumin plus highest CRP >50 had the largest MTDs of mean 7.8cm and the highest mean AFP values (group [c]). Groups [c] and [f] with highest CRP of >50 also had the highest percent of patients with PVT (48.21 and 58.33 percent, respectively). By contrast, group [d] with the combined highest albumin and lowest CRP levels, had the lowest levels of AFP, smallest MTDs and lowest prevent of patients with PVT. The significant inverse relationship of blood albumin to CRP levels is further shown in FIGURE 2, which is a Scatterplot between blood albumin and CRP levels (Pearson correlation coefficient r=-0.2994, p<0.0001).
| Albumin and CRP combined | |||||||
|---|---|---|---|---|---|---|---|
| Alb<3.5 & CRP ≤ 10 |
Alb<3.5 & 10<CRP ≤ 50 |
Alb<3.5 & CRP>50 |
Alb ≥ 3.5 & CRP ≤ 10 |
Alb ≥ 3.5 & 10<CRP ≤ 50 |
Alb ≥ 3.5 & CRP>50 |
||
| Parameter* | (n=384) | (n=203) | (n=85) | (n=255) | (n=55) | (n=14) | p-value# |
| (a) | (b) | (c) | (d) | (e) | (f) | ||
| AFP (IU/mL) | 5448.63 ± 34160.37 | 6467.01 ± 33984.76 | 32747.87 ± 120058.40 | 2651.22 ± 19806.37 | 4098.01 ± 13181.70 | 6943.83 ± 18730.11 | 0.0001 |
| MTD (cm) | 6.09 ± 4.13 | 6.66 ± 4.50 | 7.80 ± 4.92 | 5.16 ± 3.58 | 6.97 ± 4.49 | 5.71 ± 3.12 | 0.0002 |
| PV Thrombosis (%) | 100 (28.09) | 58 (36.02) | 27 (48.21) | 49 (22.69) | 17 (37.78) | 7 (58.33) | <0.001 ^ |
| (a) vs | (b) vs | (c) vs | (d) vs | (e) vs | |||||||||||
| nbsp; | (b) | (c) | (d) | (e) | (f) | (c) | (d) | (e) | (f) | (d) | (e) | (f) | (e) | (f) | (f) |
| AFP | 0.27 | 0.02 | 0.0001 | 0.03 | 0.09 | 0.12 | <0.0001 | 0.009 | 0.19 | <0.0001 | 0.002 | 0.63 | 0.90 | 0.005 | 0.01 |
| MTD | 0.22 | 0.02 | 0.003 | 0.18 | 0.98 | 0.12 | 0.0004 | 0.58 | 0.69 | 0.0002 | 0.36 | 0.25 | 0.003 | 0.44 | 0.47 |
| PV Thrombosis | 0.08f | 0.005f | 0.15f | 0.21f | 0.04f | 0.11f | 0.005f | 0.83f | 0.16f | 0.0005f | 0.29f | 0.53f | 0.05f | 0.02f | 0.21f |
* All values: Means±Standard Deviation as continuous; Frequences and percentage (%) as categorical.
# Kruskal-Wallis rank test; ^ Chi-square test; ¥ Wilcoxon rank-sum (Mann-Whitney) test; Test z for proportions.
Abbreviations: AFP, Alpha-fetoprotein; MTD, Maximum Tumor Diameter; PVT, Portal Vein Thrombosis, CRP, C-reactive protein; Alb, Albumin.
Table 4: Comparisons of tumor characteristics amongst HCC patients by Albumin (g/dL) and CRP (mg/L) combined (expanded Glasgow score).
Figure 2: Scatterplot between Albumin (g/dL) and C-Reactive Protein (mg/L), (r=-0.2994*, p<0.0001),
together with a linear regression line of Albumin on C-Reactive Protein, in total cohort. All transformed
into natural logarithms; fitted values (-------);
* r, Pearson product-moment correlation coefficient.
Logistic regression model of CRP and CRP relationship to AFP
A logistic regression model of CRP on single variables was then calculated (TABLE 5A). Significant OR values were found for several parameters, but the highest ORs were found for PVT (OR 1.88) and the Tumor Aggressiveness Index (OR 1.71) [20,21]. In a final multiple logistic regression model of CRP, only blood total bilirubin and high Tumor Aggressiveness Index score were found to be significant (TABLE 5B).
| Parameter | OR | se(OR) | p-value | 95% C.I. |
|---|---|---|---|---|
| A) | ||||
| Platelet counts (103/μL) | 1.001 | 0.0007 | 0.06 | 1.000 to 1.002 |
| Hemoglobin (g/dL) | 0.82 | 0.03 | <0.001 | 0.77 to 0.87 |
| GGTP (U/L) | 1.001 | 0.0006 | 0.04 | 1.0001 to 1.0023 |
| ALKP (U/L) | 1.001 | 0.0004 | 0.01 | 1.0002 to 1.0020 |
| Total Bilirubin (mg/dL) | 1.10 | 0.02 | <0.001 | 1.06 to 1.15 |
| Albumin (g/dL) | 0.51 | 0.05 | <0.001 | 0.42 to 0.61 |
| AFP (IU/mL) | 1.000005 | 0.000002 | 0.03 | 1.000001 to 1.000009 |
| MTD (cm) | 1.07 | 0.02 | <0.001 | 1.03 to 1.10 |
| Nodules number | 1.06 | 0.16 | 0.73 | 0.78 to 1.43 |
| PV Thrombosis (%) | ||||
| No (Ref. category) | 1 | |||
| Yes | 1.88 | 0.29 | <0.001 | 1.38 to 2.55 |
| Aggressiveness Index score | ||||
| Score = 4 (Ref. category) | 1 | |||
| 4<Score ≤ 12 | 1.71 | 0.31 | 0.003 | 1.19 to 2.44 |
| Glycemia (mg/dL) | 0.9998 | 0.0014 | 0.87 | 0.997 to 1.002 |
| HDL(mg/dL) | 0.98 | 0.005 | 0.002 | 0.97 to 0.99 |
| Triglycerides, (mg/dL) | 1.002 | 0.001 | 0.09 | 0.9997 to 1.0049 |
| Total Cholesterol (mg/dL) | 0.998 | 0.002 | 0.40 | 0.995 to 1.002 |
| LDL Cholesterol (mg/dL) | 0.9996 | 0.001 | 0.70 | 0.997 to 1.002 |
| B) | ||||
| Total Bilirubin (mg/dL) | 1.07 | 0.03 | 0.02 | 1.01 to 1.14 |
| Aggressiveness Index score | ||||
| Score = 4 (Ref. category) | 1 | |||
| 4<Score ≤ 12 | 2.76 | 1.17 | 0.02 | 1.20 to 6.32 |
Abbreviations: OR, Odds-Ratio; se(O), standard error of Odds-Ratio; CRP, C-reactive protein; HBV, Hepatitis B Virus; HCV, Hepatitis C Virus; GGTP, gamma glutamyl transpeptidae; ALKP, Alkaline phosphatase; AFP, Alpha-fetoprotein; MTD, Maximum Tumor Diameter; PVT, Portal Vein Thrombosis; HDL: High Density Lipoprotein Cholesterol; LDL: Low Density Lipoprotein Cholesterol.
Aggressiveness Index as sum of scores:
MTD (in terciles): MTD<4.5; 4.5 ≤ MTD ≤ 9.6; MTD>9.6; scores 1, 2, 3 respectively;
AFP (cut-off): AFP<100; 100 ≤ AFP ≤ 1000; AFP>1000 ng/ml; scores 1, 2, 3 respectively;
PVT (No/Yes): PVT (No); PVT (Yes); scores 1, 3 respectively;
Tumor Nodules (number): Nodules ≤ 3; Nodules>3; scores 1, 3 respectively.
Table 5: Logistic regression model of CRP (≤ 10/>10 mg/L), on single variables (A). Final multiple logistic regression model of CRP (≤ 10/>10 mg/L), with stepwise method in backward (B).
Discussion
Blood CRP levels are being used increasingly in inflammation-based indices for several cancers, including HCC, such as the Glasgow Index and several of its variations [22-24]. It is described as an ‘independent’ marker for prognosis, meaning that it is seemingly unrelated to accepted tumor-based prognostication parameters, such as tumor size (MTD), tumor number and metastasis (TNM) or the combination of tumor and liver damage classification schemes that are now considered to be important for HCC [25,26]. It is increasingly clear that non-tumor factors are also important in HCC prognosis [27-29] including tumor microenvironment [30,31]. Despite the significant association of CRPbased inflammation indices and tumor survival, the mechanisms have so far been elusive, but are thought to relate to systemic inflammation as cause or consequence of growing tumors. The current study was undertaken in this context. Although this database is from a large new Turkish multi-institution collaboration, giving it power of patient numbers, survival data is not available for this cohort and thus for this study.
Despite the weakness in this study of an absence of survival data, we have been able to discern significant associations between blood CRP levels and parameters of HCC aggressiveness, namely MTD, percent patients with PVT and blood AFP levels (TABLES 1, 3 and 4 and FIGURE 1). In addition to the Glasgow inflammation index that dichotomizes patients according to blood CRP levels or <10 or >10 mg/L, we found further refinement for subset analysis in using 3 CRP cutoffs of CRP <10, 10<CRP ≤ 50 and >50 mg/L. A logistic regression model for CRP showed several significant factors, but especially for the HCC Aggressiveness Index score in a final multiple logistic regression model of CRP (TABLE 5). We also examined the possibility that elevated CRP levels might provide a useful marker in AFP-negative HCC [22]. CRP is produced in the liver. However, although its best-documented significance is a reflection of the systemic inflammatory response [1,3], since it is also produced by HCC cells [3,4,32-34,36], it likely has additional roles. Thus, our finding of significant relationships between blood CRP levels and several parameters of tumor growth and aggressiveness, suggest that either the systemic inflammatory response may play a role in HCC biology, or that CRP may actually be involved in stimulation of HCC growth and invasion. The fact that CRP not only is produced in non-cancerous liver in response to the presence of various tumors and HCC, but is actually produced by HCCs, suggests some direct involvement in HCC biology.
Several cytokines and other factors have been shown to influence CRP production, including IL-1, IL-6 and STAT-3 [32-37]. Furthermore, as well as being a reflection of an inflammatory response, CRP has also been shown to inhibit expression of N-Cadherin and can activate human monocyte tumoricidal activity [38,39]. The pentraxin family includes CRP, and the soluble pattern recognition receptor long petraxin 3 can antagonize FGF and can inhibit FGF-dependent angiogenesis and tumor growth [40], and also can alter tumor matrix and microenvironment [41,42]. Furthermore, a new generation of IL-6 inhibitors has potential in cancer therapy, by disrupting the IL-6/CRP interactions [43-45]. Thus, several mechanisms exist to not only explain a putative role for CRP in HCC biology, but several agents such as IL-6 inhibitors are already being evaluated to directly antagonize CRP or to inhibit factors that are known to stimulate its production.
CRP is one of the best known amongst several inflammatory cytokines that are thought to be important in cancer [17,18,28]. They include both interleukins, interferons and Tumor necrosis factor-α [46-57]. More recently, the neutrophil to lymphocyte (NLR) ratio has also been shown to also be a useful reflection of the inflammatory environment and clinical HCC survival prognosticator [24,58-64]. It has recently been incorporated in various ways in modern HCC classification systems [60,63], as well as in combination with CRP [65].
Conclusion
Our results show, an association between clinical CRP levels and parameters of human HCC growth and aggressiveness. New work on control of CRP suggests the possibility that inhibitors of IL-6 and of other inflammatory mediators, working through CRP, may have potential as novel cancer therapy agents. This extends current thinking, to suggest a possible explanation for the usefulness of blood CRP levels in HCC prognostication and that CRP might also be a therapeutic target.
Disclosure statement
The authors declare no conflict of interest. All authors have read and agree with this paper.
This work is supported in part by NIH grant CA 82723 (B.I.C)
References
- Pepys MB, Baltz ML. Acute phase proteins with special reference to C-reactive protein and related proteins (pentaxins) and serum amyloid A protein. Adv. Immunol. 34, 141-212 (1983).
- Arcone R, Gualandi G, Ciliberto G. Identification of sequences responsible for acute-phase induction of human C-reactive protein. Nucleic Acids Res. 16, 3195-3207 (1988).
- Toniatti C, Arcone R, Majello B, et al. Regulation of the human C-reactive protein gene, a major marker of inflammation and cancer. Mol. Biol. Med. 7, 199-212 (1990).
- Ganter U, Arcone R, Toniatti C, Morrone G, Ciliberto G. Dual control of C-reactive protein gene expression by interleukin-1 and interleukin-6. EMBO J. 8, 3773-3779 (1989).
- Fabris C, Pirisi M, Soardo G, et al. Diagnostic usefulness of acute-phase protein measurement in hepatocellular carcinoma. Cancer Invest. 14, 103-108 (1996).
- Hashimoto K, Ikeda Y, Korenaga D, Tanoue K, Hamatake M. The impact of preoperative serum C-reactive protein on the prognosis of patients with hepatocellular carcinoma. Cancer. 103, 1856-1864 (2005).
- Sieghart W, Pinter M, Hucke F, et al. Single determination of C-reactive protein at the time of diagnosis predicts long-term outcome of patients with hepatocellular carcinoma. Hepatol. 57, 2224-2234 (2013).
- Shin JH, Kim CJ, Jeon EJ, et al. Overexpression of C-reactive Protein as a Poor Prognostic Marker of Resectable Hepatocellular Carcinomas. J. Pathol. Transl. Med. 49, 105-111 (2015).
- McMillan DC, Crozier JE, Canna K, Angerson WJ, McArdle CS. Evaluation of an inflammation-based prognostic score (mGPS) in patients undergoing resection for colon and rectal cancer. Int. J. Colorectal Dis. 22, 881-886 (2007).
- Ishizuka M, Kubota K, Kita J, et al. Impact of an inflammation-based prognostic system on patients undergoing surgery for hepatocellular carcinoma: a retrospective study of 398 Japanese patients. Am. J. Surg. 203, 101-106 (2012).
- Horino K, Beppu T, Kuroki H, et al. Glasgow Prognostic Score as a useful prognostic factor after hepatectomy for hepatocellular carcinoma. Int. J. Clin. Oncol. 18, 829-838 (2013).
- Li MX, Bi XY, Li ZY, et al. Prognostic Role of Glasgow Prognostic Score in Patients With Hepatocellular Carcinoma: A Systematic Review and Meta-Analysis. Medicine. 94(49), e2133 (2015).
- Shiba H, Horiuchi T, Sakamoto T, et al. Glasgow prognostic score predicts therapeutic outcome after hepatic resection for hepatocellular carcinoma. Oncol. Lett. 14, 293-298 (2017).
- Kinoshita A, Onoda H, Imai N, et al. Comparison of the prognostic value of inflammation-based prognostic scores in patients with hepatocellular carcinoma. Br. J. Cancer. 107, 988-993 (2012).
- Pinato DJ, Stebbing J, Ishizuka M, et al. A novel and validated prognostic index in hepatocellular carcinoma: the inflammation based index (IBI). J. Hepatol. 57, 1013-1020 (2012).
- Aino H, Sumie S, Niizeki T, et al. The systemic inflammatory response as a prognostic factor for advanced hepatocellular carcinoma with extrahepatic metastasis. Mol. Clin. Oncol. 5, 83-88 (2016).
- Chan SL, Chan AW, Chan AK, et al. Systematic evaluation of circulating inflammatory markers for hepatocellular carcinoma. Liver Int. 37, 280-289 (2017).
- Hu RH, Lee PH, Yu SC. Secretion of acute-phase proteins before and after hepatocellular carcinoma resection. J. Formos. Med. Assoc. 98, 85-91 (1999).
- Ma LN, Liu XY, Lu ZH, et al. Assessment of high-sensitivity C-reactive protein tests for the diagnosis of hepatocellular carcinoma in patients with hepatitis B-associated liver cirrhosis. Oncol. Lett. 13, 3457-3464 (2017).
- Carr BI, Guerra V, Giannini EG, Farinati F, et al. A Liver Index and its relationship to Indices of HCC Aggressiveness. J. Integr. Oncol. 5(4), 178 (2016).
- Carr BI, Guerra V. A hepatocellular Carcinoma Aggressiveness Index and its relationship to liver enzyme levels. Oncol. 90, 215-220 (2016).
- She S, Xiang Y, Yang M, et al. C-reactive protein is a biomarker of AFP-negative HBV-related hepatocellular carcinoma. Int. J. Oncol. 47, 543-554 (2015).
- Liu C, Li L, Lu WS, et al. Neutrophil-lymphocyte Ratio Plus Prognostic Nutritional Index Predicts the Outcomes of Patients with Unresectable Hepatocellular Carcinoma After Transarterial Chemoembolization. Sci. Rep. 7(1), 13873 (2017).
- Pang Q, Zhou L, Qu K, et al. Validation of inflammation-based prognostic models in patients with hepatitis B-associated hepatocellular carcinoma: a retrospective observational study. Eur. J. Gastroenterol. Hepatol. 30(1), 60-70 (2018).
- Bauschke A, Altendorf-Hofmann A, Kissler H, et al. Validity of eleven prognostic scores with respect to intra- and extrahepatic recurrence of hepatocellular carcinoma after liver transplantation. J. Cancer Res. Clin. Oncol. 143, 2595-2605 (2017).
- Farinati F, Vitale A, Spolverato G, et al. Development and Validation of a New Prognostic System for Patients with Hepatocellular Carcinoma. PLoS Med. 13(4), e1002006 (2016).
- Kobayashi T, Itamoto T, Tashiro H, Amano H, et al. Tumor-related factors do not influence the prognosis of solitary hepatocellular carcinoma after partial hepatectomy. J. Hepatobiliary Pancreat Sci. 18, 689-699 (2011).
- Chan SL, Chan AW, Chan AK, et al. Systematic evaluation of circulating inflammatory markers for hepatocellular carcinoma. Liver Int. 37, 280-289 (2017).
- Li X, Chen ZH, Ma XK, et al. Neutrophil-to-lymphocyte ratio acts as a prognostic factor for patients with advanced hepatocellular carcinoma. Tumour Biol. 35, 11057-11063 (2014).
- Wang X, Hassan W, Jabeen Q, Khan GJ, Iqbal F. Interdependent and independent multidimensional role of tumor microenvironment on hepatocellular carcinoma. Cytokine. 103, 150-159 (2018).
- Novikova MV, Khromova NV, Kopnin PB. Components of the Hepatocellular Carcinoma Microenvironment and Their Role in Tumor Progression. Biochemistry (Mosc). 82, 861-873 (2017).
- Depraetere S, Willems J, Joniau M. Stimulation of CRP secretion in HepG2 cells: cooperative effect of dexamethasone and interleukin 6. Agents Actions. 34(3-4), 369-375 (1991).
- Ganapathi MK, Rzewnicki D, Samols D, Jiang SL, Kushner I. Effect of combinations of cytokines and hormones on synthesis of serum amyloid A and C-reactive protein in Hep 3B cells. J. Immunol. 147, 1261-1265 (1991).
- Steel DM, Whitehead AS. Heterogeneous modulation of acute-phase-reactant mRNA levels by interleukin-1 beta and interleukin-6 in the human hepatoma cell line PLC/PRF/5. Biochem J. 277(Pt 2), 477-482 (1991).
- Zhang D, Sun M, Samols D, Kushner I. STAT3 participates in transcriptional activation of the C-reactive protein gene by interleukin-6. J. Biol. Chem. 271(16), 9503-9509 (1991).
- Goldman ND, Liu TY. Biosynthesis of human C-reactive protein in cultured hepatoma cells is induced by a monocyte factor(s) other than interleukin-1. J. Biol. Chem. 262, 2363-2368 (1987).
- Arcone R, Gualandi G, Ciliberto G. Identification of sequences responsible for acute-phase induction of human C-reactive protein. Nucleic Acids Res. 16, 3195-3207 (1988).
- Kudo S, Saito H, Motoyama S, et al. C-reactive protein inhibits expression of N-cadherin and ZEB-1 in murine colon adenocarcinoma. Tumour Biol. 36, 7035-7043 (2015).
- Barna BP, James K, Deodhar SD. Activation of human monocyte tumoricidal activity by C-reactive protein. Cancer Res. 47, 3959-3963 (1987).
- Leali D, Alessi P, Coltrini D, et al. Long pentraxin-3 inhibits FGF8b-dependent angiogenesis and growth of steroid hormone-regulated tumors. Mol. Cancer Ther. 10, 1600-1610 (2011).
- Ronca R, Alessi P, Coltrini D, et al. Long pentraxin-3 as an epithelial-stromal fibroblast growth factor-targeting inhibitor in prostate cancer. J. Pathol. 230, 228-238 (2013).
- Chi JY, Hsiao YW, Li CF, et al. Targeting chemotherapy-induced PTX3 in tumor stroma to prevent the progression of drug-resistant cancers. Oncotarget. 6, 23987-24001 (2015).
- Dorff TB, Goldman B, Pinski JK, et al. Clinical and correlative results of SWOG S0354: a phase II trial of CNTO328 (siltuximab), a monoclonal antibody against interleukin-6, in chemotherapy-pretreated patients with castration-resistant prostate cancer. Clin. Cancer. Res.16, 3028-3034 (2010).
- Trikha M, Corringham R, Klein B, Rossi JF. Targeted anti-interleukin-6 monoclonal antibody therapy for cancer: a review of the rationale and clinical evidence. Clin. Cancer Res.9, 4653-4665 (2003).
- Rossi JF, Lu ZY, Jourdan M, Klein B. Interleukin-6 as a therapeutic target. Clin. Cancer Res.21, 1248-1257 (2015)
- Debes JD, van Tilborg M, Groothuismink ZMA, et al. Levels of Cytokines in Serum AssociateWith Development of Hepatocellular Carcinoma in Patients With HCV InfectionTreated With Direct-acting Antivirals. Gastroenterology. 154, 515-517 (2017).
- Shao YY, Lin H, Li YS, et al. High plasma interleukin-6 levels associated with poor prognosis of patients with advanced hepatocellular carcinoma. Jpn. J. Clin. Oncol. 47, 949-953 (2017).
- Mitra A, Yan J, Xia X, et al. IL6-mediated inflammatory loop reprograms normal to epithelial-mesenchymal transition(+) metastatic cancer stem cells in preneoplastic liver of transforming growth factor beta-deficient ß2-spectrin (+/-) mice. Hepatology. 65, 1222-1236 (2017).
- Bergmann J, Müller M, Baumann N, et al. IL-6 trans-signaling is essential for the development of hepatocellular carcinoma in mice. Hepatology. 65, 89-103 (2017)
- Aroucha DC, Carmo RF, Vasconcelos LR, et al. TNF-a and IL-10 polymorphisms increase the risk to hepatocellular carcinoma in HCV infected individuals. J Med Virol. 88, 1587-1595 (2016).
- Bishayee A. The role of inflammation and liver cancer. Adv. Exp. Med. Biol. 816, 401-435 (2014).
- Kim HJ, Chung JH, Shin HP, et al. Polymorphisms of interferon gamma gene and risk of hepatocellular carcinoma in Korean patients with chronic hepatitis B viral infection. Hepatogastroenterology. 60, 2080-2084 (2013).
- Guo J, Ma Z, Ma Q, et al. 1,25(OH)2D3 inhibits hepatocellular carcinoma development through reducing secretion of inflammatory cytokines from immunocytes. Curr. Med. Chem. 20, 4131-4141 (2013).
- Ohishi W, Cologne JB, Fujiwara S, et al. Serum interleukin-6 associated with hepatocellular carcinoma risk: a nested case-control study. Int. J. Cancer. 134, 154-163 (2014).
- Park EJ, Lee JH, Yu GY, et al. Dietary and genetic obesity promote liver inflammation and tumorigenesis by enhancing IL-6 and TNF expression. Cell. 140, 197-208 2010).
- Budhu A, Wang XW. The role of cytokines in hepatocellular carcinoma. J. Leukoc. Biol. 80, 1197-1213 (2006).
- Cho HJ, Kim SS, Nam JS, et al. Higher serum interleukin-17A levels as a potential biomarker for predicting early disease progression in patients with hepatitis B virus-associated advanced hepatocellular carcinoma treated with sorafenib. Cytokine. 95, 118-125 (2017).
- Zheng J, Cai J, Li H, et al. Neutrophil to Lymphocyte Ratio and Platelet to Lymphocyte Ratio as Prognostic Predictors for Hepatocellular Carcinoma Patients with Various Treatments: a Meta-Analysis and Systematic Review. Cell. Physiol. Biochem. 44, 967-981 (2017).
- Yu Y, Song J, Zhang R, et al. Preoperative neutrophil-to-lymphocyte ratio and tumor-related factors to predict microvascular invasion in patients with hepatocellular carcinoma. Oncotarget. 8, 79722-79730 (2017).
- Liu C, Li L, Lu WS, et al. Neutrophil-lymphocyte Ratio Plus Prognostic Nutritional Index Predicts the Outcomes of Patients with Unresectable Hepatocellular Carcinoma After Transarterial Chemoembolization. Sci. Rep.7, 13873 (2017).
- Hung HC, Lee JC, Cheng CH, et al. Impact of neutrophil to lymphocyte ratio on survival for hepatocellular carcinoma after curative resection. J. Hepatobiliary Pancreat. Sci. 24, 559-869 (2017).
- Zheng J, Seier K, Gonen M, et al. Utility of Serum Inflammatory Markers for Predicting Microvascular Invasion and Survival for Patients with Hepatocellular Carcinoma. Ann. Surg. Oncol. 24, 3706-3714 (2017).
- Howell J, Pinato DJ, Ramaswami R, et al. Integration of the cancer-related inflammatory response as a stratifying biomarker of survival in hepatocellular carcinoma treated with sorafenib. Oncotarget. 8, 36161-36170 (2017).
- Taussig MD, Irene Koran ME, Mouli SK, et al. Neutrophil to lymphocyte ratio predicts disease progression following intra-arterial therapy of hepatocellular carcinoma. HPB. 19, 458-464 (2017).
- Oh BS, Jang JW, Kwon JH, et al. Prognostic value of C-reactive protein and neutrophil-to-lymphocyte ratio in patients with hepatocellular carcinoma. BMC Cancer. 13, 78 (2013).
