Review Article - Imaging in Medicine (2009) Volume 1, Issue 2
Diffusion-tensor imaging in brain tumors
Nail Bulakbaşı
Department of Radiology, Etlik 06018, Ankara, Turkey
- *Corresponding Author:
- Nail Bulakbaşı
Gülhane Military Medical Academy
School of Medicine, Department of Radiology
Etlik 06018, Ankara, Turkey and Meditom Imaging Center
Esat cad. 101/11 Küçükesat 06700, Ankara, Turkey
Tel: +90 312 304 4701
Fax:+90 312 326 0551
E-mail: nbulak@gata.edu.tr
Abstract
Keywords
brain tumors; diffusion; diffusion-tensor imaging; diffusion-tensor metrics; diffusion-weighted MRI; diffusivity; fractional anisotropy; magnetic resonance imaging; MRI; MR tractography; treatment
Primary and metastatic brain tumors are serious health problems and have some critical challenges in both their diagnosis and treatment. Primary brain tumors are mostly neuroepithelial in origin. The most common primary brain tumors are meningiomas and glioblastomas in adults, and pilocytic astrocytomas, malignant glioma and embryonal tumors in children [201]. According to the central brain tumor registry of United States (CBTRUS) report in 2009 [201], the age-adjusted overall annual incidence rate for primary CNS tumors was 18.16 per 100,000 person-years. In the 2009 update of cancer statistics of American Cancer Society [1], the number of estimated new cases of primary CNS tumors in the USA is approximately 22,070 and the estimated number of deaths due to primary CNS tumors is approximately 12,920. On the one hand, primary brain tumors are the second most common malignancy and the first most common solid malignant tumor among children, following leukemias as a group being the most common [202] and the second most common cause of cancer-related deaths in younger patients with an overall 5‑year period survival rate of 35.5% for all ages [1]. On the other hand, metastatic brain tumors are the most common intracranial neoplasm in adults (20–40% of all metastatic cancers) with significantly high rates of morbidity and mortality and they outnumber the primary brain tumors by a ratio of 10:1 [203]. The increase in detection rate of metastatic brain tumors is due to advancement in imaging modalities and improvement in cancer therapy for systemic disease [203].
The imaging modality of choice for brain tumor diagnosis is MRI due to its high contrast resolution, and multiplanar, volumetric imaging capability allowing tissue characterization to some extent. It provides detailed anatomic information regarding the anatomic relation of the tumor and affected brain tissue but it cannot give specific information concerning tumoral white matter involvement, which is critical for treatment planning to minimize the injury to eloquent white matter tracts during surgery. The signal attenuation due to molecular diffusion is one of the most important magnetic resonance (MR) contrast mechanisms [2,3]. Diffusionweighted imaging (DWI) allows the display of diffusion of water protons as a function of spatial location [2,3]. A more advanced diffusion-based MRI method, diffusion-tensor imaging (DTI), processes the diffusion information in a tensor model, which describes the magnitude, degree and orientation of diffusion anisotropy, and estimates the white matter connectivity in a 3D model termed MR tractography [2–11]. In this article, the basic physics, methodology, clinical applications and limitations of DTI and MR tractography relevant to brain tumor diagnosis are reviewed.
Basic physics & methodology
The translational motion of free water protons (i.e., Brownian motion) in 3D volume is mainly dependent on the temperature and density of the microenvironment, and on the dimensions of the moving molecules. If the motion of water protons is free in all directions, as in cerebrospinal fluid (CSF), the resultant diffusion in each direction is equal to each other, in other words, it is isotropic in nature, but if it is hindered in one or more directions as in brain tissue, no longer is the resultant diffusion equal to each other in all directions (i.e., it is anisotropic). The effect of anisotropic diffusion of bounded water protons on magnetization transfer (Bloch) equation was first described by Torrey in 1956 as an artifact causing an increase in MR signal [12]. In 1965, Stejskal and Tanner successfully separated the effect of anisotropic diffusion from spin echo signal by designing a dedicated diffusionweighted sequence in which it sensitized to the diffusion of water protons by applying special diffusion gradients [13].
Brain tissue predominantly causes an anisotropic diffusion of water protons in certain amounts by limiting their motions owing to different anatomical (cell types, cellular architecture and density) and physiological (permeability and microdynamics) properties. The amount of diffusion along the applied diffusion gradient can be calculated from DWI data and expressed as the apparent diffusion coefficient (ADC). The calculated ADC value can completely describe the whole properties of an isotropic diffusion but not those of an anisotropic one. In this situation, generating diffusion tensor rather than ADC is preferred for accurate characterization of diffusion restriction in different directions, which is caused by the shape or the boundaries of the volume in which the molecular movement takes place.
By definition, ‘tensor’ is a mathematical function describing a complex physical phenomenon and is demonstrated as a vectorial quantity defined by more than three values. The diffusion tensor basically describes the 3D diffusion phenomenon by using a matrix of numbers derived from measurements of at least six or more applied diffusion gradients in different ways. After analytical diagonalization of diffusion tensor, a 3D shape is formed by calculating three eigenvectors having three eigenvalues (l1, l2 and l3), which are perpendicular to each other [14]. The shape of this function can be changed from ellipsoid, as in anisotropic diffusion of a proton located in corpus callosum, to a sphere, as in isotropic diffusion of a CSF proton. The length of this ellipsoid is parallel to the major eigenvector having the highest eigenvalue and is also assumed to be parallel to the white matter tracts in measured voxel because the motion of water molecules along the myelinated white matter fibers is relatively free while perpendicular to them, it is more hindered [15]. This is the basic knowledge used for MR tractography. In MR tractography, after choosing a seed-point, the direction of ellipsoids (major eigenvectors) of contiguous voxels were followed as a path that represents the white matter tracts located in parallel and this is known as line-propagation method [4–6,9]. The propagation is usually terminated when the tract trajectory reaches a voxel with a small anisotropy (fractional anisotropy [FA] <0.2–0.15) in which the estimated major eigenvector direction becomes very sensitive to image noise or when the angle between two consecutive steps is greater than 41–45° [7]. As a result, MR tractography estimates the 3D representation of white matter tracts.
High-field MR scanners (1.5 T or preferably ≥3 T) equipped with strong gradients (>35 mT/m) are ideal for DTI and MR tractography. A minimum of eight or more element arrayed radio frequency head-coil, with at least four or more channel receiver systems, should be used for acquisition. Volumetric gradient echo T1 or fluid-attenuated inversion recovery images with or without paramagnetic contrast administration are usually acquired for the background image. Single-shot spin echo echo planar sequence, with diffusion gradients applied in at least six or more noncollinear directions including b = 0, where b = 800–1000 s/mm2 , is usually used for DTI. A larger field of view and higher acquisition matrix are used as much as possible with a slice thickness of 2 mm or less. All images are usually zero-filled to the final reconstruction matrix size of 256 × 256. Parallel imaging with a reduction factor of two or more is usually preferred in order to decrease the acquisition time and to reduce susceptibility and eddy current artifacts. Care should be taken to obtain DTI images only before or after injection of the contrast medium for comparative studies because diffusion-tensor images obtained 6 min after contrast-medium injection result in significant changes in diffusion isotropic and anisotropic values [16].
The analysis of DTI data always needs dedicated software. Volumetric f luid-attenuated inversion recovery or T1‑weighted gradient echo images coregistered to ADC and FA maps are used for quantitative and qualitative analysis of tumoral and peritumoral areas. In the placement of regions of interest (ROI) care is needed to avoid cystic/necrotic areas, CSF-filled sulci or cisterns and major vessels. The area of measured ROI must be kept constant minimizing the confounding factors in DTI analysis.
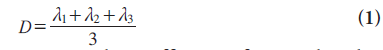
Diffusion-tensor imaging metrics are usually calculated on a voxel-by-voxel basis. The mean diffusivity (MD) or, in other words, ADC, can completely describe the whole physical properties of an isotropic diffusion but cannot describe those of an anisotropic diffusion. MD is simply the mean of three major eigenvectors as shown in Equation 1:
Owing to the insufficiency of MD to describe all the physical properties of anisotropic diffusion, different diffusion measures such as parallel (axial,Λ||) and perpendicular (radial, λ⊥) diffusivities, p‑, q‑, L‑anisotropies and FA, and linear, planar and spherical anisotropy coefficients (CL, CP0 and CS) were defined [8,17–25]. The equations of DTI metrics frequently used in tumor diagnosis are listed below:
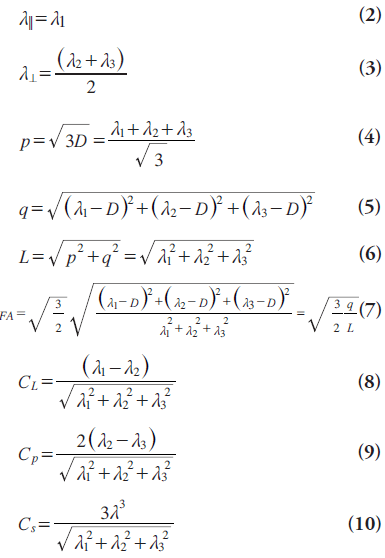
The FA is the most commonly used and is sensitive to the movement of water molecules through predominant diffusion in any one direction rather than equal diffusion in all directions. It has no units because it represents a ratio of diffusion coefficients. While lower FA values represent nearly isotropic diffusion, higher ones represent extremely anisotropic diffusion.
By using these anisotropy metrics, different scalar or directionally encoded color images can be generated (Figure 1). In these maps, the direction of the greatest diffusivity with color intensity is directly proportional to relevant DTI metric. In a color-coded image, red is usually assigned to medial–lateral orientation, green to rostral–caudal orientation and blue to superior– inferior orientation. A decrease in the intensity of colors in color-coded maps is assessed as reduced anisotropy. The location and direction of each tract should be evaluated as normal or abnormal.

Figure 1. Color-coded fractional anisotropy maps in normal volunteer. Axial directionally encoded color-coded fractional anisotropy maps from different levels (A–D) demonstrate normal anatomy of white matter tracts in brain and brainstem. In these maps, red is assigned to medial–lateral orientation, green to rostral–caudal orientation and blue to superior–inferior orientation. The color intensity is directly proportional to the amount of diffusional anisotropy.
Further to these maps, fiber tracking is usually performed for corresponding white matter tracts according to the orientation to the tumor location for semiquantitative analysis (Figure 2). For fiber tracking, a seed-point is chosen from among the different anatomical landmarks according to the anatomical orientation of the corresponding white matter tract. 3D reconstruction of white matter tracts are made mostly by means of an algorithm based on the fiber assignment by continuous tracking method [6].

Figure 2. 3D tractography images in normal volunteer. 3D magnetic resonance tractography images of white matter tracts reconstructed by fiber assignment by continuous tracking method in (A) whole brain, (B) corticospinal tract and (C) corpus callosum.
Besides these anisotropy metrics, alternative methods for assessing brain tumors were also defined in the literature by DTI. The first is the tumor infiltration index (TII), which is expressed in Equation 11 as:
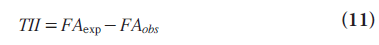
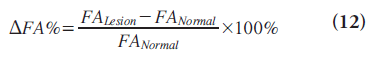
where FAexp is the FA that one would expect for the corresponding MD if the edema were not infiltrated with tumor and FAobs is the measured FA [26]. The second is the fiber density index (FDI), which is constructed by determining the mean number of fiber paths passing through each pixel in the ROI; that is, FDI = number of fiber paths passing through ROI/area of ROI (in pixels) [27]. The third is the DFA% on the lesion side, which is defined as the percentage of FA decrement adjacent to the tumor, compared with the contralateral normal hemisphere and calculated by Equation 12 [28]:
Clinical applications
Diffusion-weighted imaging and ADC calculation have long been used for tumor diagnosis. DWI is a very useful and rapid technique, which provides very valuable information regarding the differential diagnosis of cystic brain lesions [29–32]. High signal intensity characteristics of brain abscesses, epidermoid tumors and lymphomas on DWI may be helpful to differentiate them from cystic/necrotic tumors and metastases, arachnoid cysts and toxoplasmosis, respectively, which show similar signal intensity to CSF on DWI [29–32], but necrotic tumor and cystic metastases may occasionally show restricted diffusion on DWI [33]. Similarly, tumor recurrence may have significantly lower maximum ADC values than radiation necrosis [34,35], but spatial resolution of current imaging technique may not be high enough to show whole tissue heterogeneity and characteristics allowing an absolute differentiation [36]. The results of studies assessing tumor type and grade by DWI had some controversies [37,38], but they mostly demonstrated an inverse correlation between mean, parallel (axial, λ||) and perpendicular (radial, λ ⊥) diffusivities and tumor grade or cellularity [23,39–44]. Use of minimum ADC values may improve the efficacy of ADC for grading [45,46]. Either increased cellularity or tortuosity due to change in the composition of extracellular matrix by increased content of hydrophilic molecules can slow down the ADC without any change in extracellular space volume due to increased diffusion barriers in the tumoral environment [42,47–49]. But the increment in mean diffusibility during the tumor-growing process owing to increased tumoral cellularity or tortuosity, which minimizes the interstitial space, can be canceled by the effect of vasogenic edema, which causes an increment of extracellular compartment due to the destructive structural alterations of neuronal architecture [37,39,48]. Furthermore, DWI and ADC calculation can provide an early surrogate marker for monitoring the response of tumors to therapy [49,50]. Chenevert et al. detected a rapid increment in the mean ADC values shortly after treatment initiation and the magnitude of the diffusion changes corresponded with clinical outcome [49].
Besides these clinical applications, DWI and MD measurements usually fall behind in the evaluation of tumoral white matter tracts involvement. DTI and calculated anisotropy measures are useful for tumoral and peritumoral tissue characterization as well as for the estimation of potential patterns of white matter tract involvements. For detailed analysis, the DTI application in the brain tumor diagnosis is reviewed here in three subheadings including tumor characterization, the assessment of peritumoral area and post-therapeutic changes.
Tumor characterization
Fractional anisotropy is superior to MD in the assessment and delineation of different degrees of glial tumor infiltration [51]. The results of previous studies, which quantified the tumoral and peritumoral FA values, showed that low-grade gliomas (Figure 3) tend to have higher tumoral FA values than high-grade gliomas (Figure 4) but there is no distinct cutoff FA value for precise differentiation [23,51–54]. Goebell et al. observed a continuous decline of FA from the surrounding tissue of the tumor toward the center due to increased neuronal degeneration or relative decrease of neurons in relation to tumor tissue towards the center of the tumor [55]. In addition, a narrow rim of increased FA and decreased MD values around the enhancing tumoral area, resembling tumor cell infiltration, is indicative of high-grade gliomas and not seen in lowgrade ones [53]. A lower incidence of destructive changes and more preservation of white matter tracts in low-grade tumors causes a smaller reduction in FA values than high-grade tumors. Contrary to ADC, a significant reduction in FA values with increasing tumor grade suggests that FA and ADC are affected by different pathophysiological events that occur during the tumoral growth. As stated before, this multifactorial influence of mean diffusibility prevents a precise tumor grading and it is not directly dependent on the integrity of white matter tracts [41,52]. However, FA is mainly designated by the amount and the direction of diffusion restriction of water molecules along the myelinated white matter tracts and affected by the percentage of preserved and destroyed white matter tracts in the tumoral area [56–58]. The more prominent FA reduction in high-grade tumors compared with low-grade tumors is a consequence of the higher incidence of cystic and necrotic changes causing loss of white matter tract organization and integrity, and some investigators also suggest that FA is more sensitive than ADC in the detection of early tumoral involvement [52,57,58]. But any change in white matter tract composition by tumoral growth can affect the FA values, and reduction in FA is not a very specific finding for the detection of these types of changes because it can potentially result from fiber depletion (tumor destroys fibers, reducing their absolute numbers), fiber dilution (tumor or vasogenic edema spreads intact fibers apart, reducing their density) or fiber degradation (fibers themselves become intrinsically less anisotropic, retaining normal numbers and density) [27,59]. Roberts et al. [27] showed that FDI, which is highly correlated with FA, would distinguish degradation, in which FDI would presumably remain normal (at least until anisotropy falls below threshold), from depletion and dilution, in which FDI would be reduced [59].

Figure 3. Low-grade glioma. The (A) axial fluid-attenuated inversion recovery, (B) contrast-enhanced T1-weighted, (C) apparent diffusion coefficient map and (D) fiber assignment map images of low-grade glioma at the left temporal lobe show moderate infiltration and displacement (arrowheads) with relatively higher fiber assignment values than high-grade gliomas.

Figure 4. High-grade glioma. The (A) axial fluid-attenuated inversion recovery, (B) contrast-enhanced T1-weighted, (C) apparent diffusion coefficient map and (D) fiber assignment map images of high-grade glioma at the left basal ganglia and occipito–temporal deep white matter show destruction (arrowheads) and peritumoral infiltration (arrows) with relatively low fiber assignment values.
Moreover, the qualitative assessment of DTI maps can define the different types of tumoral involvement such as displacement (characterized by normal or only slightly decreased FA with abnormal location and/or direction), edema (characterized by substantially decreased FA with normal location and direction), infiltration (characterized by substantially decreased FA with abnormal direction), destruction (characterized by near isotropic diffusion without any identifiable tract on directional color-coded maps) or a combination of two or more [7,28,58,60]. Price et al. showed an increase in p‑values and a less marked reduction in q‑values in the infiltrated tracts, but a marked reduction in q‑ and increase in p‑values in the destructive tracts [25]. Yen et al. showed that a positive DFA% is likely to be associated with edema or displacement, a DFA% between 0 and ‑30% is associated with displacement and infiltration, and a DFA% of less than -30% with disruption [28]. As stated in the literature, such qualitative assessment of DTI may improve the possibility of distinguishing low- and high-grade glial tumors or infiltrative gliomas and noninfiltrative tumors such as metastases (Figure 5) or meningiomas (Figure 6) from each other [26,48,58,61–65].

Figure 5.Brain metastasis of small-cell lung cancer. The (A) axial fluid-attenuated inversion recovery, (B) contrast-enhanced T1-weighted, (C) apparent diffusion coefficient map and (D) fiber assignment map images demonstrate multiple metastases throughout the brain. The metastasis at the right thalamus shows a smooth displacement (arrowheads) in adjacent right corticospinal tract consistent with noninfiltrative tumor.

Figure 6.Meningioma.The (A) axial fluid-attenuated inversion recovery, (B) contrast-enhanced T1-weighted, (C) apparent diffusion coefficient map and (D) fiber assignment map images show a dural-based extra-axial meningioma at the right frontal region causing prominent edema (arrowheads) in adjacent brain parenchyma.
Besides gliomas and metastases, diffusion information can also be used for the assessment of other types of brain tumors. Dysembryoplastic neuroepithelial tumors (Figure 7) have significantly higher ADC values than normal parenchyma and ADC values have the highest correlation with tumor diagnosis among other imaging techniques such as MR spectroscopy and perfusion imaging [66]. Central neurocytomas (Figure 8) have a heterogeneous hyperintense appearance and lower apparent water diffusivity when compared with the contralateral white matter and may complicate diagnosis by resembling high-grade gliomas [67]. Classic meningiomas have significantly lower tumoral FA, higher tumoral ADC and more spherical diffusion than atypical meningiomas but there is no difference in DTI metrics obtained from peritumoral edema because of the noninfiltrative nature of both tumors [68]. The FA and ADC of primary cerebral lymphoma are significantly lower than those of glioblastomas because of their higher tumoral cellularity and nucleus/ cytoplasm ratio than glioblastomas and different cutoff values are defined to differentiate lymphomas from glioblastomas such as 0.192 for FA, 0.33 for FA ratio, 0.818 for ADC and 1.06 for ADC ratio [69]. Although Beppu and colleagues had previously reported a positive correlation of FA value with glial tumor cellularity in their different articles [70–72], the results of more recent articles suggest that FA is inversely related to tumoral cellularity [51,69]. This is another controversy regarding the use of DTI, which needs to be evaluated by further histological cross-matched studies.

Figure 7.Dysembryoplastic neuroepithelial tumor. The (A) axial fluid-attenuated inversion recovery, (B) contrast-enhanced T1-weighted, (C) apparent diffusion coefficient map and (D) fiber assignment map images show a dysembryoplastic neuroepithelial tumor at the left frontal lobe causing mild displacement (arrowheads) in peritumoral white matter tracts

Figure 8.Central neurocytoma. The (A) axial fluid-attenuated inversion recovery, (B) contrast-enhanced T1-weighted, (C) apparent diffusion coefficient map and (D) trace diffusion-weighted images demonstrate a central neurocytoma located at the right lateral ventricle and corpus callosum with very low apparent diffusion coefficient values with faint peritumoral edema resembling high-grade glioma.
Diffusion-tensor imaging has effective applications in posterior fossa as well as supratentorial tumors [60,73–75]. Brainstem gliomas, which account for approximately 15% of pediatric brain tumors, are usually differentiated as WHO grade II fibrillary astrocytomas or WHO grade III anaplastic astrocytomas at diagnosis and are known to infiltrate between normal axonal fibers [60,76]. The knowledge of the anatomic and functional relationship between the tumor and adjacent white matter tracts is particularly important in the treatment planning of brainstem tumors where many important functional fiber tracts are passed and crossed.
Although surgical options have high risks, they are essential in brainstem decompression, providing a means for acquiring the histological diagnosis or determining the subsequent therapy [75]. DTI can nicely demonstrate the relation between white matter tracts and tumor (Figure 9) and provide valuable information for both surgical planning and the outcome [73,74]. In a recent study investigating the efficacy of DTI in the detection of axonal degeneration in patients with brainstem tumors, Helton et al. found that FA values were altered proximal and distal to the brainstem tumors with a bimodal peak of antegrade decreased FA involving second- and third-order sensory axons and retrograde decreased FA of motor axons and they recommended use of DTI for therapy planning because it may improve prognostication of the possible functional tract recovery following therapy [74]. In their study, in which the efficiency of DTI metrics on surgical outcome of patients with primary posterior fossa tumors is probed, Lui et al. showed that higher MD and lower FA in the brainstem corticospinal tract are associated with contralateral motor deficits, and lower transverse eigenvalue measures in the corticospinal tracts may be observed with an unfavorable clinical outcome [73].

Figure 9.Brainstem glioma. 3D coregistered magnetic resonance tractography images of different brainstem tumors (A–C) show diffuse infiltration with smooth displacement and separation in adjacent preserved white matter tracts. This is a very typical appearance for infiltrative brainstem gliomas.
Evaluation of peritumoral area
The precise differentiation between tumoral infiltration and pure vasogenic edema on the basis of DTI data is still in debate, but the results of different studies are very encouraging [26,48,58,63–65]. Lu et al. showed that TII may be more helpful than DTI metrics for this differentiation because metastases have significantly higher mean peritumoral MDs and lower TIIs than gliomas [26]. However, they did not detect any difference in FA values similar to the results of Tsuchiya et al. [64]. Furthermore, Morita et al. demonstrated by using l‑chart analysis that the apparent water diffusivity of peritumoral edema was significantly higher in high-grade gliomas than in both metastases and meningiomas owing to the destruction of the extracellular matrix ultrastructure by malignant cell infiltration causing greater water diffusion in the former [48]. Conversely, Provenzale et al. showed that mean FA, but not ADC, of peritumoral hyperintense and normal-appearing peritumoral regions for gliomas are significantly lower than those for meningiomas [65]. Contrary to previous results, this is a very promising finding because the difference between DTI metrics obtained from normal-appearing peritumoral white matter and normal-appearing contralateral white matter in infiltrative gliomas suggests that DTI has the ability to detect early tumoral infiltration before becoming prominent on conventional MR images and also supports the prior hypothesis that DTI can provide better delineation of glial tumor margins for exact treatment planning [63]. Additionally, the results of two more recent studies using more sophisticated DTI metrics are not only more interesting but also more challenging [18,77]. In the first of the two, Wang et al. [18], using FA, p‑, q‑ and L‑anisotropies, detected that glioblastomas have significantly lower q‑anisotropy and FA in gross tumor and lower q‑anisotropy in the peritumoral region than metastases and they did not find any significant difference in any DTI metrics obtained from peritumoral normal-appearing white matter. In the second, Wang et al. obtained linear and planar anisotropy metrics beside FA and ADC from tumoral central, tumoral enhancing, immediate peritumoral and distant peritumoral areas [77]. They showed that FA, CL and CP from glioblastomas were significantly higher than those of brain metastases from all segmented regions, and the differences from the enhancing regions were the most significant. The best logistic regression model included three parameters (ADC, FA and CP) from the enhancing part, resulting in 92% sensitivity, 100% specificity and an area under the curve of 0.98, and they recommended the combined usage of DTI metrics in assessment of brain tumors.
In addition to tumor characterization and differentiation, DTI findings are also crucial for treatment planning [78–92]. Mapping the tumoraltered white matter tracts by MR tractography (Figure 10) and implementation of the knowledge of structural integrity and location of eloquent pathways relevant to tumors on to DTI-based surgical functional navigation systems allowing intraoperative fiber tracking can improve the indications for determining surgical strategy, contribute to maximal safe resection of cerebral gliomas with corticospinal tract involvement, prevent or minimize the chance of devastating damage to the clinically eloquent white matter tracts during surgery, decrease the duration of surgery, patient fatigue and intraoperative seizures, and increase the quality of life of patients who survive high-grade glial tumors [87–91]. Both intraoperative electrocortical stimulation [93–95] or functional MRI (fMRI)-guided [19,80,82,84,85,96,97] advanced DTI fiber tracking implementations can also provide more accurate anatomical and functional delineation of eloquent white matter tracts and their relationship to the tumor than conventional MR-based surgical navigation systems. They may also provide access to direct connectivity information between functional regions of the brain. The fMRI-guided DTI applications allow a more comprehensive and functionally related white matter mapping than DTI by increasing the tracking ability of DTI in infiltrated white matter tracts owing to proper selection of fMRI-activated, desired fiber bundles, especially when there is a tumor-related deviation in white matter tracts [19].

Figure 10.3D coregistered magnetic resonance tractography images for preoperative assessment of relation between the tumor and eloquent white matter tracts. (A) Left frontal lobe tumor causes a total posterior displacement at the left corticospinal tract compared with the right one but still has enough distance away from the tract for safe resection. (B) Right thalamic tumor smoothly displaces the right corticospinal tract to posterior, which is consistent with a good respectability criterion. (C) Huge left frontal lobe tumor partly infiltrates and partly displaces the left corticospinal tract posteriorly. (D) Left occipital lobe tumor displaces the left optic tract smoothly upward.
Assessment of postoperative changes
Diffusion-tensor imaging is a very promising tool for comparing the status of eloquent cortical pathways before and after the surgery and gives an opportunity to the neurosurgeon to demonstrate the preservation of endangered tracts postoperatively (Figure 11) [73,86,98]. Laundre et al. showed that preoperative corticospinal tract involvement, as determined by DTI, is predictive of the presence or absence of motor deficits, and postoperative corticospinal tract normalization on DTI is predictive of clinical improvement [86]. DTI may also improve the clinical outcome by allowing maximum tumor resection while preserving the noninfiltrated white matter tracts. In their prospective study, Yu et al. classified the relationship of tumors and eloquent white matter tracts as simple displacement, displacement with infiltration and simple disruption; they achieved the maximum tumor resection in tumors with simple displacement and performed extensive resection by preserving the residual part of the tract in tumors with displacement with infiltration and simple disruption [98].

Figure 11.Diffusion-tensor imaging in postoperative assessment of brain tumors. (A) 3D magnetic resonance tractography image for the postoperative assessment of right hemispheric glioblastoma shows a total destruction of the right corticospinal tract with complete preservation of the left one. (B) Postoperative assessment of glioblastoma involving the corpus callosum shows relative preservation of the corticospinal tracts.
Diffusion-tensor imaging also allows the detection and monitoring of treatment-induced neurotoxicity in cerebral white matter [98–102]. Several studies investigating the effect of cranial irradiation and chemotherapy indicate a prominent decrease in mean FA values that are more severe in the frontal lobes compared with the parietal lobes despite the same radiation dose, suggesting regional susceptibility in the frontal lobe [99–104]. The post-treatment decline in FA values is also correlated with radiation dose, age at treatment (<5 years and >65 years), longer interval since treatment (>5 years), more than one vascular risk factor (hypertension, smoking, diabetes mellitus, alcoholism and multiple regimen of chemotherapy treatment) and deterioration in cognitive functions such as decrease in school performance or in intelligence quotient [99–104]. On the other hand, parallel (λ ||) and perpendicular (λ⊥) diffusivities increased linearly and significantly with time, starting at 3 weeks and continuing to 32 weeks from the start of radiation therapy [22]. These findings indicate radiation-induced dose-dependent demyelination and mild structural degradation of axonal fibers in acute and subacute stages, which is followed by subsequent diffuse doseindependent demyelination and mild axonal degradation [22].
Knowledge on the efficiency of DTI in the differentiation of tumor recurrence from radiation necrosis is relatively limited [20,105]. Sundgren and colleagues reported significantly higher ADC values in the contrast-enhancing lesions for the tumor-recurrence group and higher FA ratios in normal-appearing white matter tracts adjacent to the edema in the nonrecurrence group [20].
Diffusion-tensor imaging has also been used for the demonstration of other effects of surgery on cortical pathways. Early changes due to Wallerian degeneration can be detected by DTI before conventional MR images and is characterized by increased MD and reduced FA [106,107]. It has been reported in the ipsilateral corticospinal tract after hemispherectomies [108] and in optic radiation after temporal lobectomies [109]. Furthermore, Concha et al. showed that the reduction in FA values following corpus callosotomy in the first week after surgery is due to axonal fragmentation, which causes an increase in axial diffusivity, and in 2–4 months after surgery is due to demyelination, which causes an increase in the radial diffusivity [110].
Limitations
There are a number of limitations of DTI arising from its technique or applications. First of all, there is no ‘gold standard’ for in vivo tractography to validate its reliability [5]. There is some difficulty in comparing fiber directions in living tissue and a fixed specimen using histological confirmation owing to postmortem changes during sample registration, dissection, freezing, dehydration, fixation, microtoming and thawing [5]. However, recent studies showed a close correspondence of the tracts generated from the atlas with tracts isolated with classical dissection of postmortem brain tissue with certain limitations of DTI tractography, particularly for regions at remote locations from seeds [111,112]. Additionally, DTI cannot provide information regarding the connectivity of the brain at the cellular level but only reflects the macroscopic configuration of prominent fiber bundles [113].
Magnetic resonance tractography also suffers from thermal noise, physiological fluctuations and image artifacts, but its major disadvantage is the incapability of resolving fiber branching or crossing in the same voxel because it uses the consensus averaging of the eigenvalues of measured voxel owing to the limited number of applied diffusion gradients [5,10,114,115]. More sophisticated techniques, such as diffusion spectrum imaging [116], q‑ball imaging [117], high angular diffusion imaging [117–119] and combined hindered and restricted diffusion [120], can be used to minimize this technical challenge by providing more realistic depiction of areas of complex fiber architecture [10,117–119].
Other limitations of DTI practice include:
• Difficulties in reproducible determination of DTI-derived parameters and fiber-tracking images according to different user-defined FA values, angular thresholds, fiber lengths or locations of seed points causing a discordance to the anatomical landmarks;
• Limited resolution of DTI data leading to substantial partial volume effects;
•High sensitivity to motion;
• Susceptibility artifacts as a result of using a echo planar imaging technique [11,113].
Most of these limitations can be minimized by using higher magnet fields, stronger and faster gradients, non-echo-planar imaging sequences and the development and optimization of more sophisticated algorithms [11,121,122]. Stieltjes et al. defined a fast and reproducible method for the quantitative analysis of corpus callosum infiltration and contralateral involvement using a probabilistic mixture model, which shows that quantitative DTI may be suitable for reliable depiction of fiber integrity and white matter infiltration by primary brain tumors [123]. In a recent article comparing the different approaches of DTI focusing on the positioning of the seed ROI, Hattingen et al. showed that the location of the seed ROI from which the tracking algorithm starts has a significant influence on the tracking results and the upward fiber tracking of the corticospinal tract should be preferred in patients with spaceoccupying lesions, whereas downward fiber tracking should not be performed before upward fiber tracking fails [124]. Trying to keep the used parameters constant may help to produce more reproducible results in comprehensive studies.
Moreover, nonspecific loss of anisotropy in both infiltrated and edematous tracts poses a problem for MR tractography algorithms, which abort when the anisotropy falls below an arbitrary threshold [125]. Relaxing the stopping criteria may allow an algorithm to proceed through low-anisotropy regions, but this increases the risk of generating spurious tracts because estimates of primary eigenvector direction become less reliable for low-anisotropy tensors [125,126]. Furthermore, uncertainty in the definition of tumoral and peritumoral areas in different studies [18,26,48,58,62–65,77] can cause conflicting results, as stated in an earlier section.
Future perspective
Although DTI has some limitations and technical challenges, it has been used very effectively in brain tumor diagnosis. It is the only novel technique that has the ability to visualize white matter tracts as well as their microstructural changes related to tumor tissue. The advances in DTI and MR tractography techniques will improve their effectiveness in both the diagnosis and the followup of brain tumors. As Alexander et al. emphasize in their article [11], a rigorous improvement in information collection has been expected, which is more specific to microstructural tissue pathology by the applications of non-monoexponential diffusion decay measurements [127,128] and complex models of diffusion behavior [120,129,130]. As noted in the article, in which the pros and cons of these new imaging diffusion techniques are discussed superbly by Hagmann et al. [10], q‑ball imaging provides information regarding diffusion orientation and anisotropy, and accurate depiction of fiber crossings within reasonable acquisition time but it is a hypothesis-based technique with limited accuracy and needs high hardware requirements. On the other hand, diffusion spectrum imaging is a principle-based, hypothesis-free technique and has already received theoretical and practical validation. It provides accurate depiction of fiber crossings with a specific angular resolution and maps of the entire field of diffusion, providing 6D data and increasing the possibility of quantitation and diffusion tensor information. However, hardware requirements of this technique are high and the acquisition time is comparatively long, which is hardly tolerable for patients. Further to these techniques, newly developed diffusion imaging models [131–134] may also yield more detailed expression of the complex structural organization of the white matter of the brain by obtaining different types of structural information according to the technique used. When all these advancements, most of which have taken place in the past 10 years, are taken into account in the near future, further crucial improvements in DTI should be expected, leading to a clearer and more accurate definition of the complex neuronal architecture of white matter tracts and their changes due to tumoral infiltration, and to more effective guiding in glioma surgery.
Conclusion
Diffusion-tensor imaging is a very promising tool to demonstrate the complex ultrastructural organization of the white matter of the brain due to characterization of the 3D diffusion properties of water. Current applications of DTI and MR tractography can accurately delineate the eloquent white matter tracts and their relation with tumoral tissue. The moderate sensitivity of DTI in the differentiation of peritumoral vasogenic edema from tumor infiltration can be improved when combined with other MRI techniques such as MR spectroscopy or perfusion imaging, or by using more advanced diffusion metrics or techniques. Application of DTI data to surgical functional navigation systems helps to determine the proper surgical strategy, provides maximal safe resection of tumor by minimizing the chance of devastating damage to the clinically eloquent white matter tracts, decreases the duration of surgery and its complications and increases the survival of patients with high-grade glial tumors. DTI is also a very useful probe to monitor the posttherapeutic changes occurring in white matter tracts. As a result, the advantages of this technique outweigh its disadvantages, which include limited resolution, problems in solving the crossing fibers, low reproducibility, and high sensitivity to motion and susceptibility artifacts, which are minimized through the development of more sophisticated methods and techniques.
Financial & competing interests disclosure
The author has no relevant affiliations or financial involvement with any organization or entity with a financial interest in or financial conflict with the subject matter or materials discussed in the manuscript. This includes employment, consultancies, honoraria, stock ownership or options, expert testimony, grants or patents received or pending, or royalties.
No writing assistance was utilized in the production of this manuscript.
Papers of special note have been highlighted as:
* of interest
* of considerable interest
References
- Jemal A, Siegel R, Ward E, Hao Y, Xu J, Thun MJ: Cancer statistics, 2009. CA Cancer J. Clin. 59(4), 225–249 (2009).
- Basser PJ, Mattiello J, LeBihan D: Estimation the effective self-diffusion tensor from the NMR spin echo. J. Magn. Reson. B. 103(3), 247–254 (1994).
- Basser PJ, Mattiello J, LeBihan D: MR diffusion tensor spectroscopy and imaging. Biophys. J. 66(1), 259–267 (1994).
- Lazar M, Weinstein DM, Tsuruda JS et al.: White matter tractography using diffusion tensor deflection. Hum. Brain Mapp. 18(4), 306–321 (2003).
- Basser PJ, Pajevic S, Pierpaoli C, Duda J, Aldroubi A: In vivo fiber tractography using DT-MRI data. Magn. Reson. Med. 44(4), 625–632 (2000).
- Mori S, Crain BJ, Chacko VP, van Zijl PC: 3D tracking of axonal projections in the brain by magnetic resonance imaging. Ann. Neurol. 45(2), 265–269 (1999).
- Jellison BJ, Field AS, Medow J, Lazar M, Salamat MS, Alexander AL: Diffusion tensor imaging of cerebral white matter: a pictorial review of physics, fiber tract anatomy, and tumor imaging patterns. AJNR Am. J. Neuroradiol. 25(3), 356–369 (2004). & Detailed review of basic diffusion physics, fiber tract anatomy and applications of diffusion-tensor imaging (DTI) in brain tumor diagnosis, which describes DTI-based classification of types of tumoral involvement.
- Westin CF, Maier SE, Mamata H, Nabavi A, Jolesz FA, Kikinis R: Processing and visualization for diffusion tensor MRI. Med. Image Anal. 6(2), 93–108 (2002).
- Conturo TE, Lori NF, Cull TS et al.: Tracking neuronal fiber pathways in the living human brain. Proc. Natl Acad. Sci. USA 96(18), 10422–10427 (1999).
- Hagmann P, Jonasson L, Maeder P, Thiran JP, Wedeen VJ, Meuli R: Understanding diffusion MR imaging techniques: from scalar DWI to diffusion tensor imaging and beyond. Radiographics 26(Suppl. 1), 205–223 (2006). & Excellent review paper on physics and future applications of DTI, which discusses the pros and cons of each technique in detail.
- Alexander AL, Lee JE, Lazar M, Field AS: Diffusion tensor imaging of the brain. Neurotherapeutics 4(3), 316–329 (2007). & Discusses basic physics, techniques and recent clinical applications of DTI of the brain.
- Torrey HC: Bloch equations with diffusion terms. Phys. Rev. 104, 563–565 (1956).
- Stejskal E, Tanner J: Spin diffusion measurements: spin echoes in the presence of time-dependent field gradient. J. Chem. Phys. 42, 282–292 (1965).
- Hasan KM, Basser PJ, Parker DL, Alexander AL: Analytical computation of the eigenvalues and eigenvectors in DT-MRI. J. Magn. Reson. 152(1), 41–47 (2001).
- Moseley ME, Cohen Y, Kucharczyk J et al.: Diffusion-weighted MR imaging of anisotropic water diffusion in cat central nervous system. Radiology 176(2), 439–446 (1990).
- Bae MS, Jahng GH, Ryu CW, Kim EJ, Choi WS, Yang DM: Effect of intravenous gadolinium-DTPA on diffusion tensor MR imaging for the evaluation of brain tumors. Neuroradiology (2009) (Epub ahead of print).
- Kim S, Pickup S, Hsu O, Poptani H: Diffusion tensor MRI in rat models of invasive and well-demarcated brain tumors. NMR Biomed. 21(3), 208–216 (2008).
- Wang W, Steward CE, Desmond PM: Diffusion tensor imaging in glioblastoma multiforme and brain metastases: the role of p, q, L, and fractional anisotropy. AJNR Am. J. Neuroradiol. 30(1), 203–208 (2009).
- Schonberg T, Pianka P, Hendler T, Pasternak O, Assaf Y: Characterization of displaced white matter by brain tumors using combined DTI and fMRI. Neuroimage 30(4), 1100–1111 (2006).
- Sundgren PC, Fan X, Weybright P et al.: Differentiation of recurrent brain tumor versus radiation injury using diffusion tensor imaging in patients with new contrastenhancing lesions. Magn. Reson. Imaging 24(9), 1131–1142 (2006).
- Song SK, Sun SW, Ju WK, Lin SJ, Cross AH, Neufeld AH: Diffusion tensor imaging detects and differentiates axon and myelin degeneration in mouse optic nerve after retinal ischemia. Neuroimage 20(3), 1714–1722 (2003).
- Nagesh V, Tsien CI, Chenevert TL et al.: Radiation-induced changes in normalappearing white matter in patients with cerebral tumors: a diffusion tensor imaging study. Int. J. Radiat. Oncol. Biol. Phys. 70(4), 1002–1010 (2008).
- Yuan W, Holland SK, Jones BV, Crone K, Mangano FT: Characterization of abnormal diffusion properties of supratentorial brain tumors: a preliminary diffusion tensor imaging study. J. Neurosurg. Pediatr. 1(4), 263–269 (2008).
- Green HA, Peña A, Price CJ et al.: Increased anisotropy in acute stroke: a possible explanation. Stroke 33(6), 1517–1521 (2002).
- Price SJ, Peña A, Burnet NG et al.: Tissue signature characterisation of diffusion tensor abnormalities in cerebral gliomas. Eur. Radiol. 14(10), 1909–1917 (2004).
- Lu S, Ahn D, Johnson G, Law M, Zagzag D, Grossman RI: Diffusion-tensor MR imaging of intracranial neoplasia and associated peritumoral edema: introduction of the tumor infiltration index. Radiology 232(1), 221–228 (2004).
- Roberts TP, Liu F, Kassner A, Mori S, Guha A: Fiber density index correlates with reduced fractional anisotropy in white matter of patients with glioblastoma. AJNR Am. J. Neuroradiol. 26(9), 2183–2186, discussion: 2168–2169 (2005).
- Yen PS, Teo BT, Chiu CH, Chen SC, Chiu TL, Su CF: White matter tract involvement in brain tumors: a diffusion tensor imaging analysis. Surg. Neurol. (2009) (Epub ahead of print).
- Ebisu T, Tanaka C, Umeda M et al.: Discrimination of brain abscess from necrotic or cystic tumors by diffusion-weighted echo planar imaging. Magn. Reson. Imaging 14(9), 1113–1116 (1996).
- Okamoto K, Ito J, Ishikawa K, Sakai K, Tokiguchi S: Diffusion-weighted echo-planar MR imaging in differential diagnosis of brain tumors and tumor-like conditions. Eur. Radiol. 10(8), 1342–1350 (2000).
- Dutt SN, Mirza S, Chavda SV, Irving RM: Radiologic differentiation of intracranial epidermoids from arachnoid cysts. Otol. Neurotol. 23(1), 84–92 (2002).
- Camacho DL, Smith JK, Castillo M: Differentiation of toxoplasmosis and lymphoma in AIDS patients by using apparent diffusion coefficients. AJNR Am. J. Neuroradiol. 24(4), 633–637 (2003).
- Tsui EY, Chan JH, Cheung YK, Lai KF, Fong D, Ng SH: Evaluation of cerebral abscesses by diffusion-weighted MR imaging and MR spectroscopy. Comput. Med. Imaging Graph. 26(5), 347–351 (2002).
- Hein PA, Eskey CJ, Dunn JF, Hug EB: Diffusion-weighted imaging in the follow-up of treated high-grade gliomas: tumor recurrence versus radiation injury. AJNR Am. J. Neuroradiol. 25(2), 201–209 (2004).
- Asao C, Korogi Y, Kitajima M et al.: Diffusion-weighted imaging of radiationinduced brain injury for differentiation from tumor recurrence. AJNR Am. J. Neuroradiol. 26(6), 1455–1460 (2005).
- Guo WY: Is current imaging good enough to differentiate radiation-induced brain injury from tumor recurrence? AJNR Am. J. Neuroradiol. 26(6), 1305 (2005).
- Brunberg JA, Chenevert TL, McKeever PE et al.: In vivo MR determination of water diffusion coefficients and diffusion anisotropy: correlation with structural alteration in gliomas of the cerebral hemispheres. AJNR Am. J. Neuroradiol. 16(2), 361–371 (1995); erratum in AJNR Am. J. Neuroradiol. 16(6), 1384 (1995).
- Stadnik TW, Chaskis C, Michotte A et al.: Diffusion-weighted MR imaging of intracerebral masses: comparison with conventional MR imaging and histologic findings. AJNR Am. J. Neuroradiol. 22(5), 969–976 (2001).
- Sugahara T, Korogi Y, Kochi M et al.: Usefulness of diffusion-weighted MRI with echo-planar technique in the evaluation of cellularity in gliomas. J. Magn. Reson. Imaging 9(1), 53–60 (1999).
- Kono K, Inoue Y, Nakayama K et al.: The role of diffusion-weighted imaging in patients with brain tumors. AJNR Am. J. Neuroradiol. 22(6), 1081–1088 (2001).
- Sinha S, Bastin ME, Whittle IR, Wardlaw JM: Diffusion tensor MR imaging of high-grade cerebral gliomas. AJNR Am. J. Neuroradiol. 23(4), 520–527 (2002).
- Sadeghi N, Camby I, Goldman S et al.: Effect of hydrophilic components of the extracellular matrix on quantifiable diffusion-weighted imaging of human gliomas: preliminary results of correlating apparent diffusion coefficient values and hyaluronan expression level. AJR Am. J. Roentgenol. 181(1), 235–241 (2003).
- Bulakbasi N, Kocaoglu M, Ors F, Tayfun C, Ucoz T: Combination of single-voxel proton MR spectroscopy and apparent diffusion coefficient calculation in the evaluation of common brain tumors. AJNR Am. J. Neuroradiol. 24(2), 225–233 (2003).
- Bulakbasi N, Guvenc I, Onguru O, Erdogan E, Tayfun C, Ucoz T: The added value of the apparent diffusion coefficient calculation to magnetic resonance imaging in the differentiation and grading of malignant brain tumors. J. Comput. Assist. Tomogr. 28(6), 735–746 (2004).
- Lee EJ, Lee SK, Agid R, Bae JM, Keller A, Terbrugge K: Preoperative grading of presumptive low-grade astrocytomas on MR imaging: diagnostic value of minimum apparent diffusion coefficient. AJNR Am. J. Neuroradiol. 29(10), 1872–1877 (2008).
- Kitis O, Altay H, Calli C, Yunten N, Akalin T, Yurtseven T: Minimum apparent diffusion coefficients in the evaluation of brain tumors. Eur. J. Radiol. 55(3), 393–400 (2005).
- Vargova L, Homola A, Zamecnik J, Tichy M, Benes V, Sykova E: Diffusion parameters of the extracellular space in human gliomas. Glia 42(1), 77–88 (2003).
- Morita K, Matsuzawa H, Fujii Y, Tanaka R, Kwee IL, Nakada T: Diffusion tensor analysis of peritumoral edema using lambda chart analysis indicative of the heterogeneity of the microstructure within edema. J. Neurosurg. 102(2), 336–341 (2005).
- Chenevert TL, Stegman LD, Taylor JM et al.: Diffusion magnetic resonance imaging: an early surrogate marker of therapeutic efficacy in brain tumors. J. Natl Cancer Inst. 92(24), 2029–2036 (2000).
- Ross BD, Moffat BA, Lawrence TS et al.: Evaluation of cancer therapy using diffusion magnetic resonance imaging. Mol. Cancer Ther. 2(6), 581–587 (2003).
- Stadlbauer A, Ganslandt O, Buslei R et al.: Gliomas: histopathologic evaluation of changes in directionality and magnitude of water diffusion at diffusion-tensor MR imaging. Radiology 240(3), 803–810 (2006).
- Goebell E, Paustenbach S, Vaeterlein O et al.: Low-grade and anaplastic gliomas: differences in architecture evaluated with diffusiontensor MR imaging. Radiology 239(1), 217–222 (2006).
- Tropine A, Vucurevic G, Delani P et al.: Contribution of diffusion tensor imaging to delineation of gliomas and glioblastomas. J. Magn. Reson. Imaging 20(6), 905–912 (2004).
- Nilsson D, Rutka JT, Snead OC 3rd, Raybaud CR, Widjaja E: Preserved structural integrity of white matter adjacent to low-grade tumors. Childs Nerv. Syst. 24(3), 313–320 (2008).
- Goebell E, Fiehler J, Ding XQ et al.: Disarrangement of fiber tracts and decline of neuronal density correlate in glioma patients: a combined diffusion tensor imaging and 1H-MR spectroscopy study. AJNR Am. J. Neuroradiol. 27(7), 1426–1431 (2006).
- Basser PJ: Inferring microstructural features and the physiological state of tissues from diffusion-weighted images. NMR Biomed. 8(7–8), 333–344 (1995).
- Lori NF, Akbudak E, Shimony JS et al.: Diffusion tensor fiber tracking of human brain connectivity: acquisition methods, reliability analysis and biological results. NMR Biomed. 15(7–8), 494–515 (2002).
- Field AS, Alexander AL, Wu YC, Hasan KM, Witwer B, Badie B: Diffusion tensor eigenvector directional color imaging patterns in the evaluation of cerebral white matter tracts altered by tumor. J. Magn. Reson. Imaging 20(4), 555–562 (2004).
- Field AS: Diffusion tensor imaging at the crossroads: fiber tracking meets tissue characterization in brain tumors. AJNR Am. J. Neuroradiol. 26(9), 2168–2169 (2005).
- Helton KJ, Phillips NS, Khan RB et al.: Diffusion tensor imaging of tract involvement in children with pontine tumors. AJNR Am. J. Neuroradiol. 27(4), 786–793 (2006).
- Ferda J, Kastner J, Mukenšnabl P et al.: Diffusion tensor magnetic resonance imaging of glial brain tumors. Eur. J. Radiol. (2009) (Epub ahead of print).
- Lu S, Ahn D, Johnson G, Cha S: Peritumoral diffusion tensor imaging of high-grade gliomas and metastatic brain tumors. AJNR Am. J. Neuroradiol. 24(5), 937–941 (2003).
- Price SJ, Jena R, Burnet NG et al.: Improved delineation of glioma margins and regions of infiltration with the use of diffusion tensor imaging: an image-guided biopsy study. AJNR Am. J. Neuroradiol. 27(9), 1969–1974 (2006).
- Tsuchiya K, Fujikawa A, Nakajima M, Honya K: Differentiation between solitary brain metastasis and high-grade glioma by diffusion tensor imaging. Br. J. Radiol. 78(930), 533–537 (2005).
- Provenzale JM, McGraw P, Mhatre P, Guo AC, Delong D: Peritumoral brain regions in gliomas and meningiomas: investigation with isotropic diffusionweighted MR imaging and diffusion-tensor MR imaging. Radiology 232(2), 451–460 (2004).
- Bulakbasi N, Kocaoglu M, Sanal TH, Tayfun C: Dysembrioplastic neuroepithelial tumors: Proton MR spectroscopy, diffusion and perfusion characteristics. Neuroradiology 49(10), 805–812 (2007).
- Kocaoglu M, Ors F, Bulakbasi N, Onguru O, Ulutin C, Secer HI: Central neurocytoma: proton MR spectroscopy and diffusion weighted MR imaging findings. Magn. Reson. Imaging 27(3), 434–440 (2008).
- Toh CH, Castillo M, Wong AM et al.: Differentiation between classic and atypical meningiomas with use of diffusion tensor imaging. AJNR Am. J. Neuroradiol. 29(9), 1630–1635 (2008).
- Toh CH, Castillo M, Wong AM et al.: Primary cerebral lymphoma and glioblastoma multiforme: differences in diffusion characteristics evaluated with diffusion tensor imaging. AJNR Am. J. Neuroradiol. 29(3), 471–475 (2008).
- Beppu T, Inoue T, Shibata Y et al.: Measurement of fractional anisotropy using diffusion tensor MRI in supratentorial astrocytic tumors. J. Neurooncol. 63(2), 109–116 (2003).
- Inoue T, Ogasawara K, Beppu T, Ogawa A, Kabasawa H: Diffusion tensor imaging for preoperative evaluation of tumor grade in gliomas. Clin. Neurol. Neurosurg. 107(3), 174–180 (2005).
- Beppu T, Inoue T, Shibata Y et al.: Fractional anisotropy value by diffusion tensor magnetic resonance imaging as a predictor of cell density and proliferation activity of glioblastomas. Surg. Neurol. 63(1), 56–61 (2005).
- Lui YW, Law M, Chacko-Mathew J et al.: Brainstem corticospinal tract diffusion tensor imaging in patients with primary posterior fossa neoplasms stratified by tumor type: a study of association with motor weakness and outcome. Neurosurgery 61(6), 1199–1207; discussion 1207–1208 (2007).
- Helton KJ, Weeks JK, Phillips NS et al.: Diffusion tensor imaging of brainstem tumors: axonal degeneration of motor and sensory tracts. J. Neurosurg. Pediatr. 1(4), 270–276 (2008).
- Chen X, Weigel D, Ganslandt O, Buchfelder M, Nimsky C: Diffusion tensor imaging and white matter tractography in patients with brainstem lesions. Acta Neurochir. (Wien) 149(11), 1117–1131; discussion 1131 (2007).
- Lesniak MS, Klem JM, Weingart J, Carson BS Sr: Surgical outcome following resection of contrast-enhanced pediatric brainstem gliomas. Pediatr. Neurosurg. 39(6), 314–322 (2003).
- Wang S, Kim S, Chawla S et al.: Differentiation between glioblastomas and solitary brain metastases using diffusion tensor imaging. Neuroimage 44(3), 653–660 (2009).
- Wieshmann UC, Symms MR, Parker GJ et al.: Diffusion tensor imaging demonstrates deviation of fibres in normal appearing white matter adjacent to a brain tumour. J. Neurol. Neurosurg. Psychiatry 68(4), 501–503 (2000).
- Holodny AI, Schwartz TH, Ollenschleger M, Liu WC, Schulder M: Tumor involvement of the corticospinal tract: diffusion magnetic resonance tractography with intraoperative correlation. J. Neurosurg. 95(6), 1082 (2001).
- Holodny AI, Ollenschleger MD, Liu WC, Schulder M, Kalnin AJ: Identification of the corticospinal tracts achieved using blood-oxygen-level-dependent and diffusion functional MR imaging in patients with brain tumors. AJNR Am. J. Neuroradiol. 22(1), 83–88 (2001).
- Witwer BP, Moftakhar R, Hasan KM et al.: Diffusion tensor imaging of white matter tracts in patients with cerebral neoplasm. J. Neurosurg. 97(3), 568–575 (2002).
- Möller-Hartmann W, Krings T, Coenen VA et al.: Preoperative assessment of motor cortex and pyramidal tracts in central cavernoma employing functional and diffusion-weighted magnetic resonance imaging. Surg. Neurol. 58(5), 302–307; discussion 308 (2002).
- Coenen VA, Krings T, Axer H et al.: Intraoperative 3D visualization of the pyramidal tract in a neuronavigation system (PTV) reliably predicts true position of principal motor pathways. Surg. Neurol. 60(5), 381–390 (2003).
- Hendler T, Pianka P, Sigal M et al.: Delineating gray and white matter involvement in brain lesions: 3D alignment of functional magnetic resonance and diffusion-tensor imaging. J. Neurosurg. 99(6), 1018–1027 (2003).
- Parmar H, Sitoh YY, Yeo TT: Combined magnetic resonance tractography and functional magnetic resonance imaging in evaluation of brain tumors involving the motor system. J. Comput. Assist. Tomogr. 28(4), 551–556 (2004).
- Laundre BJ, Jellison BJ, Badie B, Alexander AL, Field AS: Diffusion tensor imaging of the corticospinal tract before and after mass resection as correlated with clinical motor findings: preliminary data. AJNR Am. J. Neuroradiol. 26(4), 791–796 (2005).
- Nimsky C, Ganslandt O, Hastreiter P et al.: Preoperative and intraoperative diffusion tensor imaging-based fiber tracking in glioma surgery. Neurosurgery 61(Suppl. 1), 178–185; discussion 186 (2007).
- Nimsky C, Ganslandt O, Fahlbusch R. Implementation of fiber tract navigation. Neurosurgery 61(Suppl. 1), 306–317; discussion 317–318 (2007).
- Clark CA, Barrick TR, Murphy MM, Bell BA: White matter fiber tracking in patients with space-occupying lesions of the brain: a new technique for neurosurgical planning? Neuroimage 20(3), 1601–1608 (2003).
- Wu JS, Zhou LF, Tang WJ et al.: Clinical evaluation and follow-up outcome of diffusion tensor imaging-based functional neuronavigation: a prospective, controlled study in patients with gliomas involving pyramidal tracts. Neurosurgery 61(5), 935–948; discussion 948–949 (2007).
- Bello L, Gambini A, Castellano A et al.: Motor and language DTI fiber tracking combined with intraoperative subcortical mapping for surgical removal of gliomas. Neuroimage 39(1), 369–382 (2008).
- Price SJ, Burnet NG, Donovan T et al.: Diffusion tensor imaging of brain tumours at 3T: a potential tool for assessing white matter tract invasion? Clin. Radiol. 58(6), 455–462 (2003).
- Henry RG, Berman JI, Nagarajan SS, Mukherjee P, Berger MS: Subcortical pathways serving cortical language sites: initial experience with diffusion tensor imaging fiber tracking combined with intraoperative language mapping. Neuroimage 21(2), 616–622 (2004).
- Berman JI, Berger MS, Mukherjee P, Henry RG: Diffusion-tensor imaging guided tracking of fibers of the pyramidal tract combined with intraoperative cortical stimulation mapping in patients with gliomas. J. Neurosurg. 101(1), 66–72 (2004).
- Berman JI, Berger MS, Chung SW, Nagarajan SS, Henry RG: Accuracy of diffusion tensor magnetic resonance imaging tractography assessed using intraoperative subcortical stimulation mapping and magnetic source imaging. J. Neurosurg. 107(3), 488–494 (2007).
- Kleiser R, Staempfli P, Valavanis A, Boesiger P, Kollias S: Impact of fMRI-guided advanced DTI fiber tracking techniques on their clinical applications in patients with brain tumors. Neuroradiology (2009) (Epub ahead of print).
- Smits M, Vernooij MW, Wielopolski PA, Vincent AJ, Houston GC, van der Lugt A: Incorporating functional MR imaging into diffusion tensor tractography in the preoperative assessment of the corticospinal tract in patients with brain tumors. AJNR Am. J. Neuroradiol. 28(7), 1354–1361 (2007).
- Yu CS, Li KC, Xuan Y, Ji XM, Qin W: Diffusion tensor tractography in patients with cerebral tumors: a helpful technique for neurosurgical planning and postoperative assessment. Eur. J. Radiol. 56(2), 197–204 (2005).
- Khong PL, Kwong DL, Chan GC, Sham JS, Chan FL, Ooi GC: Diffusion-tensor imaging for the detection and quantification of treatment-induced white matter injury in children with medulloblastoma: a pilot study. AJNR Am. J. Neuroradiol. 24(4), 734–740 (2003).
- Leung LH, Ooi GC, Kwong DL, Chan GC, Cao G, Khong PL: White-matter diffusion anisotropy after chemo-irradiation: a statistical parametric mapping study and histogram analysis. Neuroimage 21(1), 261–268 (2004).
- Qiu D, Leung LH, Kwong DL, Chan GC, Khong PL: Mapping radiation dose distribution on the fractional anisotropy map: applications in the assessment of treatmentinduced white matter injury. Neuroimage 31(1), 109–115 (2006).
- Qiu D, Kwong DL, Chan GC, Leung LH, Khong PL: Diffusion tensor magnetic resonance imaging finding of discrepant fractional anisotropy between the frontal and parietal lobes after whole-brain irradiation in childhood medulloblastoma survivors: reflection of regional white matter radiosensitivity? Int. J. Radiat. Oncol. Biol. Phys. 69(3), 846–851 (2007).
- Mabbott DJ, Noseworthy MD, Bouffet E, Rockel C, Laughlin S: Diffusion tensor imaging of white matter after cranial radiation in children for medulloblastoma: correlation with IQ. Neurooncology 8(3), 244–252 (2006).
- Welzel T, Niethammer A, Mende U et al.: Diffusion tensor imaging screening of radiation-induced changes in the white matter after prophylactic cranial irradiation of patients with small cell lung cancer: first results of a prospective study. AJNR Am. J. Neuroradiol. 29(2), 379–383 (2008).
- Kashimura H, Inoue T, Beppu T, Ogasawara K, Ogawa A: Diffusion tensor imaging for differentiation of recurrent brain tumor and radiation necrosis after radiotherapy: three case reports. Clin. Neurol. Neurosurg. 109(1), 106–110 (2007).
- Khong PL, Zhou LJ, Ooi GC, Chung BH, Cheung RT, Wong VC: The evaluation of Wallerian degeneration in chronic paediatric middle cerebral artery infarction using diffusion tensor MR imaging. Cerebrovasc. Dis. 18(3), 240–247 (2004).
- Thomalla G, Glauche V, Koch MA, Beaulieu C, Weiller C, Röther J: Diffusion tensor imaging detects early Wallerian degeneration of the pyramidal tract after ischemic stroke. Neuroimage 22(4), 1767–1774 (2004).
- Wakamoto H, Eluvathingal TJ, Makki M, Juhasz C, Chugani HT: Diffusion tensor imaging of the corticospinal tract following cerebral hemispherectomy. J. Child Neurol. 21(7), 566 –571 (2006).
- Wieshmann UC, Symms MR, Clark CA et al.: Wallerian degeneration in the optic radiation after temporal lobectomy demonstrated in vivo with diffusion tensor imaging. Epilepsia 40(8), 1155–1158 (1999).
- Concha L, Gross DW, Wheatley BM, Beaulieu C: Diffusion tensor imaging of time-dependent axonal and myelin degradation after corpus callosotomy in epilepsy patients. Neuroimage 32(3), 1090–1099 (2006).
- Lawes IN, Barrick TR, Murugam V et al.: Atlas-based segmentation of white matter tracts of the human brain using diffusion tensor tractography and comparison with classical dissection. Neuroimage 39(1), 62–79 (2008).
- Dauguet J, Peled S, Berezovskii V et al.: Comparison of fiber tracts derived from in vivo DTI tractography with 3D histological neural tract tracer reconstruction on a macaque brain. Neuroimage 37(2), 530–538 (2007).
- Mori S, Frederiksen K, van Zijl PC et al.: Brain white matter anatomy of tumor patients evaluated with diffusion tensor imaging. Ann. Neurol. 51(3), 377–380 (2002).
- Poupon C, Clark CA, Frouin V et al.: Regularization of diffusion-based direction maps for the tracking of brain white matter fascicles. Neuroimage 12(2), 184–195 (2000).
- Frank LR: Anisotropy in high angular resolution diffusion-weighted MRI. Magn. Reson. Med. 45(6), 935–939 (2001).
- Wedeen VJ, Hagmann P, Tseng WY, Reese TG, Weisskoff RM: Mapping complex tissue architecture with diffusion spectrum magnetic resonance imaging. Magn. Reson. Med. 54(6), 1377–1386 (2005).
- Tuch DS, Reese TG, Wiegell MR, Makris N, Belliveau JW, Wedeen VJ: High angular resolution diffusion imaging reveals intravoxel white matter fiber heterogeneity. Magn. Reson. Med. 48(4), 577–582 (2002).
- Alexander DC, Barker GJ, Arridge SR: Detection and modeling of non-Gaussian apparent diffusion coefficient profiles in human brain data. Magn. Reson. Med. 48(2), 331–340 (2002).
- Frank LR: Characterization of anisotropy in high angular resolution diffusion-weighted MRI. Magn. Reson. Med. 47(6), 1083–1099 (2002).
- Assaf Y, Basser PJ: Composite hindered and restricted model of diffusion (CHARMED) MR imaging of the human brain. Neuroimage 27(1), 48–58 (2005).
- Okada T, Miki Y, Fushimi Y et al.: Diffusiontensor fiber tractography: intraindividual comparison of 3.0-T and 1.5-T MR imaging. Radiology 238(2), 668–678 (2006).
- Alexander AL, Lee JE, Wu YC, Field AS: Comparison of diffusion tensor imaging measurements at 3.0 T versus 1.5 T with and without parallel imaging. Neuroimaging Clin. N. Am. 16(2), 299–309 (2006).
- Stieltjes B, Schlüter M, Didinger B et al.: Diffusion tensor imaging in primary brain tumors: reproducible quantitative analysis of corpus callosum infiltration and contralateral involvement using a probabilistic mixture model. Neuroimage 31(2), 531–542 (2006).
- Hattingen E, Rathert J, Jurcoane A et al.: A standardised evaluation of pre-surgical imaging of the corticospinal tract: where to place the seed ROI. Neurosurg. Rev. 32(4), 445–456 (2009).
- Field AS, Alexander AL: Diffusion tensor imaging in cerebral tumor diagnosis and therapy. Top. Magn. Reson. Imaging 15(5), 315–324 (2004). & Thorough review on current and future applications of DTI in brain tumor diagnosis.
- Wu YC, Field AS, Chung MK, Badie B, Alexander AL: Quantitative analysis of diffusion tensor orientation: theoretical framework. Magn. Reson. Med. 52(2), 1146–1155 (2004).
- Wu YC, Field AS, Alexander AL: Computation of diffusion function measures in q-space using magnetic resonance hybrid diffusion imaging. IEEE Trans. Med. Imaging 27(6), 858–865 (2008).
- Mulkern RV, Haker SJ, Maier SE: On high b diffusion imaging in the human brain: ruminations and experimental insights. Magn. Reson. Imaging 27(8), 1151–1162 (2009).
- Jensen JH, Helpern JA, Ramani A, Lu H, Kaczynski K: Diffusional kurtosis imaging: the quantification of non-gaussian water diffusion by means of magnetic resonance imaging. Magn. Reson. Med. 53(6), 432–440 (2005).
- Bennett KM, Hyde JS, Schmainda KM: Water diffusion heterogeneity index in the human brain is insensitive to the orientation of applied magnetic field gradients. Magn. Reson. Med. 56(2), 235–239 (2006).
- Peled S, Friman O, Jolesz F, Westin CF: Geometrically constrained two-tensor model for crossing tracts in DWI. Magn. Reson. Imaging 24(9), 1263–1270 (2006).
- Anderson AW: Measurement of fiber orientation distributions using high angular resolution diffusion imaging. Magn. Reson. Med. 54(4), 1194 -1206 (2005).
- Behrens TE, Berg HJ, Jbabdi S, Rushworth MF, Woolrich MW: Probabilistic diffusion tractography with multiple fibre orientations: what can we gain? Neuroimage 34(1), 144-155 (2007).
- Jensen JH, Chandra R, Ramani A et al.: Magnetic field correlation imaging. Magn. Reson. Med. 55(6), 1350-1361 (2006).
Websites
- CBTRUS (2009). CBTRUS Statistical Report: Primary Brain and Central Nervous System Tumors Diagnosed in the United States in 2004–2005. Source: Central Brain Tumor Registry of the United States, Hinsdale, IL, USA. www.cbtrus.org
- Horner MJ, Ries LAG, Krapcho M et al.: SEER Cancer Statistics Review, 1975–2006, National Cancer Institute. Bethesda, MD, USA (based on November 2008 SEER data submission, posted to the SEER website, 2009). http://seer.cancer.gov/csr/1975–2006/
- Radiosurgery Practice Guideline Report #5–08. Radiosurgery practice guideline initiative stereotactic radiosurgery for patients with metastatic brain tumors (2008). www.irsa.org/guidelines.html


