Research Article - Neuropsychiatry (2017) Volume 7, Issue 5
Effects of Display Type, Student Population, and Environment on Reading Performance of Mobile Devices
- Corresponding Author:
- Po-Hung Lin
Department of Industrial Engineering & Management
Ming Chi University of Technology, 84 Gungjuan Rd.
Taishan Dist., New Taipei City 24301, Taiwan
Tel: +886-2-2908-9899, ext: 3121
Abstract
This study investigated the effects of display type, student population, and environment on search time, accuracy, workload, change of critical fusion frequency (CFF), and subjective visual fatigue while performing a reading task. Twenty students participated in the experiment, where three types of display (liquid crystal display, electronic paper display, and plain paper), two student populations (junior high school students and college students), and two types of environment (a controlled laboratory and a carriage of a public transit system) were investigated. The results showed that the student populations were significantly different in terms of search time, accuracy, and subjective visual fatigue. The results also showed that the interaction between display type and student population was significant on workload. The reading performance of accuracy for participants in the laboratory was significantly better than that in the public transit system.
Keywords
Display type, Student population, Environment, Reading performance
Introduction
Information technology is ubiquitous nowadays, even in our daily life, with versatile usage contexts and scenarios. As a result, many types of mobile devices have been created to fulfill these needs. For the convenience and portability, consumer electronic products such as cellular phones, personal digital assistants (PDAs), tablet PCs, and devices of specific purposes (reading devices, for example) have been widely used. Roughly categorized by function and screen size, PDAs and cellular phones, having screen sizes about 2 to 5 inches in diagonal, are mainly used for communication and impromptu content consuming. On the other hand, tablet PCs and reading devices, having screen sizes about 7 to 10 inches in diagonal, suit the needs of rich content interaction and basic document processing. The latter group of devices is replacing laptop computers, even desktop PCs, as these mobile devices are becoming more powerful, more convenient, and more affordable. In addition, since these devices have large and crisp screens, they are also suitable for content consuming and, of interest to this research, reading.
In recently years, touch screens have become one of the most popular displays in the market, especially for the devices mentioned above. Although touch screens are known to have some usage drawbacks, such as screen obscuration, induced arm fatigue, reduced brightness, and higher cost [1], they are also favored for the advantages such as easiness to learn, better hand-eye coordination than mice or keyboards, nearly none extra space requirement, and durability.
P.-H. Lin [2] also indicated that a touch screen showed good usability and low workload. Modern touch screens on these mobile devices add one extra element to the equation – glossy surface – mainly for reasons of screen protection and aesthetics. Nevertheless, for reading purpose, the glossy surface reflects the incoming light, causing visual discomfort for the users.
For reading purpose, there are also dedicated reading devices with electronic paper displays, with screen estates similar to those of tablets, but weigh less and consume less power. The paper-like displays are also readable under sunlight, just like conventional paper. Because of the anti-glare surface treatments, which consists of laminating a matte (rough) surface layer used to diffuse the reflected light from external lighting sources, people can use electronic paper displays for prolonged reading. With the rapid advances of display technology, electronic paper has possessed more characteristics of conventional paper, such as the ability to roll or bend, that can enhance reading comfort and experience [3]. Past studies have also investigated the reading performance of electronic paper displays and indicated that surface treatment and bending curvature bring the significant impacts in participants’ reading performance [4-7].
Since paper is still the prevalent method of knowledge dissemination in education, comparisons between conventional paper and electronic displays have been made in previous research work. Most of them indicated that paper is better than e-books and small-sized multimedia displays in terms of reading performance [8,9], of usability [10], and of preference [11]. Reading performance on devices of different displays sizes, ranging from PDA, electronic reading device, and notebook, has also been investigated [12]. However, few studies have investigated the reading performances on similar-sized displays. This study will fill this gap by comparing the reading performance on a paper-based text book, a mobile device with LCD, and a reading device with electronic paper, all of which are of roughly equal screen dimension.
The portability of mobile devices brings about the versatility of usage contexts and scenarios, which in turn renders the ambient environment an important factor affecting reading performance. One of the prominent characteristics of usage contexts on the go is vibration. Vibration environment can make people feel dizzy, tired, and even interrupted. Past studies have showed that people’s visual performance is affected by vibration [13-16]. In vibration environment, frequency increment of whole-body vibration affects the accuracy of number reading [13,14]. C. J. Lin, et al. [15] also concludes that both the frequency and magnitude of vibration have significant effects on the reading performance of LCD displays. With regard to ship motion environment, Wertheim [17] indicates that participants’ perception of small visual detail can be interfered. Yau, et al. [16] have optimized the Chinese interface design parameters in ship motion environment to improve participants’ visual performance. This study focuses on an environment, a public transit system called Mass Rapid Transit (MRT), in which mobile devices are heavily used as a commute pastime.
Studies have also shown that reading performances of users at different ages vary when reading tasks are performed on various mobile devices, such as handheld computers [18], PDAs [19], and devices with electronic paper displays [5]. As we have expected, most of above studies conclude that young people have better reading performance than elder ones. However, most of participants in these researches are young college students. Past studies have also investigated college students’ reading performance on different mobile devices [11,12,20], but detailed investigation of other younger student populations, such as junior high students, is quite limited. With the popularity of mobile devices, younger students are now using mobile devices as text book replacement or alternatives. It is therefore worthy to investigate the reading performance of different student populations while using various mobile devices.
Reading performance between paper and screen can be measured in terms of speed, accuracy, comprehension, fatigue and preference [21]. In this study, searching time, accuracy, change of CFF (i.e. objective visual fatigue), and subjective visual fatigue were used to investigate the reading performance among three displays. In addition, workload for visual performance was also included in this study. In summary, display type, student population, and environment are three critical factors affecting students’ reading performance. The purpose of this study is to assess the effects of these three factors on search time, accuracy, workload, change of CFF, and subjective visual fatigue.
Method
▪ Experimental design
Three independent variables were evaluated in this study: display type, student population and environment. The three display types were liquid crystal display, electronic paper display, and plain paper. Student population was divided into junior high school and college students. The environments were classified into static environment (a controlled laboratory) and motion (a carriage of MRT) ones. Therefore, there were 3 (display type) × 2 (student population) × 2 (environment) combinations. Display type (D) and environment (E) served as within-subject factors, while student population (S) served as a between-subject factor. Each participant had to finish the six treatments and was randomly assigned to each of them.
▪ Participants
Twenty participants, including ten junior high school students (seven males and three females; M=14.5, SD=0.71), and ten college students (eight males and two females; M=21.9, SD=1.1), were recruited. No participant was color blind and all had normal or corrected-to-normal vision.
▪ Apparatus
An OPTEC 2000 vision tester and Standard Pseudo Isochromatic charts were used to test the visual acuity and color vision. The change of CFF value was measured with a LAFAYETTE 12021 Flicker Fusion. Three types of displays were including an Apple iPad 2 (1024×768 pixels, 9.56×7.47×0.5 inch), an Amazon Kindle DX (1200×824 pixels, 10.4×7.2×0.38 inch), and B5 size papers (10.28×7.28 inch). LT Lutron (LX-103) light meter was used to measure the illumination in the laboratory and MRT. A Baqi HK-102A counter was used for participants to record the times when they identified the target letters.
▪ Experimental scenario
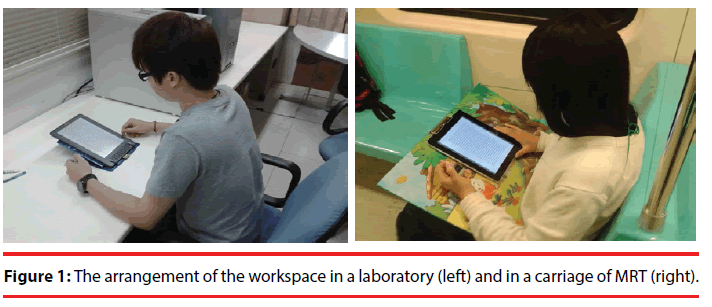
The experiment was conducted in a laboratory and in a carriage of MRT (Figure 1). For the MRT (see the right side of Figure 1), the selected route was from Houshanpi station to Taipei main station in Nangang Line of Taipei Rapid Transit Corporation, whose travel duration was approximately fifteen minutes. To avoid crowdedness, off-peak hours (about 9 to 11 AM and 3 to 5 PM) were used to conduct the experiment. The illumination inside a carriage of MRT Nangang Line was from 150 to 250 lux. The illumination of the laboratory was set at 200 lux in average in order to keep the illumination levels in both environments approximately equal.
▪ Task and procedure
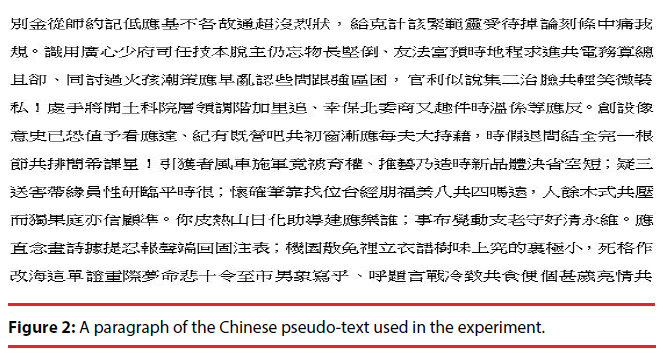
Before the experiment, the participant was asked to complete the basic demographics with five items (Table 1). Then, paragraphs of pseudotext in Chinese were chosen as the experimental materials, which contained 750 frequently used Chinese characters and punctuation marks. These Chinese characters were presented or printed in 12-point font size of New Thin Ming type. The configuration of pseudo-text was arranged in 26 lines per page, with 34 characters per line. There were two pages of pseudo-text in each experimental combination. Each page was randomly selected from 750 frequently usedChinese characters and punctuation marks and was different among each other for avoiding participants’ learning effect. Figure 2 shows the pseudo-text in Chinese used in this experiment.
| No. | Items | Junior high school students | College students |
|---|---|---|---|
| 1 | Sex | 70% Male, 30% Female | 80% Male, 20% Female |
| 2 | Age | Mean=14.5 (S.D.=0.71) | 21.9 (1.1) |
| 3 | How many hours do you need for the reading per day? | ||
| None | 0% | 0% | |
| <1 hour | 10% | 20% | |
| 1~2 hours | 20% | 40% | |
| 2~3 hours | 40% | 30% | |
| >4 hours | 30% | 10% | |
| 4 | How often do you read in a cabinet of MRT? | ||
| None | 0% | 0% | |
| Occasionally | 10% | 20% | |
| Sometimes | 20% | 30% | |
| Usually | 60% | 50% | |
| Always | 10% | 0% | |
| 5 | What is your reading medium when reading in a cabinet of MRT? | ||
| iPad | 0% | 20% | |
| Electronic paper display | 0% | 10% | |
| Paper-based text book | 60% | 10% | |
| Else (own mobile phones) | 40% | 60% |
Table 1: The demographics collected before the experiment.
Three target characters appeared in each page of pseudo-text. To avoid the influence of character complexity, one target character had high complexity (more than 13 strokes, e.g., 應 and 學), another character medium complexity (between 9 strokes and 12 strokes, e.g., 時 and 動), and the other low complexity (less than 8 strokes, e.g., 共 and 以). The target characters were randomly positioned in the pseudo-text, and the total number of target characters in each treatment was the same. Before the experiment, the participant was instructed to conduct a 10-minute pretest (its content did not appear in the formal experiment) for familiarizing the experimental tasks. If participants have the difficulties in reading, they were not allowed to join the experiment. After the experiment, the participant was asked to answer the three questions to share his/her opinion and thought about the experiment. The questions are “Do you think whether different displays/environments have the impact on your reading performance? In what ways?”, and “What do you think about the experiment in general?”
The experiment procedure was as follows:
(1) The visual acuity of the participant was obtained via the vision tester. If the score was lower than 0.8, the participant was excluded from the experiment.
(2) The CFF threshold of a participant was reported twice before each treatment. The CFF value was first adjusted from high to low frequency, and then from low to high frequency. The CFF threshold was the average of these two values.
(3) The participant was asked to scan the text from left to right, from up to down and identified the target Chinese characters as accurately and quickly as possible. Rescanning was not allowed. When the participant identified a target character, he/she pressed the counter once.
(4) The search time and accuracy were recorded after the participant completed each treatment.
(5) The CFF threshold was obtained after each treatment using the same procedure in Step (2). Then, the participant was asked to evaluate workload, and subjective visual fatigue through the questionnaire.
(6) A 10-minute break was given between treatments; Steps (2) to (6) were repeated for all treatments.
(7) The participant was asked to answer the post-experiment questions after finishing all treatments.
▪ Dependent variables and data analysis
Five dependent variables were analyzed: search time, accuracy, workload, change of CFF, and subjective visual fatigue. Search time was defined as the total time for searching the target Chinese characters. Accuracy was a quotient of dividing the accumulated count of target Chinese characters by the total Chinese characters. For workload, the NASA Task Load Index (NASA-TLX), proposed by Hart and Staveland [22]) was used to measure the subjective workload. This commonly used rating scale is based on six independent scales: mental demand, physical demand, temporal demand, performance, effort, and frustration. Participants’ physical visual fatigue was measured by the change of CFF, which was the difference between the CFF thresholds before and after each treatment. The subjective visual fatigue was determined by the questionnaire developed by Heuer, Hollendiek, Kroger, and Romer [23], which contained six items and the participants answered the items on a 10-point scale.
We conducted the analysis of variance (ANOVA) on search time, accuracy, workload, change of CFF, and subjective visual fatigue. The Duncan multiple range test was used to find the significances among the levels of independent variables. All statistical analyses were calculated with the Statistical Products Services Solution (SPSS).
Results
The mean proportion of search time, accuracy, workload, change of CFF, and subjective visual fatigue at each level of the independent variables are shown in Table 2. The ANOVA tables for each dependent variable are shown in Table 3.
| Independent variables | n | Search time (sec) |
Accuracy | Workload | Change of CFF (Hz) | Subjective visual fatigue |
|---|---|---|---|---|---|---|
| Student Population | ||||||
| Junior high school students | 10 | 633.33 | 0.71 | 36.99 | -1.65 | 2.28 |
| College students | 10 | 741.35 | 0.77 | 38.83 | -1.71 | 3.74 |
| Display type | ||||||
| Liquid crystal display | 20 | 690.37 | 0.73 | 37.69 | -1.53 | 3.07 |
| Electronic paper display | 20 | 693.3 | 0.76 | 37.03 | -1.85 | 2.93 |
| Paper | 20 | 678.35 | 0.75 | 39.00 | -1.65 | 3.01 |
| Environment | ||||||
| Laboratory | 20 | 679.73 | 0.76 | 34.38 | -1.89 | 2.84 |
| MRT | 20 | 694.95 | 0.73 | 41.44 | -1.47 | 3.18 |
Table 2: Mean search time, accuracy, workload, change of CFF, and subjective visual fatigue.
| Source | Search time | Accuracy | Workload | Change of CFF | Subjective visual fatigue | |||||
|---|---|---|---|---|---|---|---|---|---|---|
| F | η2 | F | η2 | F | η2 | F | η2 | F | η2 | |
| Within subject | ||||||||||
| Environment (E) | 0.389 | 0.021 | 5.55* | 0.236 | 4.452* | 0.198 | 0.961 | 0.051 | 0.918 | 0.049 |
| E*S | 0.105 | 0.006 | 2.011 | 0.1 | 3.601 | 0.167 | 0.001 | 0.00 | 0.522 | 0.028 |
| Display type (D) | 0.303 | 0.017 | 1.512 | 0.077 | 0.721 | 0.038 | 0.806 | 0.043 | 0.32 | 0.017 |
| D*S | 0.481 | 0.026 | 0.644 | 0.035 | 3.585* | 0.166 | 0.59 | 0.032 | 1.145 | 0.06 |
| E*D | 0.413 | 0.022 | 0.207 | 0.011 | 0.383 | 0.021 | 1.052 | 0.055 | 0.099 | 0.005 |
| E*D*S | 0.909 | 0.048 | 0.865 | 0.046 | 0.697 | 0.037 | 0.081 | 0.004 | 0.047 | 0.003 |
| Between subject | ||||||||||
| Student population (S) | 4.24* | 0.191 | 5.182* | 0.224 | 0.138 | 0.008 | 0.062 | 0.003 | 7.689* | 0.299 |
Table 3: ANOVA results of dependent variables
▪ Search time
The ANOVA results for search time are shown in Table 3 and it indicated that student population (F(1, 18) =4.237, p<0.05) was significant. The mean values of search time for junior high school students and college students were 633.33 and 741.35 seconds, respectively. The junior high school students had significantly better performance on search time than the college students did. However, environment and display type were not significant factors.
▪ Accuracy
The ANOVA results for accuracy are shown in Table 3, which indicates that student population (F(1, 18)=5.182, p<0.05) and environment (F(1, 18)=5.55, p<0.05) were significant. The mean values of accuracy for junior high school students and college students were 0.71 and 0.77 (Table 2), which indicated that college students’ accuracy was significantly better than those of junior high school students. In addition, the mean values of accuracy for laboratory and MRT were 0.76, and 0.73, which also indicated that participants’ accuracy in laboratory was significantly better than in MRT.
▪ Workload
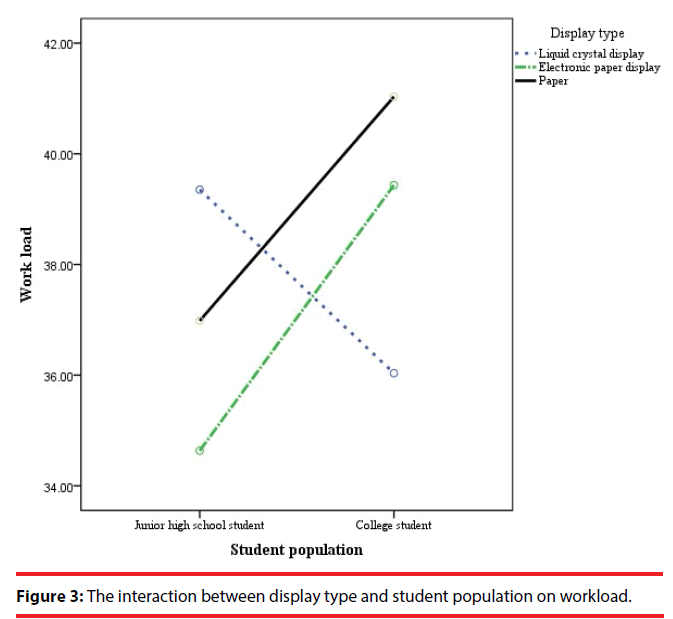
The ANOVA results for workload are shown in Table 3, which indicates that environment (F(1, 18)=4.452, p<0.05) and display type×student population (D × S) interaction (F(2, 36)=3.585, p<0.05) were the significant factors. For D × S interaction, as shown in Figure 3, college students’ highest workload was found in the paper, and then is the electronic paper display, and the last one is the liquid crystal display. However, junior high school students’ highest workload was found in the liquid crystal display. The results also indicated that environment is a significant factor in workload. The mean values of workload for the laboratory and the MRT were 34.38 and 41.44, respectively.
▪ Change of CFF and subjective visual fatigue
The ANOVA results for the change of CFF indicated that none of the independent variables were significant. The ANOVA results for subjective visual fatigue are shown in Table 3 and it indicated that student population (F =7.689, p<0.05) was significant. The mean values of subjective visual fatigue for junior high school students and college students were 2.28 and 3.74.
Discussion
Since some similar results found among dependent variables, we summarized as the overall discussion here. In search time, the results indicated that the junior high school students had significantly better performance than the college students did. However, junior high school students had worse performance than college students did in accuracy and subjective visual fatigue. A possible explanation may be that college students were more mature and could search the Chinese characters in detail and therefore spend longer search time, which resulted in higher accuracy and subjective visual fatigue. Wigfield and Guthrie [24] indicated that fifth graders were less motivated readers than were the fourth graders. Korat [25] concluded that beginner readers have the high reading performance in a comparison between first grade and kindergarten students.
As shown in Table 4, participants’ replies from the third question showed that six out of ten (60%) junior high school students reported that they felt curious about the experiment. In fact, when people are curious about one thing, they may not feel the pressure because they are interested in it. Curiosity is an important element Table 2: Mean search time, accuracy, workload, in reading motivation [24,26,27]. Compared to college students, junior high school students did not have too many opportunities to participate in ergonomic experiment. Besides, curiosity could also be a reason to explain the difference between the change of CFF and subjective visual fatigue. Ideally, subjective visual fatigue is consistent with physical visual fatigue. The results indicated that student population was significant on subjective visual fatigue, but was not significant on the change of CFF. This difference may be explained by the psychological factor of junior high school students, which showed that they were curious about searching task; however, due to the curiosity, they tended to speed up in searching in their mind. Although there is still significant difference on subjective visual fatigue, no significant difference was found on change of CFF due to improved physical visual fatigue from speed up in searching. In general, as shown in Table 2, curiosity could be a possible reason for junior high school students’ short search time, low accuracy, workload, and visual fatigue.
| No. | Question1 | Replies | Question2 | Replies | Replies of Question3 |
|---|---|---|---|---|---|
| 1 | No | No difference | YES | Don’t like to read in a vibration environment | Fresh, interesting and curious experience |
| 2 | YES | I like to read in papers E-display is another good choice |
No | No difference found between the laboratory and MRT | Curious about the e-display |
| 3 | YES | iPad: some reflection affects reading accuracy Paper: excellent E-paper: first time to use it, good! |
YES | Due to the vibration in MRT | Curious, especially for the e-display Willing to do this kind of experiment again next time |
| 4 | No | Can’t feel the difference | YES | Due to the vibration in MRT | No comments |
| 5 | YES | iPad: reflection Paper: comfortable E-paper: good for the reading |
YES | Do not like to read in a moving environment | Curious and interesting |
| 6 | No | Can not tell the difference | YES | Did not feel good in MRT | A little bit tired and difficult |
| 7 | YES | Reading in paper brings the best performance | YES | Due to the vibration in MRT | Interesting experiment Curious about the e-display |
| 8 | YES | iPad: reflection E-paper: curious about this device |
YES | Due to the vibration in MRT | Eye-opening, pleasant and curious |
| 9 | No | Seems all the same | No | MRT is smooth for the reading | It’s hard for me to find the targets |
| 10 | No | Can’t feel the difference | YES | Due to the vibration in MRT | The characters are too small to be read |
Table 4: Summary of the replies from junior high school students.
As shown in Figure 3, for D × S interaction, college students’ the highest workload was found in reading paper, and then is electronic paper display, and the last one is liquid crystal display. This result is not in line with previous study that reading paper or text book brings low visual fatigue [10,28]. The possible reason was that about 150 to 250 lux ambient illumination is not sufficient for the reading no matter in a laboratory or in a carriage of MRT. This range of illumination level is between 100- 150-200 (Category C) and 200-300-500 lux (Category D), where visual tasks are performed occasionally or only suitable for high contrast or large size visual tasks [29]. Because iPad is a self-luminous display, ambient illumination can be increased when people using it and therefore low workload was obtained. The results also can be applied to the electronic paper display and paper. The above argument could be verified from the higher workload of junior high school students found for paper than for electronic paper display. However, junior high school students are having the highest workload in liquid crystal display. A possible explanation may be that they may not have so many chances to use iPads in the daily life as the college students for surfing on the internet, receiving information, and document processing. As shown in Table 1, the last item in demographics also confirmed that the usage of iPad for college students is higher than that for junior high school students. In addition, compared to college students, most junior high school students in Taiwan still use paper-based text books. This phenomenon is in accord with the results from the last item of Table 1, which indicated that 60% junior high school students read paper-based text books in MRT. Those may be the reasons why highest workload was obtained for junior high school students.
In workload and accuracy, the results of ANOVA indicated that environment was significant. The accuracy in the laboratory was better in the MRT and the workload in the laboratory was lower in the MRT because a stable environment was more suitable for people to concentrate on reading tasks. The result of this study was consistent with Newell and Mansfield [30] and Paddan, et al. [28], which indicated that vibration exposure and vibration frequency were significant on NASA-TLX workload scales. For accuracy, Lewis and Griffin [13,14] indicated the accuracy for number reading was affected by vibration. C. J. Lin, et al. [15] further indicated that the frequency and magnitude of vibration had significant effects on accuracy.
Furthermore, display type was not significant in all indexes. Although insignificances were found, we further explore the results from the means. As shown in Table 2, the mean search time for electronic book, liquid crystal display and paper were 693.3, 690.37, and 678.35 seconds, respectively. The reason for the longest search time found in the electronic paper display may be that participants were unfamiliar with it compared to the liquid crystal display (iPad). As shown in Tables 4 and 5, almost half participants reported that they were curious about the electronic paper display since this is the first time for some participants to use it. In addition, it is also reasonable that the shortest search time found in papers since some participants reported from the first question of Tables 4 and 5 that paper is the most comfortable display for the reading. Furthermore, although the time that most people stay in a carriage of MRT was not too short, a possible reason may be that the experimental task is not challenging enough for participants. It was also verified in terms of insignificants of change of CFF and subjective visual fatigue. Although Iwasaki, Kurimot and Noro [31] indicated that the red color CFF is significantly decreasing after working for 15 minutes with CRT display screens, the screens of mobile displays used in this study were only 9 to 11 inches and therefore it is considered that smaller screens could bring more visual fatigue easily. That is why the two pages of pseudo-text were set in each treatment (almost 13 minutes in average per treatment). From the results of this study, it canbe inferred that future studies for reading tasks could be conducted with more target characters or visual loadings so that the effect of display type on change of CFF and subjective visual fatigue could be further investigated.
| No. | Question1 | Replies | Question2 | Replies | Replies of Question3 |
|---|---|---|---|---|---|
| 1 | Maybe/ YES |
Paper is still the most comfortable display | YES | Due to the vibration in MRT | Only two pages and did not feel so tired |
| 2 | YES | iPad is the best Paper is okay and first time to read an e-display |
YES | Laboratory is a stable and suitable placefor the reading | E-display is suitable for the long time reading |
| 3 | YES | Paper: used to it for the reading E-display: first time to use it, good for reading! |
YES | Due to the vibration in MRT | Interesting experiment |
| 4 | YES | iPad:some reflection found in reading Paper: comfortable E-paper: curious about this device |
No | Cant not tell the difference since I used to read in MRT | Curious about the e-display |
| 5 | No | Some reflection found in iPads but it doesn’t affect the reading performance | YES | Due to the vibration in MRT | Conducting an ergonomic experiment is MRT is really fancy |
| 6 | No | Can not tell the difference | No | MRT is okay for the reading | Except for the laboratory and MRT, maybe another environment should be considered |
| 7 | YES | iPad is the best No much difference found between the e-display and paper |
YES | MRT is not a suitable place for the reading | Interesting experiment with the comparison for different displays |
| 8 | No | Can’t tell the difference | YES | Due to the vibration in MRT | Why not reading an article instead of the pseudo-text? |
| 9 | No | Cannot tell the difference | YES | Laboratory is the better place for the reading | Cool experiment |
| 10 | YES | iPads have bright screens and could easily to find the targets E-paper: first time to use it |
No | Reading in MRT is like reading in a laboratory | This experiment is close to our lives Curious about the e-display |
Table 5: Summary of the replies from college students.
Conclusion
The effects of display type, student population and environment on search time, accuracy, workload, change of CFF, and subjective visual fatigue were investigated. The results showed that student population was significant in terms of search time, accuracy, and subjective visual fatigue. Junior high school students may have the better performance than college students in search time and subjective visual fatigue due to their high curiosity. From the discussion of this study and related literature review from curiosity, it also implies that junior high school students may have stronger reading motivation than college ones. The results also indicated that the interaction between display type and student population was significant on workload. Except for junior high school students’ unfamiliarity with the use of iPads, low ambient illumination in a carriage of MRT may be the main reason for the difference in workload. The result was further verified that the participants’ reading accuracy in the laboratory was significantly better than in the MRT.
As described in discussion, more target characters or visual loadings could be considered in future studies to investigate the effect in visual fatigue. In addition, future studies could recruit elementary school or senior high school students as the participants. Other environments, such as reading in cars or buses, could also be considered for future testing scenarios.
References
- Shneiderman B. Touch screens now offer compelling uses. IEEE. Software 8(2), 93-94 (1991).
- Lin PH. Investigation of Chinese text entry performance for mobile display interfaces. Ergonomics 58(1), 107-117 (2015).
- Omodani M. What is electronic paper? The exceptations. SID 04 Digest 35(1), 128-131 (2004).
- Lin PH, Lin YT, Hwang SL, et al. Effects of Anti-glare Surface Treatment, Ambient Illumination and Bending Curvature on Legibility and Visual Fatigue of Electronic papers. Displays 29(1), 25-32 (2008).
- Lin YT, Lin PH, Hwang SL, et al. Surface treatment, reflectance, and age effects on electronic-paper reading performance. J. SID 16(10), 1051-1062 (2008).
- Lin YT, Lin PH, Hwang SL, et al. Ergonomic evaluation of electronic paper: Influences of anti-reflection surface treatment, illumination, and curvature on legibility and visual fatigue. J. SID 16(1), 91-99 (2008).
- Lin YT, Lin PH, Hwang SL, et al. Investigation of legibility and visual fatigue for simulated flexible electronic paper under various surface treatments and ambient illumination conditions. App. Erg 40(2009), 922-928 (2009).
- Kong YK, Lee I, Jung MC, et al. The effects of age, viewing distance, display type, font type, colour contrast and number of syllables on the legibility of Korean characters. Ergonomics 54(5), 453-465 (2011).
- Polonen M, Jarvenpaa T, Hakkinen J. Reading e-books on a near-to-eye display: Comparison between a small-sized multimedia display and a hard copy. Displays 33(3), 157-167 (2012).
- Kang YY, Wang MJJ, Lin RT. Usability evaluation of E-books. Displays 30(2), 49-52 (2009).
- Woody WD, Daniel DB, Baker CA. E-books or textbooks: Students prefer textbooks. Comp. Educ 55(3), 945-948 (2010).
- Wu HC, Lee CL, Lin CT. Ergonomic evaluation of three popular Chinese e-book displays for prolonged reading. Int. J. Ind. Erg 37(1), 761-770 (2007).
- Lewis CH, Griffin MJ. Effect of character size on the legibility of numeric displays during vertical whole-body vibration. J. Sound. Vib 67(4), 562-565 (1979).
- Lewis CH, Griffin MJ. Predicting the effects of vertical vibration frequency, combinations of frequencies and viewing distance on the reading of numeric displays. Ergonomics 23(5), 485-499 (1980).
- Lin CJ, Hsieh YH, Chen HC, et al.Visual performance and fatigue in reading vibrating numeric displays. Displays 29(4), 386-392 (2008).
- Yau Y, Chao C, Hwang S. Optimization of Chinese interface design in motion environments. Displays 29(3), 308-315 (2008).
- Wertheim AH. Working in a moving environment. Ergonomics 41(12), 1845-1858 (1998).
- Darroch I, Goodman J, Brewster S, et al. The Effect of Age and Font Size on Reading Text on Handheld Computers. Lect. Notes. Comp. Sci 3585(1), 253-266 (2005).
- Arning K, Ziefle M. Understanding age differences in PDA acceptance and performance. Comp. Human. Beh 23(6), 2904-2927 (2007).
- Ho SY, Chang HL. Comparisons of performance among three different mobile reading devices, e.g. note-book, e-book, and PDA. J. Hwa. Kang. Print. Transmission: Management of Print Transmission 36(1), 85-97 (2005).
- Dillon A. Designing usable electronic text (second ed.). London: Taylor and Francis (2004).
- Hart SG, Staveland L. Development of NASA-TLX (Task Load Index): results of empirical and theoretical research. Amsterdam: Elsevier (1988).
- Heuer H, Hollendiek G, Kroger H, et al. The resting position of the eyes and their influence on observation data and visual fatigue during screen work. Z. Exp. Angew. Psychol 36(4), 538-566 (1989).
- Wigfield A, Guthrie JT. Relations of children's motivation for reading to the amount and breadth of their reading. J. Educ. Psychol 89(3), 420-432 (1997).
- Korat O. Reading electronic books as a support for vocabulary, story comprehension and word reading in kindergarten and first grade. Comp. Educ 55(1), 24-31 (2010).
- Lin D, Wong KK, McBride-Chang C. Reading motivation and reading comprehension in Chinese and English among bilingual students. Reading and Writing 25(3), 717-737 (2012).
- Wigfield A, Guthrie JT, McGough K. A questionnaire measure of children' s motivations for reading. Athens, GA: NRRC, Universities of Georgia and Maryland College Park (1996).
- Paddan GS, Mansfield NJ, Arrowsmith CI, et al. The influence of seat backrest angle on perceived discomfort during exposure to vertical whole-body vibration. Ergonomics 55(8), 923-936 (2012).
- Kaufman JE, Christensen JF. IES Lighting Handbook. New York: Illuminating Engineering Society of North America (1984).
- Newell GS, Mansfield NJ. Evaluation of reaction time performance and subjective workload during whole-body vibration exposure while seated in upright and twisted postures with and without armrests. Int. J. Ind. Erg 38(5-6), 499-508 (2008).
- Iwasaki T, Kurimot S, Noro K. The change in colour flicker fusion (CFF) values and accommodaction time during experimental repetitive tasks with CRT display screens. Ergonomics32(3), 293-305 (1989).
