Research Article - Neuropsychiatry (2018) Volume 8, Issue 6
Effects of Yoga on Thalamic Gamma-Aminobutyric Acid, Mood and Depression: Analysis of Two Randomized Controlled Trials
- *Corresponding Author:
- Chris C. Streeter
Department of Psychiatry, Boston University School of Medicine, Boston, MA 02118, USA
Tel: 617-638-8046
Abstract
Objective:
The Vagal-Gamma-Aminobutyric Acid (GABA) theory proposes that some yoga postures and breathing practices exert their effects through stimulation of vagal nerves (parasympathetic system) with associated brain GABA increases. To evaluate this theory, we compared results from a 12-week randomized controlled trial (RCT) of yoga in participants with Major Depressive Disorder (MDD) with those of a similar RCT in healthy control participants (HC).
Methods:
In an RCT, magnetic resonance spectroscopy (MRS) and mood measures were acquired in subjects with MDD (n=15) prior to and following a 12-week yoga intervention. The same measures were obtained in the HC (n=17) group. In both studies, thalamic GABA/Creatine was obtained using MEGAPRESS at 4 Telsa at baseline (Scan-1), post-intervention (Scan-2), and immediately following a yoga session (Scan-3). Clinical scales were completed prior to each scan.
Results:
The MDD-group had significantly lower GABA compared to the HC at baseline (Scan-1, p=0.001), but not after 12 weeks of yoga, either before (Scan-2, p=0.12) or after a yoga session (Scan-3, p=0.20). Depressive symptoms decreased significantly in the MDD-group (p=0.0001), and anxiety improved in both groups.
Conclusion:
After a 12-week yoga intervention, MDD-group mood and anxiety measures improved with scores equivalent to those of non-depressed individuals. This study provides the first evidence of brain GABA increases associated with specific yoga postures and breathing practices in MDD. These results suggest potential benefits of specific yoga postures and breathing practices as monotherapy or augmentation to other treatments to reduce anxiety and depression in MDD.
Keywords
Depression, HRV, Vagal, Parasympathetic, GABA, MRS, Coherent breathing
Introduction
The World Health Organization Global Burden of Disease study estimated that depression is the single most burdensome illness during the middle years of life
a) Lifetime prevalence for MDD (16.5%) and Anxiety Disorders (28.8%) are high, as is their co-morbidity
b) A Transdiagnostic approach takes into account the involvement of common pathological processes in the genesis and maintenance of depression and anxiety [1-3]. In randomized controlled trials (RCTs) of antidepressants in Major Depressive Disorder (MDD), 40 to 50% of subjects fail to achieve remission. Furthermore, residual symptoms are associated with increased risks for recurrence and relapse [4,5]. Data from RCTs show benefits of yoga-based practices, which include postures (asanas), breathing (pranayama), concentration (dharana) and meditation (dyharana) [6], for the treatment of depression [7,8]. Prior studies support the use of yoga-based interventions as adjunctive treatment for MDD [9-12].
Gamma-Aminobutyric Acid (GABA), the primary human inhibitory neurotransmitter, is essential for emotion regulation [13,14]. The Vagal-GABA Theory supports a new treatment approach for MDD via correction of Autonomic Nervous System imbalances (underactive Parasympathetic Nervous System and overactive Sympathetic Nervous System). Also, MDD is associated with low brain GABA levels, measured using magnetic resonance spectroscopy (MRS) [15,16]. Yoga-based practices are associated with increased parasympathetic activity, measured by increased heart rate variability (HRV) [17-22], increased in vivo brain GABA levels [13,23,24], and decreased symptoms of depression and anxiety [25]. The presence of low parasympathetic and GABA activity in both MDD and anxiety disorders suggests shared physiological abnormalities [13]. These findings provide supporting evidence for mechanisms whereby yoga-based interventions reduce symptoms of MDD and anxiety. Moreover, these mechanisms are consistent with the Vagal- GABA Theory, which supports a transdiagnostic conceptualization of disorders with low parasympathetic and GABAergic activity.
By correcting under activity in parasympathetic and GABA systems, yoga-based practices may complement conventional antidepressants, whose benefits have been attributed to effects on monoamine systems (serotonin, norepinephrine, and dopamine). The vagus nerves contain peripheral parasympathetic pathways. Electronic vagal nerve stimulation (VNS), a Federal Drug Agency (FDA) approved treatment for MDD is associated with increases in brain GABA [13,26]. Vagal-GABA Theory and VNS both support the hypothesis that increased parasympathetic activity is associated with increased GABA and improved mood. By stimulating vagal nerve afferents, yoga-based practices may engage a potentially valuable (bottom-up) mechanism for treating MDD [27,28].
While there is a substantially expanding literature on the effects of yoga-based interventions for the treatment of depression, this study makes novel and substantial contributions by providing evidence of non-invasively measured changes in brain biochemistry prior to and after completion of a manualized yoga-based intervention. Specifically, brain GABA levels were measured in the thalamus, a deep gray matter structure chosen based on established connections to regions associated with mood regulation and which receives projections from the nucleus tractus solitarius, the primary brain stem nucleus that receives afferent input from the vagal nerve [29]. Furthermore, GABA spectral data were acquired at high field (4.0 Tesla, which provides excellent spatial and spectral resolution) using a gold-standard spectral editing technique, MEGAPRESS [30]. GABA data were examined relative to mood and anxiety measures. An additional, unique contribution of this study is the comparison of the robust neurochemistry, and mood and anxiety measures obtained from a cohort of individuals with MDD data from a healthy comparison (HC), non-depressed sample before and after a 12-week yoga intervention. The following hypotheses were evaluated: at baseline prior to the intervention the MDD-group would have lower GABA levels than HC; over the 12-week intervention MDDgroup GABA levels would increase towards HC GABA levels; MDD-group mood and anxiety scales would be worse at baseline; and over the 12-week intervention, MDD-group mood and anxiety scales would improve towards those of HC.
Thus, results from this study will help advance the field by testing the hypothesis that yogabased interventions are not only associated with decreases in depressive and anxiety symptoms, as previously reported, but with a concomitant increase in thalamic GABA levels. These observations provide a biological, translational framework through which yoga-based practices can be used to better understand the mechanism underlying associated improvements in mood and decreases in depressive and anxiety related symptoms.
Materials and Methods
▪ Participants
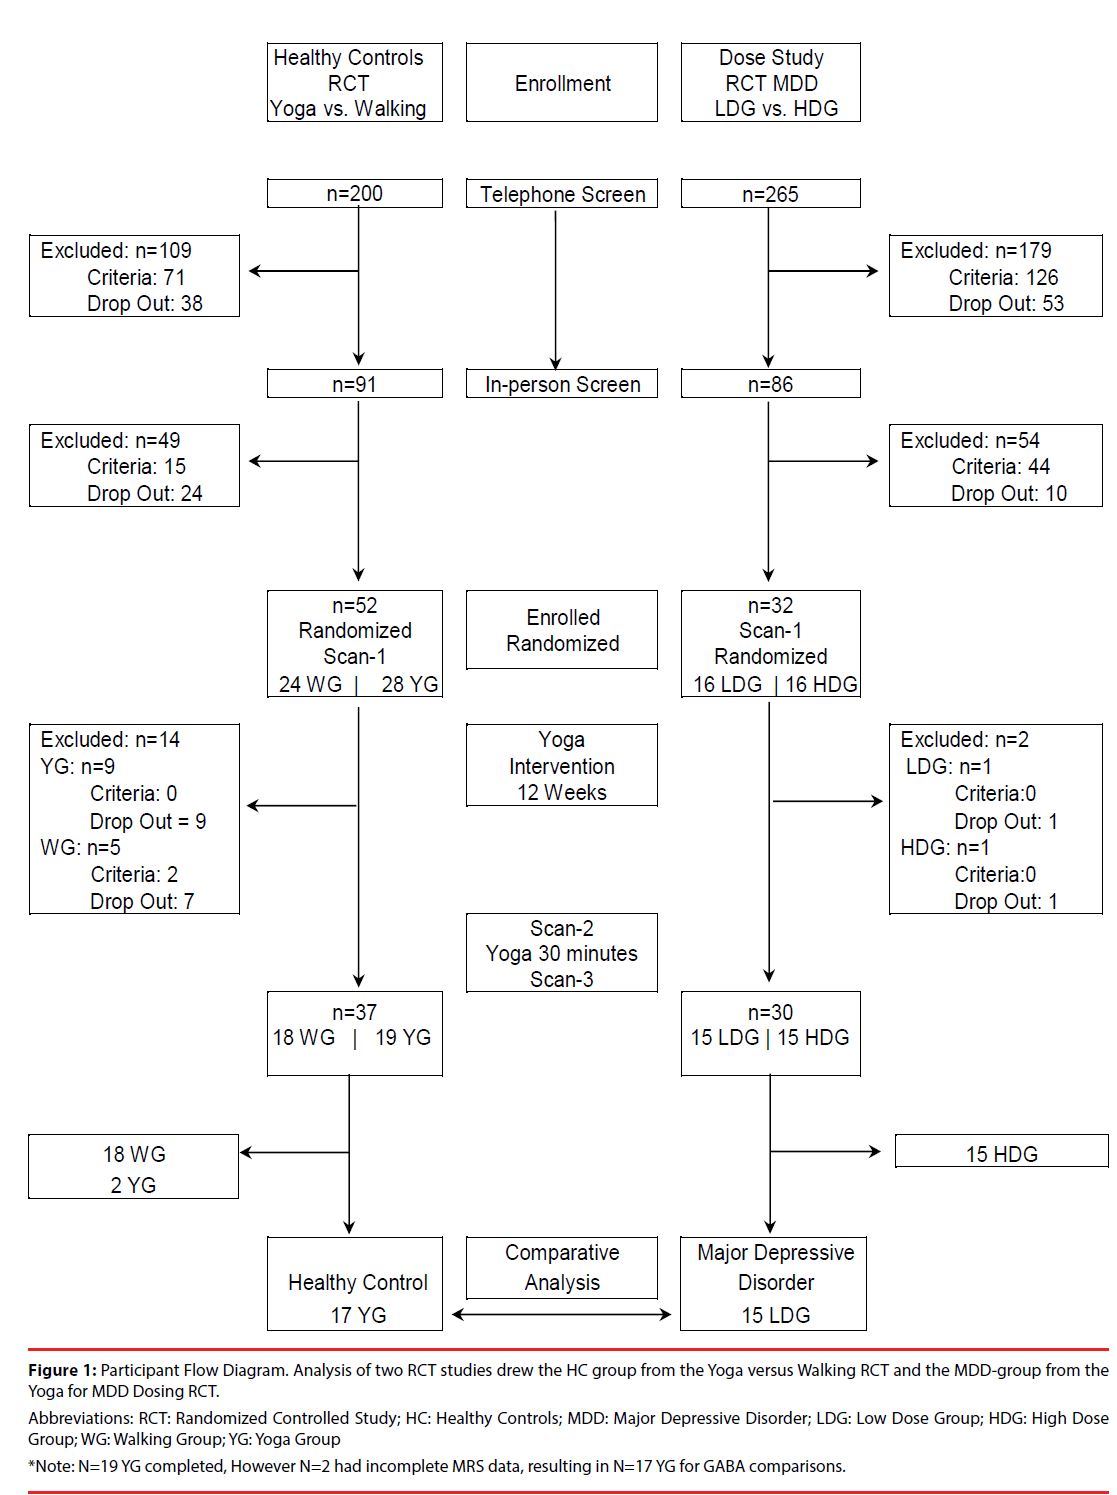
This study compares the same outcome measures from two separate cohorts, MDD and HC, acquired in two separate studies. The RCT comparing yoga with walking provided a yoga cohort of 17 HC (9 females) who completed the intervention and three MRS scans between 2007- 2009 [24]. The RCT of MDD was completed between 2013-2015, using the same manualized yoga postures intervention, the same data collection time course and the same 4.0 Tesla scanner and methods for spectral acquisition, processing, and analysis [25]. The RCT of MDD included two yoga groups: a high dose group (n=15, 13 female) and a low dose group (n=15, 12 female). The low dose group served as the MDD-group in this analysis because the low dose group yoga posture dose was equivalent to the yoga posture dose for HC (see Supplement). Participants for both RCTs were recruited from the community via Internet, newspaper ads and flyers. The Boston University Medical Center (BUMC) Campus Institutional Review Board approved both research protocols. All participants received complete study description and provided written informed consent. See the Participant Flow Diagram (Figure 1).
Figure 1: Participant Flow Diagram. Analysis of two RCT studies drew the HC group from the Yoga versus Walking RCT and the MDD-group from the Yoga for MDD Dosing RCT.
Abbreviations: RCT: Randomized Controlled Study; HC: Healthy Controls; MDD: Major Depressive Disorder; LDG: Low Dose Group; HDG: High Dose Group; WG: Walking Group; YG: Yoga Group *Note: N=19 YG completed, However N=2 had incomplete MRS data, resulting in N=17 YG for GABA comparisons.
In summary, inclusion and exclusion criteria were similar across groups, except that the HC did not meet criteria for MDD, while the MDDgroup met current diagnostic criteria for MDD, determined by the Structured Clinical Interview for DSM-IV [31] and Beck Depression Inventory- II (BDI-II) score ≥ 14 at screening [32]. Of the 15 participants with MDD, 5 also met criteria for Post-Traumatic Stress Disorder (PTSD) (2 current, 3 partial/full remission), 2 met criteria for Panic Disorder in partial remission; 2 met criteria for Alcohol Abuse, and 2 met criteria for Alcohol Dependence (all in remission). One female participant in the MDD group was on a stable dose of the antidepressant venlafaxine (150 mg), a serotonin-norepinephrine reuptake inhibitor (SNRI). Full descriptions of inclusion and exclusion criteria are detailed below.
▪ Inclusion and exclusion criteria: healthy control (HC) group
Inclusion Criteria for HC-group included: ages 18-45 years old; no current Axis-I diagnosis; nonpsychoactive medications allowed if participants had been on a stable dose for at least 1 month with no anticipated changes during the study. The following items were exclusionary for the HC-group: any yoga practice in the previous 3 months or a lifetime history of one yoga session/ week for ≥ 4 weeks; current participation in psychotherapy, prayer groups, or any mind-body disciplines; a neurological disorder or medical condition that would compromise subject safety or scan data; treatment within the previous 3 months with medications that might affect the GABA system; use of tobacco products (known to affect GABA levels); alcohol consumption of >4 drinks/day in the past 90 days (known to effect GABA levels); contraindications for magnetic resonance evaluation; and inability to complete the study or behavior that would compromise study integrity.
▪ Inclusion and exclusion criteria: MDD group
Inclusion criteria for the MDD-group included: ages 18 to 65 years old; current diagnosis of MDD determined by Structured Clinical Interview for DSM-IV; BDI-II score ≥ 14 at screening (at least mild depression); co-morbid anxiety disorder(s) were allowed if they would not interfere with study participation; a stable dose (no change in the amount) of antidepressants for at least three months prior to screen and no dosing changes were anticipated during the study. Exclusionary criteria for the MDD-group were the same as the HC with the following exceptions due mostly to the exclusion of all current Axis I disorders in the HC: bipolar illness; history of psychosis; suicide attempt in the last year or suicidal ideation with intent within the last year; and current alcohol or substance abuse or dependence. Mood stabilizers were excluded due to potential effects on GABA levels. Exclusion based on prior yoga/ mind-body practice was >6 one-hour mind-body practices over the past 6 months prior to study participation.
▪ Study protocol
Both studies were conducted at BUMC, and MRS data were acquired in the Brain Imaging Center at McLean Hospital (Belmont, MA). In both RCTs, participants completed similar 12-week yoga postures protocols [24,25]. In addition to yoga postures, the protocol for the MDD group included coherent breathing. For the purposes of this report, the term yoga refers to postures or postures and coherent breathing practices. Both studies used CONSORT guidelines, promoting high quality RCTs that allow comparisons between studies [33]. See Supplementary Material for randomization codes, random allocation sequence, intervention assignment, blinding, and CONSORT Checklist.
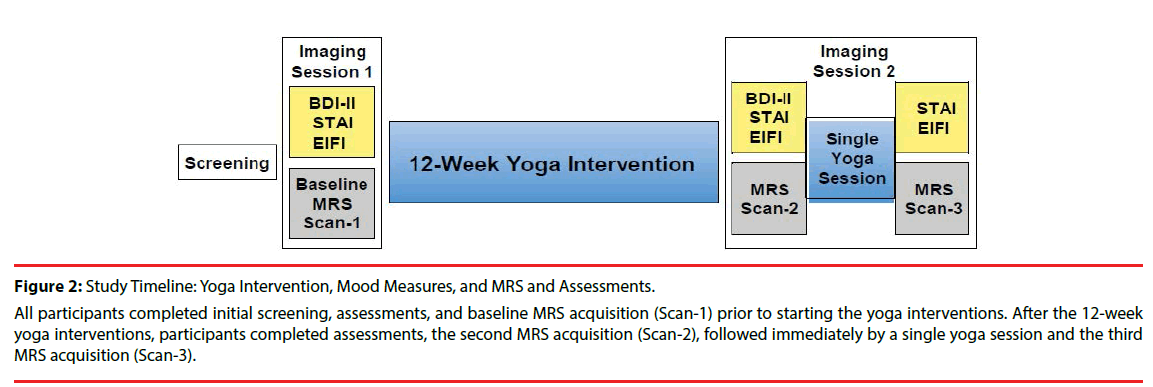
All participants completed initial screening and three MRS brain-imaging sessions. The first MRS acquisition (Scan-1) was conducted at baseline, prior to the onset of the yoga intervention. After completion of the 12-week yoga intervention, two subsequent MRS acquisitions (Scan-2 and Scan-3) and a yoga intervention between Scan 2 and Scan 3 were completed on the same day at the Brain Imaging Center. Scan-2 was acquired before a yoga session and Scan-3 was acquired immediately after the yoga session (Figure 2). Groups did not differ significantly in the length of time between Scan-1 and Scan-2/Scan-3, 15.6 ± 3.1 weeks for the HC-group and 14.1 ± 1.3 weeks for the MDD group. The time (number of days) between the last yoga intervention and Scan-2/Scan-3 was 7.1 ± 1.8 days for the MDDgroup; this information was not available for the HC group.
Figure 2: Study Timeline: Yoga Intervention, Mood Measures, and MRS and Assessments.
All participants completed initial screening, assessments, and baseline MRS acquisition (Scan-1) prior to starting the yoga interventions. After the 12-week yoga interventions, participants completed assessments, the second MRS acquisition (Scan-2), followed immediately by a single yoga session and the third MRS acquisition (Scan-3).
Menstrual cycle hormones affect brain GABA levels [34,35]. Thus, females were scanned during the non-luteal stage of the menstrual cycle when progesterone levels were low and stable, confirmed by serum progesterone level <0.3 ng/ ml, drawn several days prior to scanning.
▪ 12-Week interventions
All participants completed 60-min Iyengar yoga sessions, including backbends and inversions, postures considered beneficial for treating depression, and savasana (deep relaxation while lying supine). In addition to the 60-min yoga. intervention, the MDD-group completed a 10- min transition and 20-min coherent breathing exercise at 5 breaths per minute with equal inhalation and exhalation, guided by audio compact disc (high tone for inhalation and low tone for exhalation) [36-38]. The yoga sessions between Scan-2 and Scan-3 were the same as a class session for each group. Study intervention details have been previously published [24,25].
The HC group was assigned three 60-min classes plus 60-min of homework each week [24]. The MDD-group was assigned to two 90-min classes and three 30-min homework assignments per week. Homework consisted of 15-min of yoga postures and 15-min of coherent breathing. There were no significant differences in the total number of yoga classes or posture time between the HC yoga group and the MDD low dose group. This analysis compares data from HCcohort and the MDD-group.
▪ Assessment of mood and depressive symptoms
BDI-II scores, representing depressive symptoms within the prior two weeks, were acquired at screening and before Scan-1 and Scan-3 [32]. Current mood was assessed prior to each scan by Spielberg State-Trait Anxiety Inventory State (STAI-State) [39] and Exercise-Induced Feeling Inventory (EIFI) [40] with four subscales: Tranquility, Positive Engagement, Revitalization, and Physical Exhaustion.
▪ Magnetic resonance imaging (MRI)/ Magnetic resonance spectroscopy (MRS)
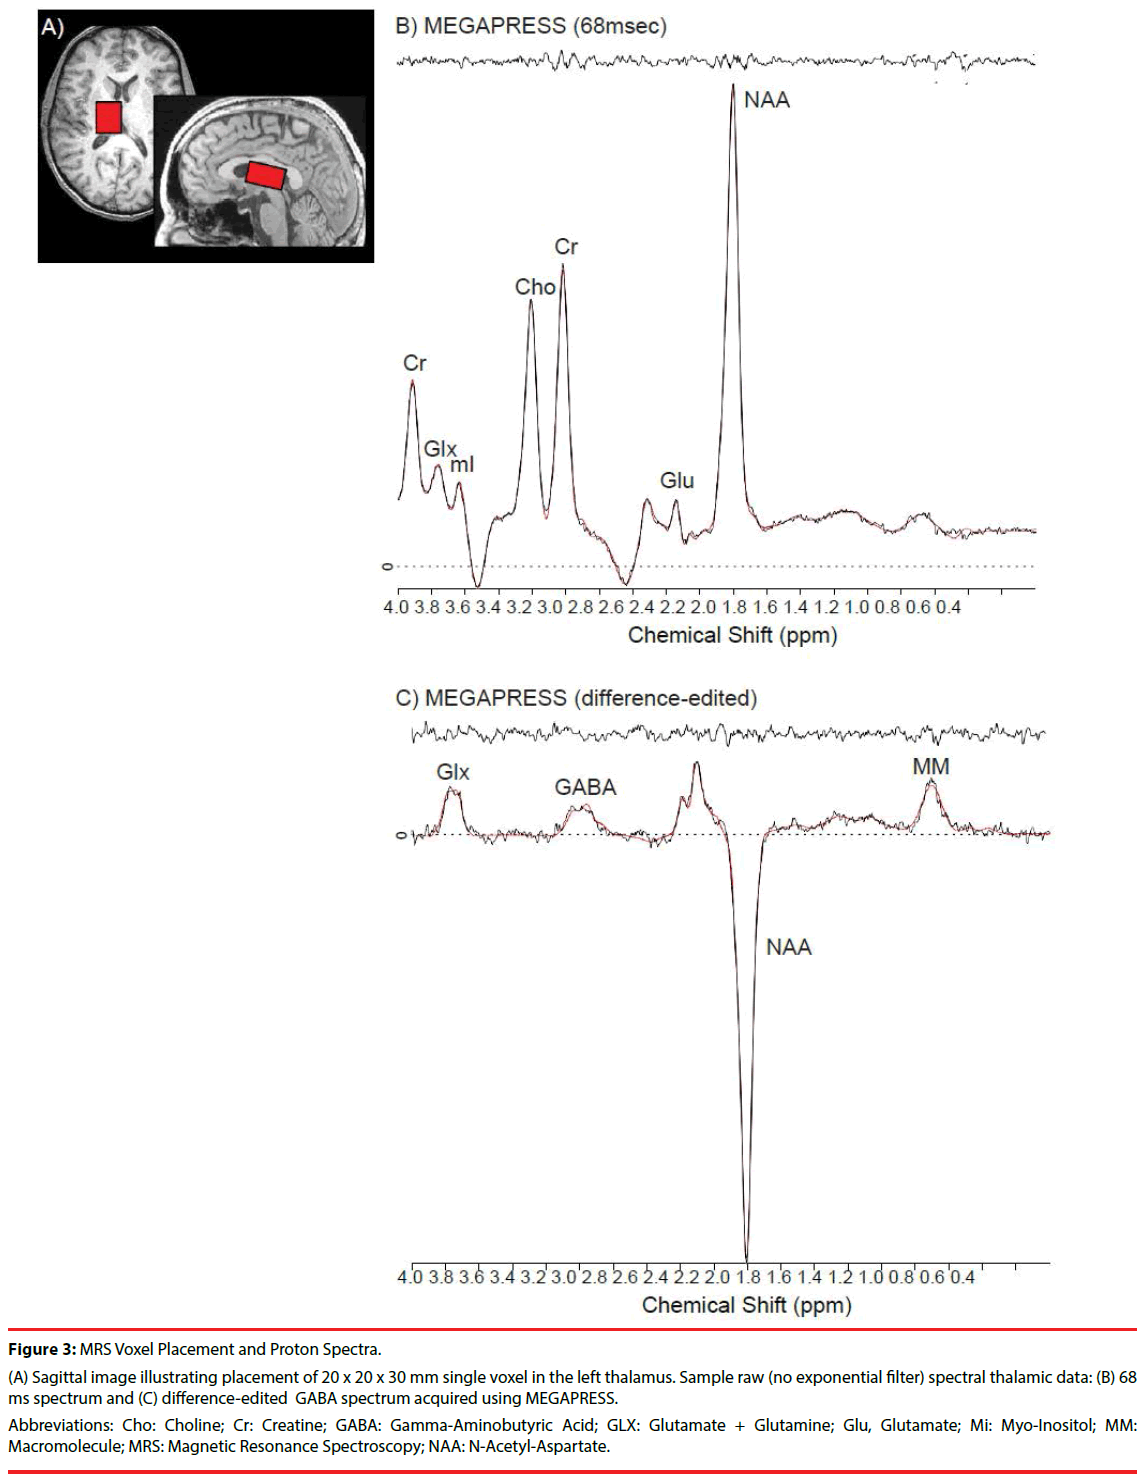
MRI and proton (1H) MRS scans were acquired on 4.0-Tesla Varian Unity/INOVA whole-body MRI/MRS scanner (Varian Inc., Palo Alto, California) using a volumetric head coil (XLR Imaging, London, Canada) in the Brain Imaging Center at McLean Hospital. Head placement was confirmed using three-plane scout images. Highcontrast 3D fast low-angle shot T1-weighted images were collected for voxel placement, followed by global shimming, and placement of a 20 (left to right) x 20 (inferior to superior) x 30 (anterior to posterior)-mm voxel in the left thalamus, whose inferior aspect was aligned with the Anterior Commissure-Posterior Commissure (AC-PC) line on sagittal view, and the medial aspect of the central sulcus and anterior aspect of the corpus callosum on axial view (Figure 3A).
Figure 3: MRS Voxel Placement and Proton Spectra.
(A) Sagittal image illustrating placement of 20 x 20 x 30 mm single voxel in the left thalamus. Sample raw (no exponential filter) spectral thalamic data: (B) 68 ms spectrum and (C) difference-edited GABA spectrum acquired using MEGAPRESS.
Abbreviations: Cho: Choline; Cr: Creatine; GABA: Gamma-Aminobutyric Acid; GLX: Glutamate + Glutamine; Glu, Glutamate; Mi: Myo-Inositol; MM: Macromolecule; MRS: Magnetic Resonance Spectroscopy; NAA: N-Acetyl-Aspartate.
Manual voxel shimming of the thalamic voxel yielded an average water line width = 10.6 ± 3.9Hz, which did not differ significantly between groups or across scan sessions. MEGAPRESS [30,41] was used to obtain difference-edited GABAoptimized spectra, as described previously [35]. The 3.00-ppm GABA doublet resonance and coedited resonance structures of glutamate (Glu), glutamine (Gln), N-acetylaspartate (NAA), and the 0.93-ppm macromolecule (MM) resonance from MEGAPRESS 68 ms and difference-edited spectra were fitted using LCModel [42] (Figures 3B and 3C). Within-subject coefficients of variation (CV=standard deviation/mean) using MEGAPRESS in the thalamus for GABA was 9.5% [43]. Average GABA Cramer Rao Lower Bounds (CRLB) in the present study was 9.0 ± 2.9%, which did not differ significantly between groups or scan-time (F (2,60) = 2.53 p=0.09). While GABA was the a priori of interest, other 68ms “OFF” subspectra metabolites were examined to verify MRS reliability, and to rule out systematic metabolite differences. There were no significant CRLB differences between groups or scan-time for Creatine (Cr) (1.8 ± 0.5%, F (2,60)=0.71, p=0.92), NAA (2.0 ± 0.8%, F (2,60)=0.75, p=0.93), or choline (Cho) (14.5 ± 11.8%, F (2,40)=0.34, p=0.72). There were no main effects of group or scan-time for CRLB (pooled Glu+Gln: 25.1 ± 10.4%), although there was a significant interaction (F(2,60)=4.37, p=0.02). All metabolite ratios were determined using Cr as the denominator.
T1-weighted axial image sets were segmented into gray matter (GM), white matter (WM), and cerebrospinal fluid (CSF) binary-tissue maps (FSL, Oxford, United Kingdom), with partial tissue percentages extracted for each voxel [43,44] to quantitatively estimate potential tissue-percentage differences on GABA/Cr ratios, which only correct for total tissue content [45,46]. Tissue percentages also were compared to confirm reliability of voxel placement across MRS scans.
▪ Statistical analyses
Statistical analyses were conducted using SPSS 24.0 (SPSS, Chicago, Illinois). Two group (HC, MDD) univariate analyses of variance (ANOVAs) and covariance (ANCOVAs) evaluated mood and depression scores, and thalamic GABA at baseline (Scan-1). Repeated measures ANOVAs/ANCOVAs assessed changes from baseline (Scan-1) to after completion of the 12-week intervention (Scan-2) and immediately after a yoga session (Scan-3). Post-hoc tests (two-tailed t-tests) were conducted to investigate sources of differences in analyses with significant main effects and/or interactions. Given the a priori hypothesis regarding changes in GABA/Cr over the course of the intervention, one-tailed paired t-tests were performed for each group to examine whether GABA changes between scans were statistically significant. Cohen effect sizes f (ES) were calculated for significant main effects and interactions using G*power (Version 3.1.9.2.). Pearson’s correlation coefficients were used to examine relationships between GABA/ Cr and clinical variables. Alpha levels were set at =0.05, except for metabolite analyses, wherein the p-value for each metabolite was corrected to account for multiple comparisons (GABA, Cho, GLX, and NAA) via a modified Bonferroni procedure [47], yielding an adjusted alpha level =0.016, based on four metabolites and average inter-correlation coefficients (r=0.178). Age, gender, and GM content (or WM content for analysis of the WM metabolite Cho) produced no significant effects when included as covariates, and were removed from statistical models.
Results
▪ Group demographics
HC-group was significantly younger and had significantly lower body mass index (BMI) than the MDD-group. No other significant between-group demographic differences were found (Table 1).
| Measures | MDD (n=15) | HC (n=17) | P Value |
|---|---|---|---|
| Age (years) | 34.7 ± 10.4 | 23.9 ± 3.2 | <0.001* |
| Female/male | 12/3 | 9/8 | 0.11 |
| Race | |||
| Caucasian | 87% | 88% | |
| African American | 13% | 6% | |
| Asian | 0% | 6% | |
| Years of Education | 16.7 ± 2.1 | 16.4 ± 1.1 | 0.98 |
| BMI | 28.1 ± 5.6 | 22.9 ± 2.8 | 0.03** |
Data represent mean values ± standard deviation. Abbreviations: HC: Healthy Controls; MDD: Major Depressive Disorder; BMI: Basal Metabolic Index. *F(1,30)=16.45, p<0.001, ES=0.79, ** F(1,30)=11.42, p<0.005, ES=0.62.
Table 1: Participant Demographics.
▪ Yoga intervention attendance
There was no significant difference in the number of classes or in class posture minutes for HC compared to MDD-group (Table 2) (p=0.18). However, total yoga minutes were significantly greater in the MDD-group F(1,30)=6.66, p=0.015, ES=.46), due to an additional 30 min of class time for transition and coherent breathing. Differences in methods for documenting yoga homework in HC compared to MDD-group precluded statistical comparison (Table 2).
| Measures | |||
|---|---|---|---|
| Classes | MDD (n=15) | HC (n=17) | P Value |
| Class Length (min) | 90 | 60 | |
| Classes Assigned | 24 | 36 | |
| Total Minutes Assigned | 2160 | 2160 | |
| Classes Attended | 20.5 ± 4.5 | 23.6 ± 7.5 | 0.18 |
| Total Minutes | 1,818.0 ± 431.9 | 1,415.3 ± 448.0 | 0.015 |
| Total Posture Minutes | 1,232.0 ± 267.2 | 1,415.3 ± 448.0 | 0.18 |
| Total Coherent Breathing (min) | 616.0 ± 133.6 | N/A | |
| Homework | MDD (n=15) | HC (n=17) | P Value |
| Homework Assigned (min per week) | 90 | 60 | |
| Total Homework Assigned (min) | 1,080 | 720 | |
| Total Homework Reported (min) | 919.1 ± 474.8 | ---- | |
| Homework Postures | MDD (n=15) | HC (n=17) | P Value |
| Total Postures Assigned (min) | 540 | 720 | |
| Sessions Reported | 25.5 ± 11.8 | ---- | |
| Total Postures Reported (min) | 555.9 ± 294.0 | ---- | |
| Homework Coherent Breathing | MDD (n=15) | HC (n=17) | P Value |
| Total Breathing Assigned (min) | 540 | N/A | |
| Sessions Reported | 23.5 ± 14.2 | ---- | |
| Total Minutes Reported | 363.1 ± 229.6 | ---- |
Data represent mean values ± standard deviation. Abbreviations: HC: Healthy Controls; MDD: Major Depressive Disorder; min: minutes.
Table 2: Yoga Intervention.
▪ MRI/MRS metabolite data
No significant differences appeared for either group in tissue segmentation data across Scans-1, 2 or 3, GM (48.4 ± 15.2%, F(2,60)=0.34, p=0.72), WM (41.3 ± 21.4%, F(2,60)=0.16, p=0.85), CSF (12.2 ± 14.8%, F(2,60)=0.11, p=0.90), or total tissue percentage (88.7 ± 12.6%, F(2,60)=0.14, p=0.87), confirming reproducibility of thalamic voxel placement algorithm across MRS sessions. Raw spectral areas did not differ significantly between groups or scan-times for 68ms Cr (131.9 ± 29.5, F(2,60)=1.08, p=0.35), indicating Cr was an unbiased denominator for metabolite ratios. Full width half max (0.07 ± 0.01, F(2, 60)=1.08, p=0.39, p=0.68) and signal-to-noise ratios [SNR; height of NAA/noise standard deviation in residual] (50.2 ± 9.6, F(2,60)=0.51, p=0.95) did not differ significantly across scans or between groups. Nineteen HC completed the intervention; two had incomplete scan data, resulting in 17 HC for analysis.
▪ Changes in GABA across the 12-week yoga intervention
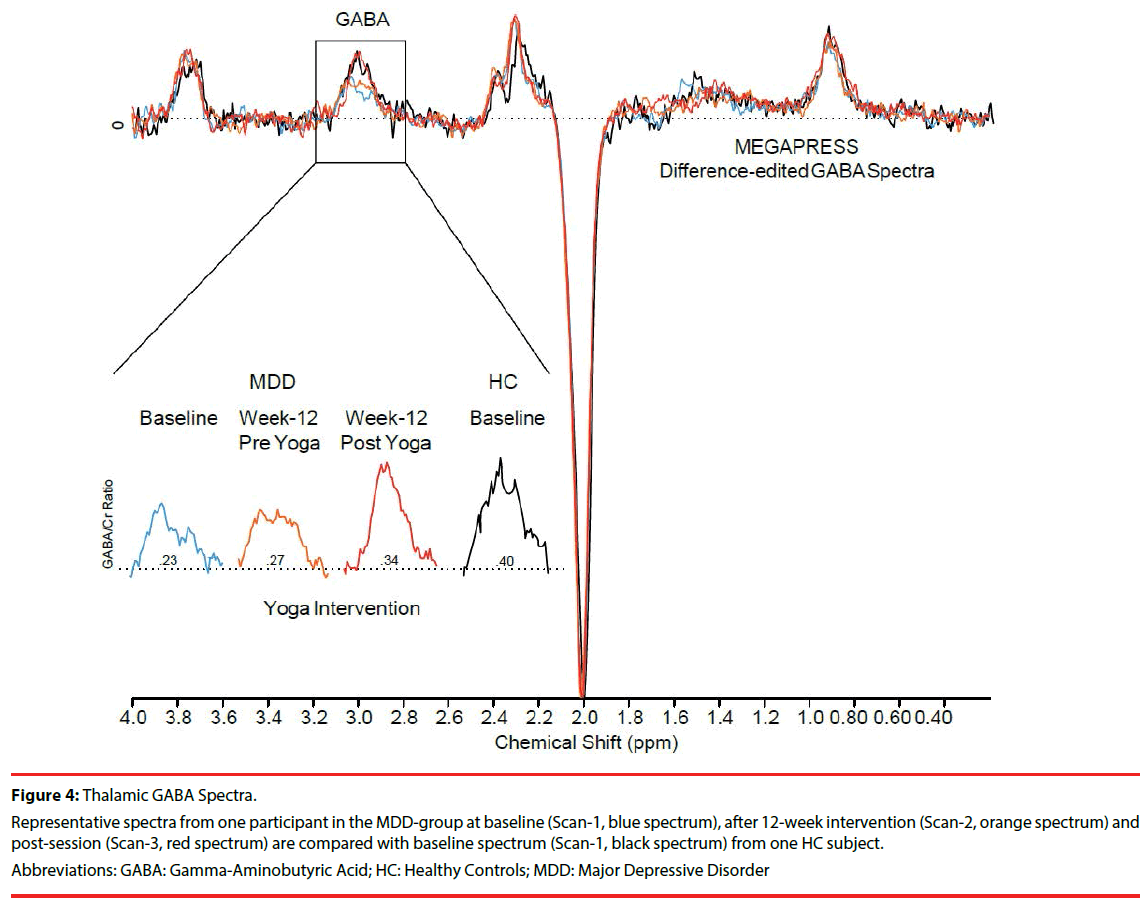
Figure 4 shows spectra from one MDD participant illustrating GABA peak increases from baseline (Scan-1), post 12-week yoga intervention (Scan-2), and immediately after an intervention (Scan-3). Scan-3 spectra from one MDD participant approximate baseline spectra (Scan-1) from one HC participant.
Figure 4: Thalamic GABA Spectra.
Representative spectra from one participant in the MDD-group at baseline (Scan-1, blue spectrum), after 12-week intervention (Scan-2, orange spectrum) and post-session (Scan-3, red spectrum) are compared with baseline spectrum (Scan-1, black spectrum) from one HC subject.
Abbreviations: GABA: Gamma-Aminobutyric Acid; HC: Healthy Controls; MDD: Major Depressive Disorder
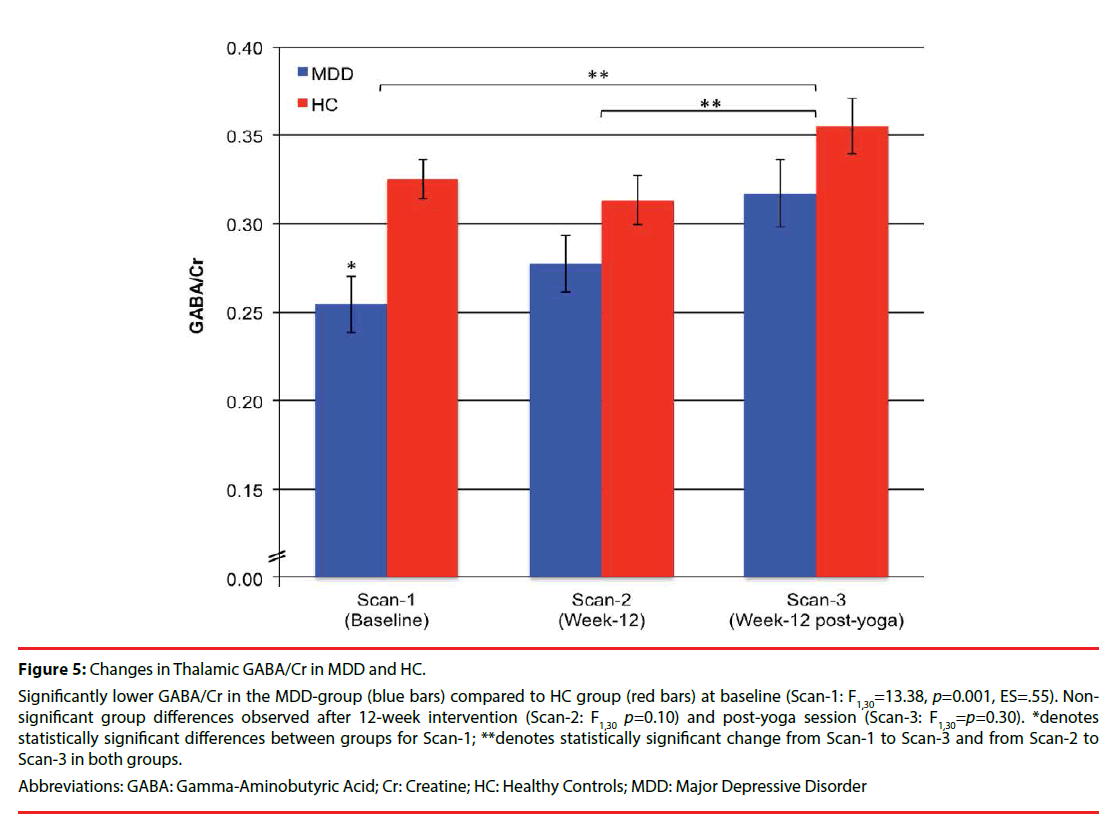
At baseline, GABA/Cr was significantly lower in the MDD-group (0.26 ± 0.06) compared to the HC group (0.33 ± 0.05). Post-hoc analyses of group comparisons post 12-week intervention (Scan-2) and immediately after a yoga session (Scan-3) showed that GABA/Cr differences between HC and MDD-groups were no longer statistically significant (Figure 5). One-tailed, paired t-tests revealed that while the change in GABA/Cr did not differ significantly for either group from Scan-1 to Scan-2 (HC: -0.01 ± 0.08, p=0.27; MDD: 0.02 ± 0.10, p=0.20), changes in GABA/Cr were significant from Scan-1 to Scan- 3 (HC: 0.03 ± 0.07, t16=1.75, p=0.05, ES=.43; MDD:0.06 ± 0.10, t14=2.513, p=0.013, ES=.60) and from Scan-2 to Scan-3 (HC: 0.04 ± 0.09, t16=1.91, p=0.04, ES=.44; MDD: 0.04 ± 0.08, t14=1.99, p=0.034, ES=.50) for both groups (Figure 5). There was a significant effect of scan-time for GABA/Cr, from baseline (Scan- 1) to post 12-week intervention (Scan-2) and immediately after a yoga session (Scan-3) (F(2, 60)=5.53, p=0.006, ES=.43), and a main effect of group (F(1,30)=14.08, p=0.001, ES=0.37.) However, no significant scan-time x group interaction was observed (F(2,60)=0.82, p=0.45).
Figure 5: Changes in Thalamic GABA/Cr in MDD and HC.
Significantly lower GABA/Cr in the MDD-group (blue bars) compared to HC group (red bars) at baseline (Scan-1: F1,30=13.38, p=0.001, ES=.55). Nonsignificant group differences observed after 12-week intervention (Scan-2: F1,30 p=0.10) and post-yoga session (Scan-3: F1,30=p=0.30). *denotes statistically significant differences between groups for Scan-1; **denotes statistically significant change from Scan-1 to Scan-3 and from Scan-2 to Scan-3 in both groups.
Abbreviations: GABA: Gamma-Aminobutyric Acid; Cr: Creatine; HC: Healthy Controls; MDD: Major Depressive Disorder
▪ Changes in NAA, GLX and choline
For other proton metabolites, significant differences by group were observed at baseline for GLX (Scan-1, F(1,30)=7.94, p=0.008, ES=.45) and NAA (Scan-1, F(1,30)=5.84, p=0.02, ES=.40), but not for Cho (Scan-1, F(1,30)=0.55, p=0.46) (Table 3). NAA, Cho or GLX did not change significantly between Scans-1 and Scan- 3 (F(2,58)=0.29, p=0.75; F(2,38)=1.00, p=0.38, F(2,58)=0.41, p=0.67, respectively).
| Group | Metabolite | Baseline Scan-1 |
12-Weeks Scan-2 |
Post Yoga Scan-3 |
|---|---|---|---|---|
| MDD (n=15) |
GABA/Cr | 0.26 ± 0.06* | 0.28 ± 0.06** | 0.32 ± 0.07*** |
| Cho/Cr | 0.67 ± 0.04 | 0.66 ± 0.04 | 0.65 ± 0.03 | |
| GLX/Cr | 1.04 ± 0.05 | 1.01 ± 0.06 | 1.12 ± 0.07 | |
| NAA/Cr | 1.44 ± 0.05 | 1.48 ± 0.05 | 1.55 ± 0.06 | |
| HC (n=17) |
GABA/Cr | 0.33 ± 0.05 | 0.32 ± 0.06** | 0.36 ± 0.07*** |
| Cho/Cr | 0.63 ± 0.04 | 0.55 ± 0.04 | 0.61 ± 0.03 |
|
| GLX/Cr | 1.33 ± 0.09 | 1.24 ± 0.07 |
1.30 ± 0.11 |
|
| NAA/Cr | 1.60 ± 0.04 | 1.54 ± 0.03 |
1.57 ± 0.04 |
Data represent mean values ± standard deviation. Abbreviations: Cho: Choline; Cr: Creatine; GABA: Gamma-aminobutyric acid; GLX: Glutamate + glutamine; NAA: N-acetyl-aspartate; HC: Healthy Controls; MDD: Major Depressive Disorder. *denotes statistically significant group difference between MDD and HC (p<.05); **statistically significant change from Scan-1 to Scan-2 for both groups; ***statistically significant change from Scan-1 to Scan-3 for both groups
Table 3: Metabolite: Cr Ratios.
▪ BDI-II, STAI-State and EIFI outcomes
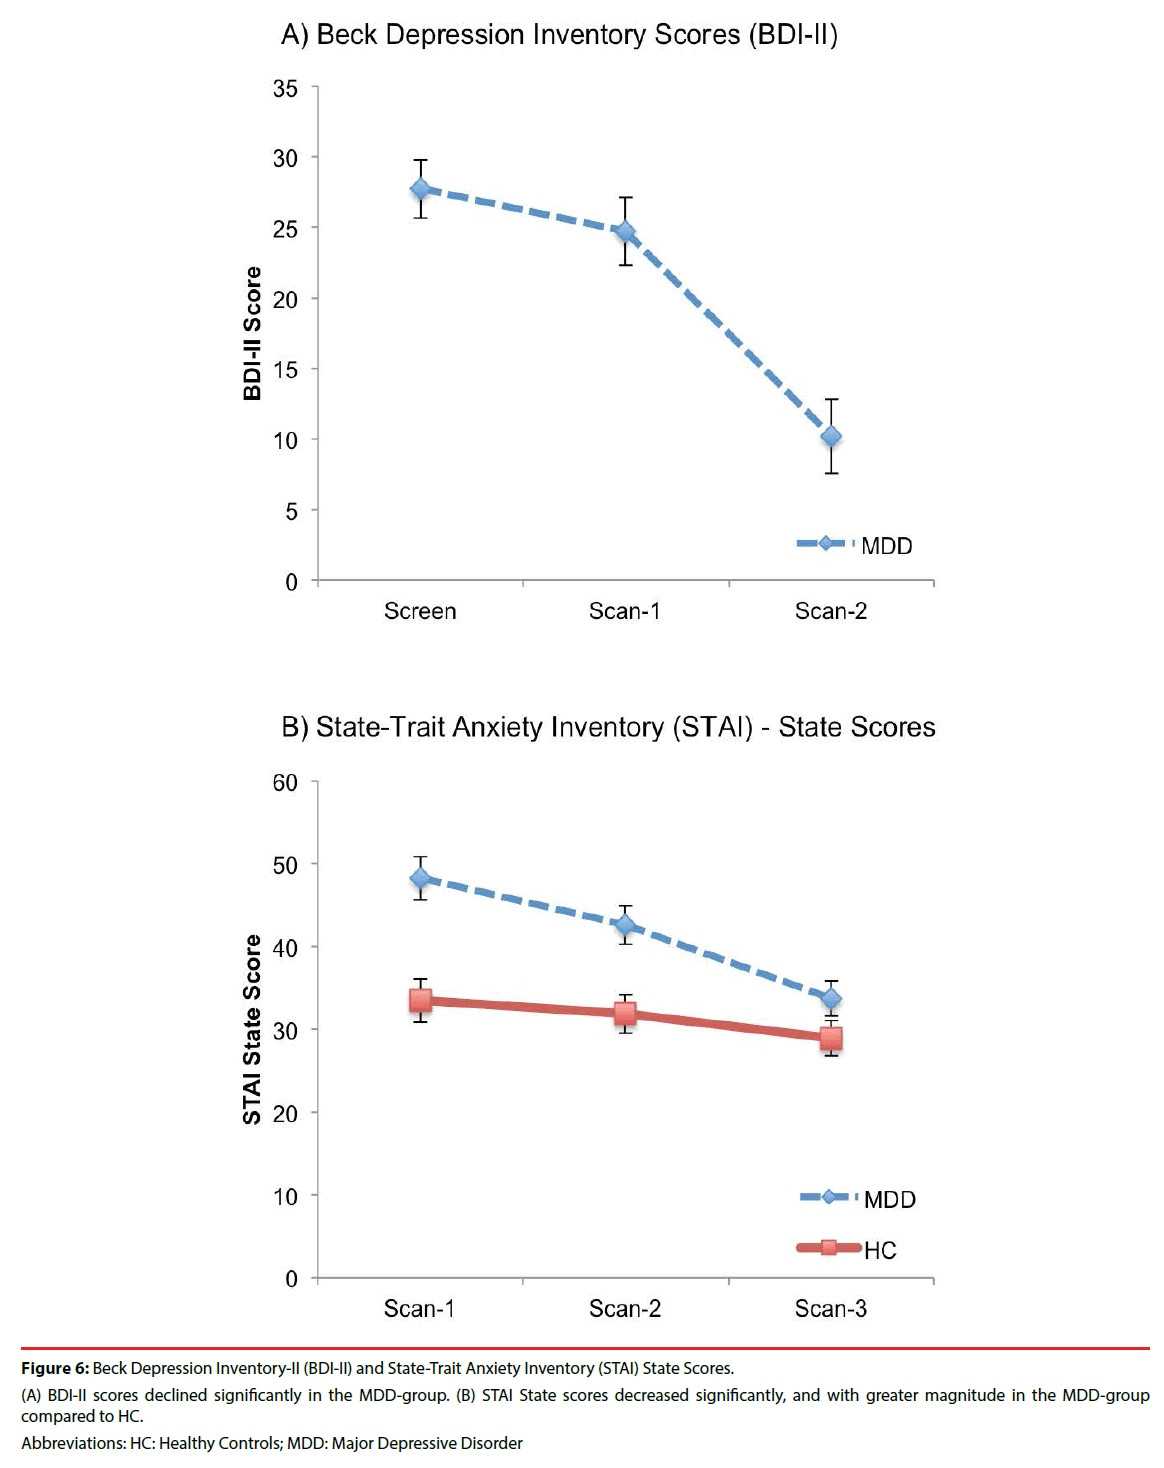
An effect of scan-time was evident in the MDD-group for BDI-II scores, which declined significantly from baseline (Scan-1) to post 12- week intervention (Scan-3) (F(2,28)=29.26, p<0.0001, ES=1.44) (Figure 6a). There was a significant effect for scan-time (F(2,56)=13.58, p<0.0001, ES=0.70) and scan-time x group interaction (F(2,56)=3.71, p=0.03, ES=.36) for STAI-State scores (Table 4 and Figure 6b). Post hoc comparisons revealed significant declines in STAI-State scores over scan-times in both groups (Table 5). Significantly higher STAI-State scores at Scan-1 in the MDDgroup compared to HC were no longer significantly different at Scan-2 or Scan-3. Post hoc tests for STAI-State revealed significant differences between the MDD and HC groups at Scan-1 and Scan-2, which were no longer observed at Scan-3. A significant decrease in STAI-State scores was observed in the MDD group and a trend for a decrease was evident in HC between Scan-2 and Scan-3.
| Effect of Scan-Time | Test | Df | P Value | ES |
|---|---|---|---|---|
| STAI-State | F = 13.58 | 2,56 | <0.0001* | 0.70 |
| EIFI: Positive Engagement | F = 8.51 | 2,54 | 0.001* | 0.56 |
| EIFI: Revitalization | F = 35.21 | 2,54 | <0.001* | 1.14 |
| EIFI: Tranquility | F = 18.56 | 2,54 | <0.0001* | 0.83 |
| EIFI: Physical Exhaustion | F = 9.66 | 2,54 | <0.0001* | 0.60 |
| Effect of Scan-Time x Group | Test | Df | P Value | ES |
| STAI-State | F = 3.71 | 2,56 | 0.03* | 0.36 |
| EIFI: Revitalization | F = 5.08 | 2,54 | 0.01* | 0.43 |
| EIFI: Tranquility | F = 7.07 | 2,54 | 0.002* | 0.51 |
Table 4: Effect of Scan-Time on State Trait Anxiety (STAI) State and Exercise Induced Feeling Inventory (EIF).
| Post Hoc Analysis | ||||||
|---|---|---|---|---|---|---|
| MDD Scores Lower than HC Scores | Test | Df | P Value | ES | ||
| EIFI: Positive Engagement | ||||||
| Scan 1 | t = 2.67 | 28 | 0.01* | 0.97 | ||
| Scan 2 | t = 3.67 | 28 | 0.001* | 1.34 | ||
| Scan 3 | 28 | 0.37 | ||||
| EIFI: Revitalization | ||||||
| Scan 1 | t = 2.48 | 28 | 0.02* | 1.48 | ||
| Scan 2 | t = 4.05 | 28 | <0.001* | 0.91 | ||
| Scan 3 | 28 | 0.50 | ||||
| EIFI: Tranquility | ||||||
| Scan 1 | t = 3.17 28 | 28 | 0.004* | 1.16 | ||
| Scan 2 | t = 4.77 28 | 28 | <0.001* | 1.74 | ||
| Scan 3 | t = 0.91 | 27 | 0.37 | |||
| MDD Scores Higher than HC Scores | Test | Df | P Value | ES | ||
| EIFI: Physical Exhaustion | ||||||
| Scan 1 | t = -1.02 28 | 28 | 0.32 | |||
| Scan 2 | t = -0.54 28 | 28 | 0.59 | |||
| Scan 3 | t = 0.59 27 | 27 | 0.56 | |||
| MDD and HC Increases Scan 1 to Scan 3 Test Df P Value ES | Test | Df | P Value | ES | ||
| EIFI: Positive Engagement | F = 13.53 | 1,27 | 0.001 | 0.71 | ||
| EIFI: Revitalization | F = 54.85 | 1,27 | <0.001 | 1.43 | ||
| EIFI: Tranquility | F = 31.47 | 1,27 | <0.001 | 1.08 | ||
| MDD Increase Scan 2 to Scan 3 | Test | Df | P Value | ES | ||
| EIFI: Positive Engagement | t = 2.32 | 14 | 0.04 | 0.6 | ||
| EIFI: Revitalization | t = 6.97 | 14 | <0.001 | 1.80 | ||
| EIFI: Tranquility | t = 5.44 | 14 | <0.001 | 1.41 | ||
| MDD Decreases Scan 1 to Scan 2 | Test | Df | P Value | ES | ||
| STAI-State | t = 4.33 | 14 | 0.001 | 1.12 | ||
| EIFI: Physical Exhaustion | t = 3.15 | 14 | 0.007 | 0.81 | ||
| MDD and HC Decreases Scan 2 to Scan 3 | Test | Df | P Value | ES | ||
| MDD Group: STAI-State | t = 4.33 | 14 | 0.001 | 1.12 | ||
| HC Group: STAI-State | t = 2.02 | 14 | 0.06 | 0.52 | ||
| MDD EIFI: Physical Exhaustion | t = 2.97 | 14 | <0.001 | 0.65 | ||
Table 5: Post Hoc Analyses.
Figure 6: Beck Depression Inventory-II (BDI-II) and State-Trait Anxiety Inventory (STAI) State Scores.
(A) BDI-II scores declined significantly in the MDD-group. (B) STAI State scores decreased significantly, and with greater magnitude in the MDD-group compared to HC.
Abbreviations: HC: Healthy Controls; MDD: Major Depressive Disorder
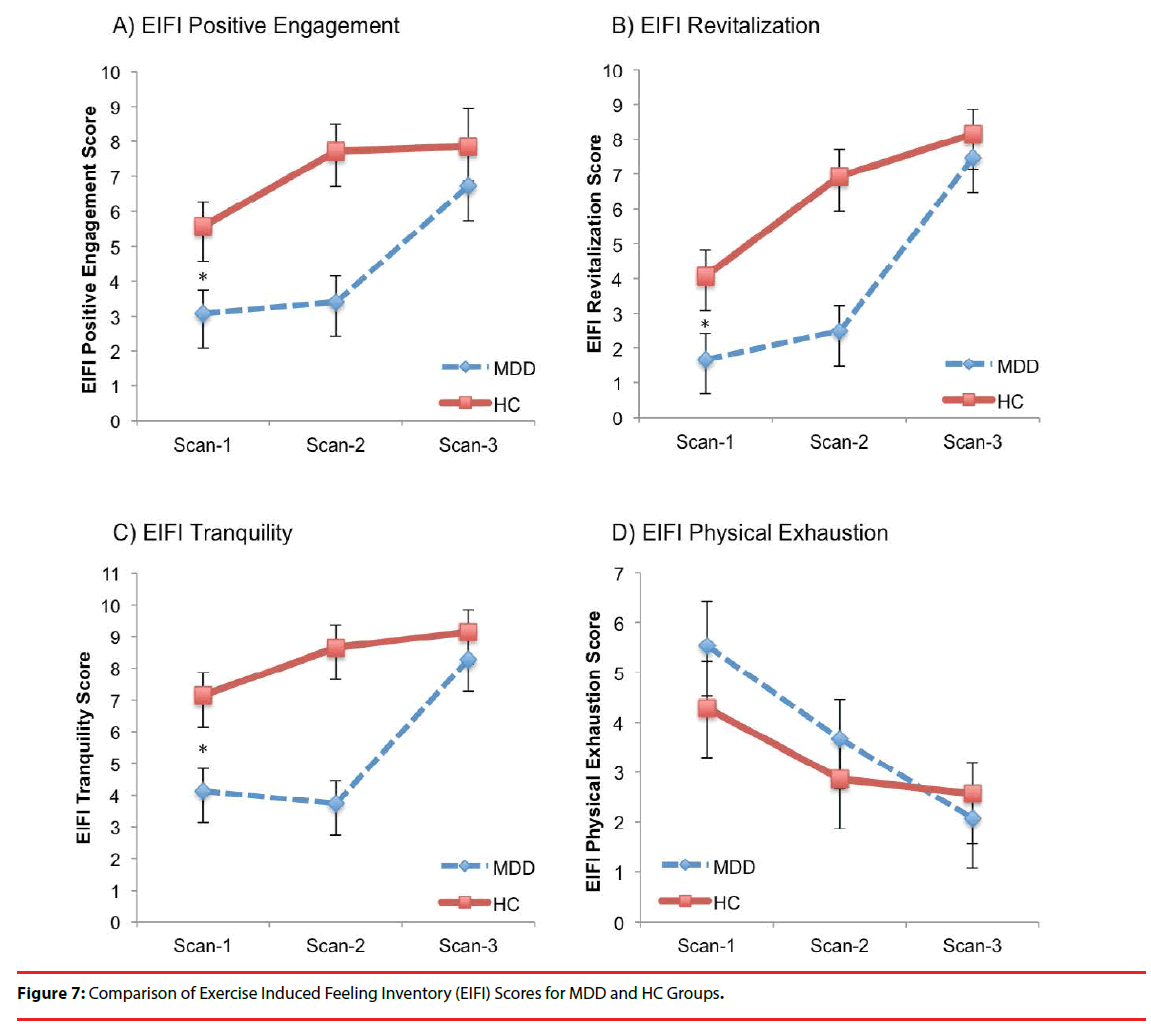
There were significant effects of scan-time for EIFI subtests: Positive Engagement, Revitalization, Tranquility and Physical Exhaustion (Table 4 and Figure 7). Significant scan-time x group interactions were evident for Revitalization and Tranquility. Post hoc analyses revealed the MDDgroup EIFI was lower than HC at Scan-1 and Scan-2 for Positive Engagement, Revitalization and Tranquility but no longer different at Scan 3. Further, both MDD and HC group scores on all three measures increased significantly between Scan-1 and Scan-3 for Positive Engagement, Revitalization, Tranquility, but only the MDDgroup had significantly increased scores between Scan-2 and Scan-3 for Positive Engagement, Revitalization, and Tranquility. Conversely, only the MDD-group showed significant decline in Physical Exhaustion from Scan-1 to Scan-2 and from Scan-2 to Scan-3.
Discussion
of depression [7,10,25,48,49], this comparative analysis found improved mood and anxiety after 12-weeks of a yoga intervention in participants with MDD. In the MDD-group, following the yoga intervention, thalamic GABA levels increased (normalized) while depressive symptoms (lower BDI-II scores) and anxiety (lower STAIState scores) both diminished. This study provides important, novel information regarding enhanced neurochemistry following a yoga-based intervention, measured as significantly increased thalamic GABA levels in the MDD group, equivalent to levels observed in a healthy, nondepressed cohort. These findings support the Vagal- GABA Theory of depression, which postulates that specific yoga postures and breathing practices associated with improved mood are accompanied by increased GABA activity [13,24,25].
Thalamic GABA was the primary dependent variable of this comparative analysis. Thalamic GABA levels in the MDD-group compared to the Hyphenate: HC-group were statistically significantly lower at baseline (Scan 1) but were no longer statistically different after the yoga intervention at Scan-2 and Scan-3. The yoga-associated GABA increases in the MDDgroup were robust, producing medium to large effect sizes (effect size F: .25 to .40; effect size d/dz: .50 to .80) with p-values that withstood correction for multiple comparisons (p=0.006 at baseline, p=0.001 change over treatment). Clinical outcome measures in the MDD-group also normalized: EIFI subscales Tranquility, Revitalization and Positive Engagement increased, while Physical Exhaustion decreased. Symptoms of MDD declined significantly on BDI-II. Symptoms of anxiety declined significantly on the STAI-State. Most changes in clinical outcome measures were robust, producing large effect sizes.
Low parasympathetic and low GABA activity are reported in MDD [16,50], post-traumatic stress disorder (PTSD) [51,52], panic disorder [53- 55], epilepsy [56,57] and alcohol dependence [58,59]. These disorders are frequently comorbid suggesting transdiagnostic, common core core abnormalities: low parasympathetic and low GABA activity [13]. In addition to MDD, evidence from RCTs suggests that yoga-based interventions can reduce symptoms of PTSD [60-62] and anxiety disorders [63,64]. As these disorders share common abnormalities, low parasympathetic and GABA activity, the potential benefits of yoga-based practices may be generalizable to other disorders with low parasympathetic and GABA activity.
Baseline levels of GLX and NAA were lower in the MDD-group. The difference in NAA did not survive multiple comparison correction. GLX and NAA did not change significantly over the course of treatment. Cho showed no betweengroup difference at baseline or post-intervention. These findings indicate that yoga-related changes in brain metabolites were GABA specific, rather than reflecting general or systematic increases. These results are consistent with previous studies in MDD documenting altered GABA levels [50] and mixed findings for other proton metabolites [65].
These findings should be tempered by the strengths and weaknesses of the studies, as well as the analysis. Strengths include use of CONSORT criteria, allowing comparisons across RCTs in HC and MDD cohorts (see Supplement). The research team, recruitment environments, yoga interventions and MRS (scanner, sequence, and data processing) were similar. There also were no differences over repeated scans for either group regarding reliability of voxel placement, signalto- noise, reliability of spectral fitting, or tissue composition within the MRS voxel. Additional strengths include the use of a manualized yoga intervention, highly trained Iyengar yoga instructors, fidelity assessments, and adverse events reporting. One weakness is the lack of temporal overlap for data collection from the two cohorts. Another limitation is the addition of coherent breathing to the yoga intervention for the MDD-group only, which increased overall class time to 90 min (30 min longer than in HC), although minutes of posture class time between the groups was not significantly different. The extent to which coherent breathing contributed to intervention-related effects cannot be determined in the current analysis, but warrants further study. Lastly, the MDD-group was older and had a higher BMI compared to HC. Nevertheless, significant baseline GABA differences were maintained when analyses were adjusted for age.
The results of this study must be interpreted with consideration of the severity of participant symptoms. Because yoga is not an approved treatment for depression, individuals with suicidal ideation with intent (past year) were excluded. In addition, individuals with a level of depression severity that could have affected their ability to complete the study were excluded. Accordingly, conclusions can only be drawn about individuals with depression who met study inclusion criteria. The MDD-group, of which only 1 was on an antidepressant medication, demonstrated a significant decrease in depressive symptoms, suggesting a potential benefit of specific yoga postures and breathing practices to augment other treatments, and to reduce depressive symptoms in MDD populations similar to those enrolled in this study. Additional neurobiological investigations of yoga-based interventions for reduction of symptoms associated with other disorders known to have low brain GABA levels, such as PTSD and anxiety disorders, are warranted.
In conclusion, comparative analysis of cohorts from two RCTs using a similar 12-week yoga intervention found that in the MDD-group, depression and anxiety measures improved to levels equivalent to those of the non-depressed healthy control (HC). Concurrently, thalamic GABA levels, which were comparatively low at baseline in the MDD-group, increased significantly to levels no longer significantly different from those of healthy controls. This study provides the first evidence in participants with MDD of increases in brain GABA levels and decreases in depressive symptoms associated with a yoga intervention. These results indicate potential benefits of specific yoga postures and breathing practices as monotherapy or augmentation to other treatments to reduce anxiety and depression in MDD. Furthermore, yoga-based interventions offer potential treatments for other disorders with low brain GABA such as PTSD and other anxiety disorders.
Acknowledgements
The results presented in this study are a novel comparison of GABA and mood changes in HC (data from Streeter et al., 2010) versus participants with MDD (data from Streeter et al., 2017.) Funding for these studies was provided by R21AT004014 and R01AT007483 (CCS), M01RR00533 (Boston University Clinical and Translational Science Institute (CTSI)), and Ul1RR025771 (General Clinical Research Unit at Boston University Medical Center). All yoga instructors included Carol Faulkner, Marysia Gensler, Cathy Mann, Liz Owen, and Mary Wixted. Dr. Lily Awad, Dr. Gordon Harris and Dr. Howard Cabral served as Data Safety Monitors.
Financial Disclosures
Dr. Brown and Dr. Gerbarg have published and teach Breath-Body-Mind©, a program that includes coherent breathing. Dr Brown holds a patent for the use of 7-keto DHEA for PTSD with Humanetics. Dr. Streeter and Ms. Owen are certified to teach Breath-Body-Mind©. For all other authors, no competing financial interests exist.
References
d
- Wang PS, Simon G, Kessler RC, et al. The economic burden of depression and the cost-effectiveness of treatment. Int. J. Meth. Psychiatr. Res 12(1), 22-33 (2003).
- Wolk CB, et al. Pathways to anxiety-depression comorbidity: A longitudinal examination of childhood anxiety disorders. Depress. Anxiety 33(10), 978-986 (2016).
- Merino H, Senra C, Ferreiro F. Are Worry and Rumination Specific Pathways Linking Neuroticism and Symptoms of Anxiety and Depression in Patients with Generalized Anxiety Disorder, Major Depressive Disorder and Mixed Anxiety-Depressive Disorder? PLoS. One 11(5), e0156169 (2016).
- Rush AJ, et al. Sequenced treatment alternatives to relieve depression (STAR*D): Rationale and design. Control. Clin. Trials 25(1), 119-142 (2004).
- Judd LL, et al. A New Empirical Definition of Major Depressive Episode Recovery and Its Positive Impact on Future Course of Illness. J. Clin. Psychiatry 77(8), 1065-1073 (2016).
- Bryant EF. The Yoga Sutras of Patanjali: A New Edition, Translation and Commentary with Insights from the Traditional Commentators, New York: North Point Press (2009).
- Cramer H, et al. A systematic review of yoga for major depressive disorder. J. Affect. Disord 213(1), 70-77 (2017).
- Uebelacker LA, et al. Adjunctive yoga v. health education for persistent major depression: a randomized controlled trial. Psychol. Med 1-13 (2017).
- Shapiro D, et al. Yoga as a Complementary Treatment of Depression: Effects of Traits and Moods on Treatment Outcome. Evid Based Complement. Alternat. Med 4(4), 493-502 (2007).
- Uebelacker LA, Broughton MK. Yoga for Depression and Anxiety: A Review of Published Research and Implications for Healthcare Providers. R. I. Med. J 99(3), 20-22 (2013).
- Ravindran AV, Da Silva TL. Complementary and alternative therapies as add-on to pharmacotherapy for mood and anxiety disorders: a systematic review. J. Affect. Disord 150(3), 707-719 (2013).
- Gangadhar BN, et al. Positive antidepressant effects of generic yoga in depressive out-patients: A comparative study. Indian. J. Psychiatry 55(1), S369-73 (2013).
- Streeter CC, et al. Effects of yoga on the autonomic nervous system, gamma-aminobutyric-acid, and allostasis in epilepsy, depression, and post-traumatic stress disorder. Med. Hypotheses 78(1), 571-579 (2012.)
- Mohler H. The GABA system in anxiety and depression and its therapeutic potential. Neuropharmacol 62(1), 42-53 (2012).
- Sanacora G, et al. Increased cortical GABA concentrations in depressed patients receiving ECT. Am. J. Psychiatr 160(3), 577-579 (2003).
- Thayer JF, Friedman BH, Borkovec TD. Autonomic characteristics of generalized anxiety disorder and worry. Biol. Psychiatry 39(4), 255-66 (1996).
- Brown RP, Gerbarg PL. Breathing techniques in psychiatric treatment. In Complementary and Integrative Treatments in Psychiatric Practice. Washington, DC: American Psychiatric Association Publishing, USA (2017).
- Brown RP, Gerbarg PL. Sudarshan Kriya yogic breathing in the treatment of stress, anxiety, and depression: part I-neurophysiologic model. J. Altern. Complement. Med, 2005. 11(1): p. 189-201.
- Chu IH, et al. Effects of Yoga on Heart Rate Variability and Depressive Symptoms in Women: A Randomized Controlled Trial. J. Altern. Complement. Med (2017).
- Karavidas MK. et al. Preliminary results of an open label study of heart rate variability biofeedback for the treatment of major depression. Appl. Psychophysiol. Biofeedback 32(1), 19-30 (2007).
- Khattab K, et al. Iyengar yoga increases cardiac parasympathetic nervous modulation among healthy yoga practitioners. Evid. Based. Complement. Alternat. Med 4(4), 511-517 (2007).
- Telles S, et al. Heart rate variability in chronic low back pain patients randomized to yoga or standard care. BMC. Complement. Altern. Med 16(1), 279 (2016).
- Streeter CC, et al. Yoga Asana sessions increase brain GABA levels: A pilot study. J. Altern. Complement. Med 13(4), 419-426 (2007).
- Streeter CC, et al. Effects of Yoga Versus Walking on Mood, Anxiety, and Brain GABA Levels: A Randomized Controlled MRS Study. J. Alter. Complement. Med 16(11), 1145-1152 (2010).
- Streeter CC, et al, Treatment of Major Depressive Disorder with Iyengar Yoga and Coherent Breathing: A Randomized Controlled Dosing Study. J. Altern. Complement. Med 23(3), 201-207 (2017).
- Woodbury DM, Woodbury JW. Effects of vagal stimulation on experimentally induced seizures in rats. Epilepsia 31(1), S7-19 (1990).
- Taylor AG, et al. Top-Down and Bottom-Up mechanisms in Mind-Body Medicine: Development of an integrative framework for psychophysiological research. Explore (NY) 6(1), 29-41 (2010).
- Gerbarg PL, Brown RP. Neurobiology and neurophysiology of breath practices in psychiatric care. Psychiatric. Times 3(11), 22-15 (2016).
- Streeter CC. Effects of Yoga on the Parasympathetic Nervous System and the Gamma-Aminobutyric Acid (GABA) System. Kripalu Center for Yoga and Health, Stockbridge, MA, USA (2012).
- Mescher M, et al. Simultaneous in vivo spectral editing and water suppression. NMR. Biomed 11(6). 266-272 (1998).
- First MB, et al. Structured clinical interview for DSM-IV-TR Axis I disorders, research version, patient edition. (SCID-I/P, 1/2010), N.Y.B. Research, Editor: New York (2010).
- Arnau RC, et al. Psychometric evaluation of the Beck Depression Inventory-II with primary care medical patients. Health. Psychol 20(2), 112-119 (2001).
- Schulz KF. et al. CONSORT 2010 Statement: Updated Guidelines for Reporting Parallel Group Randomized Trials. Ann. Intern. Med 152(11), 726-732 (2010).
- Epperson CN. et al. Sex, GABA, and nicotine: the impact of smoking on cortical GABA levels across the menstrual cycle as measured with proton magnetic resonance spectroscopy. Biol. Psychiatr 57(1), 44-48 (2005).
- Silveri MM. et al. Frontal lobe gamma-aminobutyric acid levels during adolescence: associations with impulsivity and response inhibition. Biol. Psychiatr 74(4), 296-304 (2013).
- Brown RP, Gerbarg PL. Breathing Techniques in Psychiatric Treatment, in Complementary and Integrative Treatments in Psychiatric Practice. Am. Psychiatr. Assoc. Publish, Washington, DC (2017).
- Gerbarg PL, Brown RP. Neurobiology and neurophysiology of breath practices in psychiatric care. Psychiatric. Times 33(11), 22-25 (2016).
- Brown RP, Gerbarg PL. The Healing Power of the Breath: Simple Techniques to Reduce Stress and Anxiety, Enhance Concentration, and Balance Your Emotions. 2012, Boston, MA: Shambhala Publications, Inc (2012).
- Spielberger CD. et al. Manual for the State-Trait Anxiety Inventory (Form Y). 1983, Palo Alto, CA: Consulting Psychologists Press (1983).
- Gauvin L, Rejeski WJ. The exercise-induced feeling inventory: Development and initial validation. J. Sport. Exerc. Psychol 15(4), 403-423 (1993).
- Rothman DL. et al. Localized 1H NMR measurements of gamma-aminobutyric acid in human brain in vivo. Proc. Natl. Acad. Sci 90(12), 5662-5666 (1993).
- Provencher SW. Estimation of metabolite concentrations from localized in vivo proton NMR spectra. Magn. Reson. Med 30(6), 672-679 (1993).
- Licata SC. et al. A therapeutic dose of zolpidem reduces thalamic GABA in healthy volunteers: A proton MRS study at 4 T. Psychopharmacol (Berl) 203(4), 819-829 (2009).
- Jensen JE. et al. Quantification of J-resolved proton spectra in two-dimensions with LCModel using GAMMA-simulated basis sets at 4 Tesla. NMR. Biomed 22(7), 762-769 (2009).
- Choi IY. et al. In vivo detection of gray and white matter differences in GABA concentration in the human brain. Neuroimage 33(1), 85-93 (2006).
- Jensen JE, Frederick Bde B, Renshaw PF. Grey and white matter GABA level differences in the human brain using two-dimensional, J-resolved spectroscopic imaging. NMR. Biomed 18(8), 570-576 (2005).
- Abe C. et al. Polysubstance and alcohol dependence: unique abnormalities of magnetic resonance-derived brain metabolite levels. Drug. Alcohol. Depend 130(1-3), 30-37 (2013).
- Woolery A. et al. A yoga intervention for young adults with elevated symptoms of depression. Altern. Ther. Health. Med 10(2), 60-63 (2004).
- Naveen GH. et al. Positive therapeutic and neurotropic effects of yoga in depression: A comparative study. Indian. J. Psychiatry 55(Suppl 3), S400-4 (2013).
- Sanacora G. et al. Increased occipital cortex GABA concentrations in depressed patients after therapy with selective serotonin reuptake inhibitors. Am. J. Psychiatry 159(4), 663-665 (2002).
- Sack M. Hopper JW, Lamprecht F. Low respiratory sinus arrhythmia and prolonged psychophysiological arousal in posttraumatic stress disorder: heart rate dynamics and individual differences in arousal regulation. Biol. Psychiatry 55(3), 284-290 (2004).
- Vaiva G. et al. Low posttrauma GABA plasma levels as a predictive factor in the development of acute posttraumatic stress disorder. Biol. Psychiatry 55(3), 250-254 (2004).
- Friedman BH, Thayer JF. Autonomic balance revisited: panic anxiety and heart rate variability. J. Psychosom. Res 44(1), 133-151 (1998).
- Crestani F. et al. Decreased GABAA-receptor clustering results in enhanced anxiety and a bias for threat cues. Nat Neurosci, 1999. 2(9): p. 833-9.
- Bremner JD. et al. SPECT [I-123]iomazenil measurement of the benzodiazepine receptor in panic disorder. Biol. Psychiatry 47(2), 96-106 (2000).
- Ansakorpi H. et al. Heart rate dynamics in refractory and well controlled temporal lobe epilepsy. J. Neurol . Neurosurg. Psychiatry 72(1), 26-30 (2002).
- Petroff OA. et al. Topiramate rapidly raises brain GABA in epilepsy patients. Epilepsia 42(4), 543-548 (2001).
- Ingjaldsson JT, Laberg JC, Thayer JF. Reduced heart rate variability in chronic alcohol abuse: relationship with negative mood, chronic thought suppression, and compulsive drinking. Biol. Psychiatry 54(12), 1427-1436 (2003).
- Behar KL. et al. Preliminary evidence of low cortical GABA levels in localized 1H-MR spectra of alcohol-dependent and hepatic encephalopathy patients. Am. J. Psychiatry 156(6), 952-954 (1999).
- Telles S, Naveen KV, Dash M. Yoga reduces symptoms of distress in tsunami survivors in the andaman islands. Evid. Based. Complement. Alternat. Med 4(4), 503-509 (2007).
- Telles S. et al. Post traumatic stress symptoms and heart rate variability in Bihar flood survivors following yoga: a randomized controlled study. BMC. Psychiatry 10(1) 18 (2010).
- Descilo T. et al. Effects of a yoga breath intervention alone and in combination with an exposure therapy for post-traumatic stress disorder and depression in survivors of the 2004 South-East Asia tsunami. Acta. Psychiatr. Scand (2009).
- Bremner JD. et al. Structural and functional plasticity of the human brain in posttraumatic stress disorder. Prog. Brain. Res 167, 171-186 (2008).
- Katzman MA. et al. A multicomponent yoga-based, breath intervention program as an adjunctive treatment in patients suffering from generalized anxiety disorder with or without comorbidities. Int. J. Yoga 5(1), 57-65 (2012).
- Yildiz-Yesiloglu A, Ankerst DP. Review of 1H magnetic resonance spectroscopy findings in major depressive disorder: a meta-analysis. Psychiatry. Res147(1), 1-25 (2006).
