Research Article - Clinical Practice (2018)
Efficacy, safety and economy of icotinib for advanced non-small cell lung cancer: a meta-analysis
- Corresponding Author:
- Jisheng Chen
Pharmaceutical department, the first affiliate’s hospital of Guangdong pharmaceutical university, Guangzhou, China
E-mail: cjslym@163.com
Abstract
Aim: To evaluate the efficacy and safety of Icotinib in the treatment of advanced Non-small Cell Lung Cancer (NSCLC). Design: Comprehensive retrieved PubMed, EMBase, Cochrane Library, CBM, CNKI, Weipu database and Wangfang database. Randomized controlled trials (RCT) about Icotinib (test group) versus Gefitinib or Erlotinib(control group) in the treatment of advanced NSCLC. The quality of included studies was evaluated and Meta-analysis was conducted. Setting: Icotinib, Erlotinib and Gefitinib belong to the first generation of EGFR-TKI. Three are now used in the treatment of advanced non-small cell lung cancer. Results: Totally 10 RCTs were enrolled, involving 1188 patients. Results of Meta-analysis showed there were no significant differences in the overall response rate (OR=1.16, 95%CI(0.90, 1.50), p=0.25), the disease control rate (OR=1.24, 95%CI(0.96, 1.60), p=0.10), the incidence of diarrhea (OR=0.76, 95%CI(0.55, 1.05), p=0.10) and the incidence of hepatic dysfunction(OR=0.45, 95%CI(0.18, 1.12), p=0.09) between 2 groups; the incidence of rash in the Icotinib group was significantly lower than the control group, there was significant difference (OR=0.68, 95%CI(0.52, 0.90), p=0.006). And the cost-effect ratio of Icotinib group has obvious advantages compared with Gefitinib and Erlotinib group. Conclusions: Based on present domestic clinical evidence, the efficacy of Icotinib for advanced NSCLC is comparable to Gefitinib or Erlotinib, but it’s incidence of rash was significantly lower than Gefitinib or Erlotinib, the tolerance of patients from Icotinib group is superior to Gefitinib or Erlotinib. Icotinib has obvious cost advantage and can be used as a routine drug choice for chemotherapy in advanced NSCLC.
Keywords
lung cancer, icotinib, erlotinib, gefitinib
Introduction
Currently, lung cancer has been the malignancy disease with the highest incidence in China, the number of new cases is about 733,000 [1]. However, the incidence is still increasing in recent years, whether in our country or the world, lung cancer has become the highest mortality rate of the tumor. In 184 countries and regions, the incidence of malignancy in China is generally above the middle level. Non-small cell lung cancer (NSCLC) is the most common histological type of lung cancer [2], it accounts for 80-85% of all lung cancer. Now the research on NSCLC is becoming much deeper, especially the gene-guided molecularly targeted therapy tends to superheating. Traditional chemotherapy drugs through the cytotoxic effect to kill the tumor cells, it plays an important role in the comprehensive therapy of various malignant tumors. But it is limited for most solid tumors, such as NSCLC [3].
Epidermal growth factor (EGF) is a kind of polypeptide with a molecular weight of 6.45 × 10³ that binds to epidermal growth factor receptor (EGFR) on the target cell membranes to produce the biological effects. And EGFR is a kind of tyrosine kinase (TK) receptor with a molecular weight of 1.7 × 10⁸. When it binds to EGF to promote TK activation in the receptor, the receptor’s tyrosine residue will be autophosphorylation. And it will provide continuous signal splitting into the cell, causing cell proliferation and differentiation. EGFR is abundant in human tissues and is highly expressed in malignant tumors. The researchers detected EGFR gene mutations in 10-15% of Caucasian NSCLC patients and 30-40% of Asian NSCLC patients. Epidermal growth factor receptor tyrosine kinase inhibitors (EGFR-TKI) plays a role by selectively inhibiting the signal transduction pathway of epidermal growth factor receptor tyrosine kinase (EGFR-TK). ZD1839 is the first molecular targeted drug for NSCLC [4], Japan will be the first official application of the drug in clinical in July, 2002. The IPASS study [5] confirmed gefitinib that the first generation of EGFR-TKI can significantly prolonged PFS (Progress Free Survival) in EGFR mutations lung cancer patients in 2009. And the OPTIMAL study [6] also demonstrated that erlotinib has a good efficacy in targeting people. The above two studies made EGFR-TKI have laid the status for targeting people’s therapy. Icotinib is the first small molecule targeting anti-cancer drug with independent intellectual property rights in China [7]. It was entirely selfdeveloped by the Chinese scientists and cancer clinical experts experienced 8 years, and it is developed and produced by BETTA Pharma. We therefore undertook a meta-analysis with the aim of evaluating the efficacy, safety and economy of icotinib compared with gefitinib or erlotinib for advanced NSCLC.
Methods
Search strategy
We search the following databases without time limitations: PubMed, EMBase, Cochrane Library, CBM, CNKI, Weipu database and Wangfang database. The keywords used for literature search included “Icotinib”, “Conmana”, “NSCLC” and “Randomized controlled trial”. The language of the literature is English and Chinese. Meanwhile, manually retrieve its references for related research.
Inclusion criteria
Studies were deemed eligible if they met the following criteria: (1) the study was designed for randomized controlled trials with limited Chinese and English. (2) The object of study accord with the following terms: Age≥18 years old; pathologically confirmed advanced NSCLC; neoplasm staging is IIIB~IV period; received radiotherapy and chemotherapy but the tumor cannot cure. The patient had a tumor lesion measurable at least. Patients who fail to tolerate chemotherapy or treatment failure of standard chemotherapy regimen. The patient is expected to survive≥8 weeks, and organ function is not severely damaged. Patients were treated with only EGFR-TKI. (3) Intervening measure: Patients in the trial group were treated with icotinib, and patients in the control group were treated with gefitinib or erlotinib. (4) According to Response Evaluation Criteria in Solid Tumors (RECIST) 1.1 [8] to determine efficacy. It includes complete remission (CR), partial remission (PR), stable disease (SD) and progression disease (PD). Outcome indicators include objective response rate (ORR), disease control rate (DCR) and adverse effects rate (AER).
Exclusion criteria
Repeated published literature and the efficacy of the study is not standardized or not specified.
Quality evaluation of literature
The modified Jadad scale was used to evaluate method of the inclusion literature [9]. The specific method is as follow: Appropriate random sequence is 2 points, unclear random sequence is 1 point, and impertinent random sequence is 0 point. Appropriate allocation concealment is 2 points, unclear allocation concealment is 1 point, and impertinent allocation concealment is 0 point [10]. Appropriate blind method is 2 points, unclear blind method is 1 point, and impertinent blind method is 0 point. Described quit and loss to follow-up is 1 point, and not described is 0 point. The total score is 7 points. The literature that is 1~3 point has a low quality; it poses a greater risk of bias. The literature that is 4~7 point has a high quality; it produces less risk of bias [11].
Statistical methods
Using Rev Man 5.3 to make a Metaanalysis, enumeration data use odds ratio (OR) to analysis, measurement data use relative risk (RR) and its 95%CI is effect analysis statistics and drawing the forest map.
First, making heterogeneity test to inclusion literature by Chi-square Test. If the result doesn’t have heterogeneity (p>0.1 or I225%), the Meta analysis used fixed effect model. If the result have heterogeneity (I2>50% or p<0.1 and I2>25%), finding why the heterogeneity could be produce, if it doesn’t have obvious clinical heterogeneity the Meta analysis used random effects model [12-15].
If the data from inclusion literature can’t make Meta-analysis, then just do descriptive qualitative analysis for it.
Results
Basic information of inclusion literature
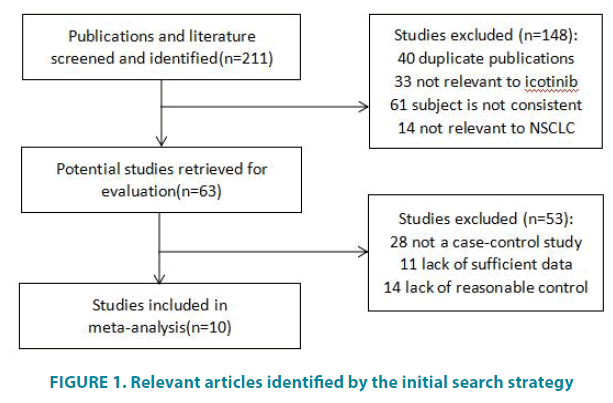
Of 211 potentially relevant articles identified by the initial search strategy, 10 eligible articles were eventually retained in the meta-analysis (FIGURE 1). There are 9 literatures in Chinese and 1 in English all from China. The basic information of inclusion literature is shown in TABLE 1.
Figure 1: Relevant articles identified by the initial search strategy
| Inclusion literature | n | neoplasm staging | intervening measure | follow-up time | ||
|---|---|---|---|---|---|---|
| experimental group | control group | experimental group | control group | |||
| Xu LJ, 2015[10] | 40 | 40 | IV | take Icotinib 125mg orally, 3 times a day | take Gefitinib 250mg orally, once a day | 13 months |
| Li RJ, 2016[11] | 42 | 42 | IIIb~IV | take Icotinib 125mg orally, 3 times a day | Take Erlotinib 100mg orally, once a day | not described |
| Shi Y, 2016[12] | 80 | 70 | IIIb~IV | take Icotinib 125mg orally, 3 times a day | take Gefitinib 250mg orally, once a day | 24 months |
| Chen JH 2012[13] | 14 | 14 | IIIb~IV | take Icotinib 125mg orally, 3 times a day | take Gefitinib 250mg orally, once a day | not described |
| Huang Y 2014[14] | 13 | 13 | IV | take Icotinib 125mg orally, 3 times a day | Take Erlotinib 100mg orally, once a day | not described |
| Xia J 2015[15] | 126 | 93 | IIIb~IV | take Icotinib 125mg orally, 3 times a day | take Gefitinib 250mg orally, once a day | not described |
| Ji CD 2017[16] | 45 | 45 | IIIb~IV | take Icotinib 125mg orally, 3 times a day | take Gefitinib 250mg orally, once a day | not described |
| Sun Y 2016[17] | 34 | 34 | IV | take Icotinib 125mg orally, 3 times a day | take Gefitinib 250mg orally, once a day | not described |
| Lin WX 2014[18] | 24 | 24 | IIIb~IV | take Icotinib 125mg orally, 3 times a day | take Gefitinib 250mg orally, once a day | not described |
| Shi YK 2013[19] | 199 | 196 | IIIb~IV | take Icotinib 125mg orally, 3 times a day | take Gefitinib 250mg orally, once a day | not described |
Table 1: General information of included studies.
Result of Meta-analysis
Overall response rate
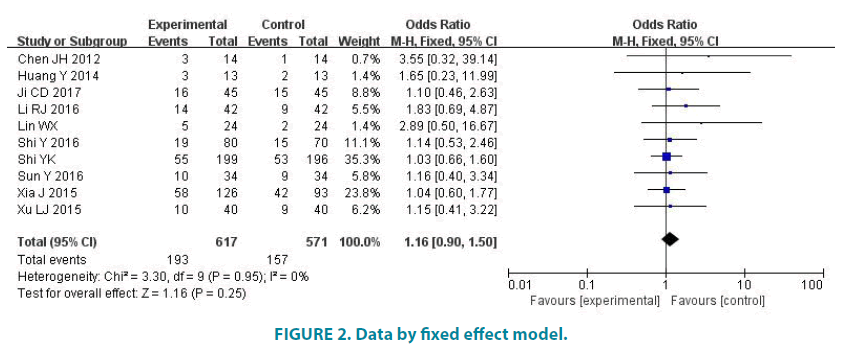
10 studies (1188 patients) reported the overall response rate. Experimental group had 617 patients and control group had 571 patients. Average overall response rate of experimental group is 31.28%, and average overall response rate of control group is 27.50%. There was no statistic difference in the studies (p=0.95, I2=0). So we analyze data by fixed effect model (FIGURE 2). Meta-analysis showed that there was no statistic difference in the overall response rate of the two groups (OR=1.16, 95% CI (0.90, 1.50), p=0.25).
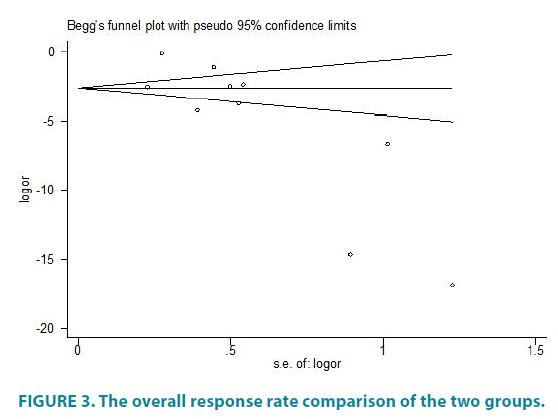
We use the Egger method of Stata to evaluate the prevalence of the overall response rate. FIGURE 3 shows the overall response rate comparison of the two groups. We made symmetry test to FIGURE 3(p> |t|=0.018) and the result shows there has some publication bias TABLE 2.
| Inclusion literature | random method | allocation concealment | blind method | quit and loss to follow-up | Jadad grade |
|---|---|---|---|---|---|
| Xu LJ, 2015[10] | 1 | 1 | 2 | 1 | 5 |
| Li RJ, 2016[11] | 1 | 1 | 2 | 0 | 4 |
| Shi Y, 2016[12] | 2 | 1 | 2 | 1 | 6 |
| Chen JH, 2012[13] | 2 | 2 | 2 | 1 | 7 |
| Huang Y, 2014[14] | 1 | 1 | 1 | 0 | 3 |
| Xia J, 2015[15] | 1 | 1 | 2 | 1 | 5 |
| Ji CD 2017[16] | 2 | 1 | 2 | 0 | 5 |
| Sun Y 2016[17] | 2 | 1 | 2 | 0 | 5 |
| Lin WX 2014[18] | 1 | 1 | 1 | 1 | 4 |
| Shi YK 2013[19] | 2 | 2 | 2 | 1 | 7 |
Table 2: Methodological quality evaluation results of included studies.
Disease control rate
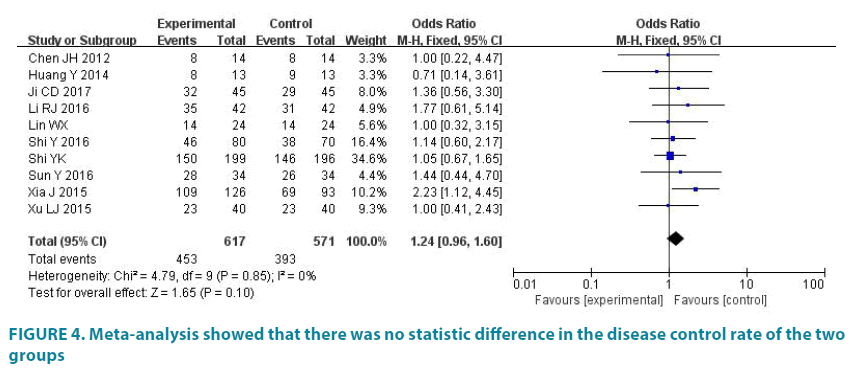
10 studies (1188 patients) reported the disease control rate. Experimental group had 617 patients and control group had 571 patients. Average disease control rate of experimental group is 73.42%, and average disease control rate of control group is 68.83%. There was no statistic difference in the studies (p=0.85, I2=0). So we analyze data by fixed effect model (FIGURE 4). Meta-analysis showed that there was no statistic difference in the disease control rate of the two groups (OR=1.24, 95% CI (0.96, 1.60), p=0.10).
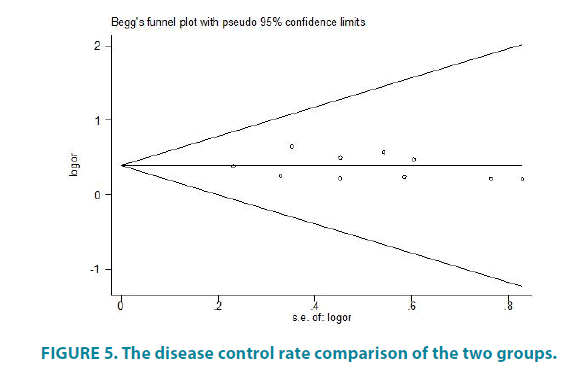
We use the Egger method of Stata to evaluate the prevalence of the disease control rate. FIGURE 5 shows the disease control rate comparison of the two groups. We made symmetry test to FIGURE 5 (p> |t|=0.716>0.05) and the result shows there has no publication bias.
The incidence of rash
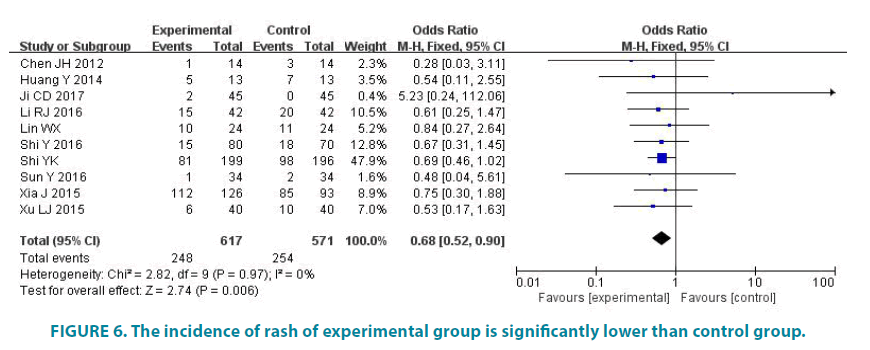
10 studies (1188 patients) reported the incidence of rash. Experimental group had 617 patients and control group had 571 patients. Average disease control rate of experimental group is 40.19%, and average disease control rate of control group is 44.48%. There was no statistic difference in the studies (p=0.97, I2=0). So we analyze data by fixed effect model (FIGURE 6). Meta-analysis showed that the incidence of rash of experimental group is significantly lower than control group, the difference was statistically significant (OR=0.68, 95% CI (0.52, 0.90), p=0.006).
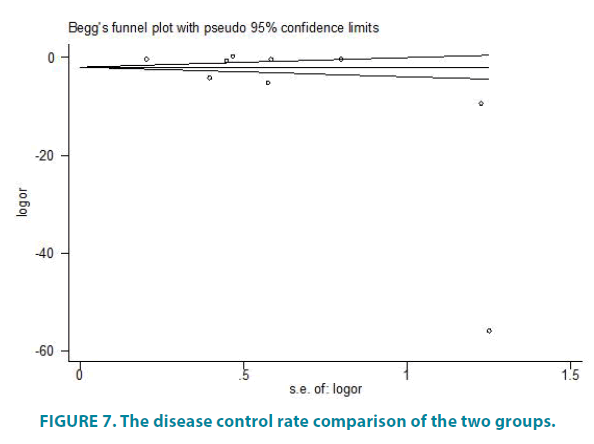
We use the Egger method of Stata to evaluate the prevalence of the the incidence of rash. FIGURE 7 shows the disease control rate comparison of the two groups. We made symmetry test to FIGURE 7(p> |t|=0.100>0.05) and the result shows there has no publication bias.
The incidence of diarrhea
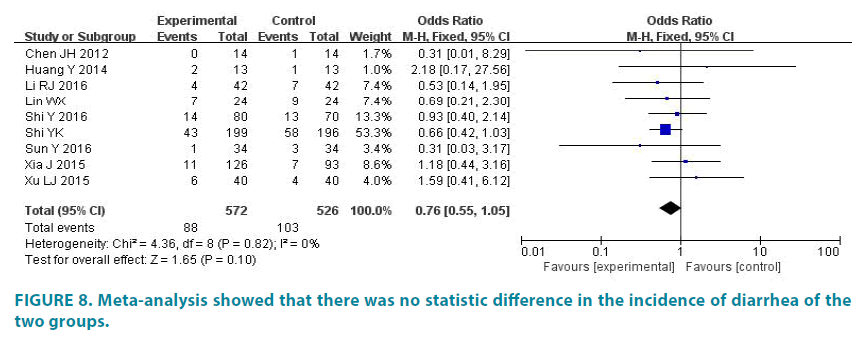
9 studies (1098 patients) reported the incidence of diarrhea. Experimental group had 572 patients and control group had 526 patients. The average incidence of diarrhea of experimental group is 15.38%, and the average incidence of diarrhea of control group is 19.58%. There was no statistic difference in the studies (p=0.82, I2=0). So we analyze data by fixed effect model (FIGURE 8). Meta-analysis showed that there was no statistic difference in the incidence of diarrhea of the two groups (OR=0.76, 95% CI (0.55, 1.05), p=0.10).
The incidence of hepatic dysfunction
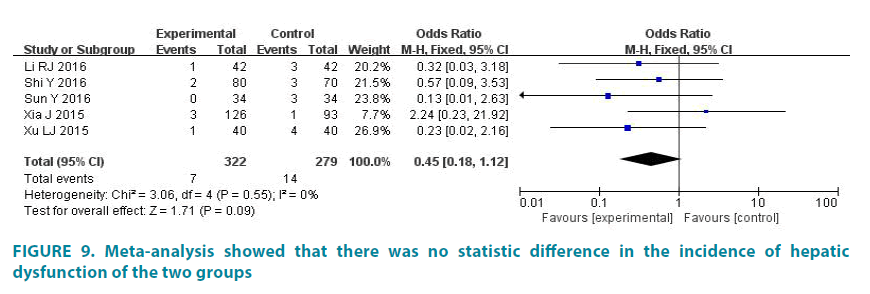
5 studies (601 patients) reported the incidence of hepatic dysfunction. Experimental group had 322 patients and control group had 279 patients [16]. The average incidence of hepatic dysfunction of experimental group is 2.17%, and the average incidence of hepatic dysfunction of control group is 5.02%. There was no statistic difference in the studies (p=0.55, I2=0). So we analyze data by fixed effect model (FIGURE 9). Meta-analysis showed that there was no statistic difference in the incidence of hepatic dysfunction of the two groups (OR=0.45, 95% CI (0.18, 1.12), p=0.09) [17,18].
Cost-effectiveness analysis
Cost estimation
Referring to the cost model of Novello [19,20], the direct clinical costs include the cost of drug, hospitalization, concomitant medications and adverse events. Because Icotinib, Gefitinib and Erlotinib are oral target drugs, and it has no corresponding cycles of chemotherapy, so there is no corresponding hospitalization and delivery costs. This study assumes that there is no significant difference in the cost of adverse reactions, concomitant medication and laboratory examination cost of three kinds of drugs, so that the cost of drugs is used as the evaluation index. The drug reference price is shown in TABLE 3.
| drug name | manufacturer | specification | dosage | reference price | data sources |
|---|---|---|---|---|---|
| Icotinib(Conmana) | BETTA | 125mg*21 tablet | 125mg, po, tid | ¥1399.00 | www.yaofang.cn |
| Gefitinib(Iressa) | AstraZeneca | 250mg*10 tablet | 250mg, po, qd | ¥2699.00 | www.yaofang.cn |
| Erlotinib(Tarceva) | Roche | 150mg*7 tablet | 150mg, po, qd | ¥4390.00 | www.yaofang.cn |
Table 3: Drug reference price
Overall response rate as an indicator of effectiveness
The total cost of three drugs for 8 weeks was analyzed and calculated. Icotinib is 11192.00 ¥/8 weeks, Gefitinib is 15114.40 ¥/8 weeks and Erlotinib is 35120.00 ¥/8 weeks. The overall response rate of Icotinib group is 31.28%. The overall response rate of Geifinib group is 28.29%. The overall response rate of Erlotinib group is 20.00%. The results showed that the lowest cost of unit effectiveness was 35780.05 Yuan for the Icotinib group. Compared with the Icotinib group, the Gefitinib group and the Erlotinib Group were more expensive and less effective, all of which were inferior (TABLE 4).
| program | Cost(Yuan) | effectiveness | cost-effectiveness ratio(C/E) | incremental cost-effectiveness ratio(ICER) |
|---|---|---|---|---|
| Icotinib | 11192.00 | 31.28% | 35780.05 | \ |
| Gefitinib | 15114.40 | 28.29% | 53426.65 | inferior |
| Erlotinib | 35120.00 | 20.00% | 175600.00 | inferior |
Table 4: The cost-effectiveness analysis of overall response rate as an effect index
Disease control rate as an indicator of effectiveness
The disease control rate of Icotinib group is 74.09%. The disease control rate of Geifinib group is 68.41%. The disease control rate of Erlotinib group is 72.73%. The results showed that the lowest cost of unit effectiveness was 15243.80 Yuan for the Icotinib group. Compared with the Icotinib group, the Gefitinib group and the Erlotinib Group were more expensive and less effective, all of which were inferior (TABLE 5).
| program | cost(Yuan) | effectiveness | cost-effectiveness ratio(C/E) | incremental cost-effectiveness ratio(ICER) |
|---|---|---|---|---|
| Icotinib | 11192.00 | 73.42% | 15243.80 | \ |
| Gefitinib | 15114.40 | 68.41% | 22093.85 | inferior |
| Erlotinib | 35120.00 | 72.73% | 48288.19 | inferior |
Table 5: The cost-effectiveness analysis of disease control rate as an effect index
Sensitivity analysis
In this study, we used different analysis models and statistical analysis technique to make sensitivity analysis for Meta-analysis results of the overall response rate, disease control rate, the incidence of rash and the incidence of diarrhea (TABLE 6). Used Rev Man 5.3 to analysis with fixed effect model and random effects model, the results of the combined OR, RR and 95% CI were consistent with the results of the metaanalysis. This indicates that the results of the Meta analysis are stable.
| OR | RR | ||||
|---|---|---|---|---|---|
| fixed effect model | random effects model | fixed effect model | random effects model | ||
| Peto method | M-H method | M-H method | M-H method | M-H method | |
| overall response rate | OR=1.15, 95%CI(0.89, 1.49), p=0.25 | OR=1.16, 95%CI(0.90, 1.50), p=0.25 | OR=1.16, 95%CI(0.90, 1.50), p=0.26 | RR=1.10, 95%CI(0.93, 1.31), p=0.25 | RR=1.09, 95%CI(0.92, 1.30), p=0.32 |
| disease control rate | OR=1.24, 95%CI(0.96, 1.60), p=0.10 | OR=1.24, 95%CI(0.96, 1.60), p=0.10 | OR=1.24, 95%CI(0.96, 1.61), p=0.10 | RR=1.06, 95%CI(0.99, 1.14), p=0.10 | RR=1.07, 95%CI(1.00, 1.15), p=0.09 |
| the incidence of rash | OR=0.68, 95%CI(0.52, 0.90), p=0.006 | OR=0.68, 95%CI(0.52, 0.90), p=0.006 | OR=0.67, 95%CI(0.51, 0.89), p=0.006 | RR=0.85, 95%CI(0.76, 0.96), p=0.006 | RR=0.86, 95%CI(0.73, 1.01), p=0.007 |
| the incidence of diarrhea | OR=0.76, 95%CI(0.56,1.05), p=0.10 | OR=0.76, 95%CI(0.55, 1.05), p=0.10 | OR=0.72, 95%CI(0.52, 0.99), p=0.11 | RR=0.81, 95%CI(0.63, 1.04), p=0.10 | RR=0.80, 95%CI(0.62, 1.04), p=0.09 |
| the incidence of hepatic dysfunction | OR=0.46, 95%CI(0.19, 1.09), p=0.08 | OR=0.45, 95%CI(0.18, 1.12), p=0.09 | OR=0.47, 95%CI(0.17, 1.28), p=0.14 | RR=0.47, 95%CI(0.19, 1.14), p=0.09 | RR=0.48, 95%CI(0.18, 1.28), p=0.14 |
Table 6: Sensitivity analysis results I.
We deleted the literature that score less than 5 and made Meta-analysis. The results (TABLE 7) were consistent with the results of the Metaanalysis. This indicates that the results of the Meta analysis are stable.
| Item | Quantity of literature | Quantity of patients | Heterogeneity evaluation | Result | Statistical results | validation of the results |
|---|---|---|---|---|---|---|
| overall response rate | 7[10, 12-13, 15-17, 19] | 538 | p=1.00, I2=0 | 31.78% | OR=1.09, 95%CI(0.83, 1.43), p=0.54 | accordance |
| 492 | 29.27% | |||||
| disease control rate | 7[10, 12-13, 15-17, 19] | 538 | p=0.71, I2=0 | 73.61% | OR=1.25, 95%CI(0.95, 1.64), p=0.12 | accordance |
| 493 | 68.90% | |||||
| the incidence of rash | 7[10, 12-13, 15-17, 19] | 538 | p=0.86, I2=0 | 40.52% | OR=0.68, 95%CI(0.50, 0.93), p=0.02 | accordance |
| 492 | 43.90% | |||||
| the incidence of diarrhea | 6[10, 12-13, 15, 17, 19] | 493 | p=1.00, I2=0 | 15.21% | OR=0.78, 95%CI(0.55, 1.10), p=0.15 | accordance |
| 447 | 19.24% | |||||
| the incidence of hepatic dysfunction | 4[10, 12, 15, 17] | 280 | p=1.00, I2=0 | 2.14% | OR=0.49, 95%CI(0.18, 1.31), p=0.15 | accordance |
| 237 | 4.64% |
Table 7: Sensitivity analysis results II
Discussion
This study comprehensively incorporates the RCTs of domestic Icotinib versus Gefitinib or Erlotinib in the treatment of NSCLC. Metaanalysis showed that the overall response rate, the disease control rate and the incidence of rash of Icotinib treatment of NSCLC were all the same as that of Gefitinib and Erlotinib, and the incidence of rash in Icotinib treatment of NSCLC was significantly lower than that of Gefitinib and Erlotinib. Considering two factors of cost and effectiveness synthetically, the cost-effectiveness ratio of three kinds of drug programs is calculated by using cost-effectiveness analysis method. The results showed that both the overall response rate and the disease control rate as the effect index, the Icotinib has the absolute cost advantage, its short-term economy is better, can be used as the conventional drug choice for advanced NSCLC chemotherapy.
There are some deficiencies in the methodological quality of the included research: most of the studies have simply described the random method as "randomly divided", without indicating the method of generating random sequences, and it is impossible to determine whether the random distribution scheme is hidden and prone to selectivity bias.
However, the study reported that the Icotinib group was consistent with the baseline of the control group, and that the results of the study were consistent with each other, so the results were less affected.
The goal of advanced NSCLC is to improve the patient's survival time and quality of life, and to reduce the patient's pain. Although traditional chemotherapy can inhibit tumor growth to a certain extent, the large toxicity and side effects increase the patient's pain, but shorten the survival time of some patients. Gefitinib and Erlotinib have a definite effect on the treatment of advanced NSCLC, but they are expensive and have obvious side effects.
Conclusion
Icotinib hydrochloride as the 3rd globally approved EGFR-TKI drug, the mechanism is in line with the previous Gefitinib and Erlotinib [21], but three kinds of drugs are different in structure, pharmacokinetics and so on, which leads to a slight difference in efficacy and safety, and the safety of Icotinib is better. This advantage provides us with research space for more clinical research, which provides a basis for the exploration of the dose doubling of the patients with advanced NSCLC with conventional doses of SD or EGFR genes.
References
- Chen WQ, Zheng RS, Zhang SW, et al. Report of Cancer Incidence and Mortality in China. China Cancer. 25(1), 1-8 (2015).
- Song Y, Yang W. Medical treatment of advanced non-small cell lung cancer: progress in. Med. J. Chinese People’s Liberation Army. 40(1), 10-15 (2015).
- Zhang YH, Ning H, Jiang Y. Gefitinib, an epidermal growth factor receptor tyrosine kinase inhibitor. Chinese J. New Drugs. 13(10), 947-950 (2004).
- Herbst R, Kies M. ZD1839 (Iressa (TM) in non-small cell lung cancer. Oncolog. 7(4), 9-15 (2002).
- Mok TS, Wu YL, Thongprasert S, et al. Gefitinib or carboplatin-paclitaxel in pulmonary adenocarcinoma. N. Engl. J. Medicine 361(10), 947-957 (2009).
- Zhou C, Wu Y, Chen G, et al. Erlotinib versus chemotherapy as first-line treatment for patients with advanced EGFR mutation-positive non-small-cell lung cancer (OPTIMAL, CTONG-0802): a multicentre, open-label, randomised, phase 3 study. J. Lancet Oncol. 12(8), 735-742 (2011).
- Tan FL, Zhang L, Zhao Q, et al. Pharmacology and clinical evaluation of icotinib hydrochloride. Chinese J. New Drugs. 18(2), 1691-1694 (2009).
- E.A. Eisenhauer, Therasse P, Bogaerts J, et al. New response evaluation criteria in solid tumours: Revised RECIST guideline (version 1.1). Eur. J. Cancer. 45(2), 228-247 (2009).
- Ma J, Liu Y, Zhong LP, et al. Comparison between Jadad scale and Cochrane collaboration’s tool for assessing risk of bias on the quality and risk of bias evaluation in randomized controlled trials. China J. Oral Maxil. Surg. 10(5), 417-422 (2012).
- Xu LJ, Liu H, Li J, et al. Clinical Observation of Icotinib and Gefitinib in First-line Therapy for advanced non-small cell lung cancer. J. Hunan Normal Univ. 6(5), 94-97 (2015).
- Li RJ. Comparison of therapeutic effects between Icotinib and Erlotinib in the treatment of advanced non-small cell lung cancer. China Pract. Med. 7(3), 136-137 (2016).
- Shi Y, Liu ZB, Liu JH, et al. Contrastive study on security and quality of life of elderly non-small cell lung cancer treated by Icotinib and Gefitinib. J. Clin. Exp. Med. 15(23), 2316-2319 (2016).
- Chen JH, Luo YZ Wang W, et al. Efficacy and toxicity of ecotinib and gefitinib in the treatment for 28 patients with non-small cell lung cancer who have failed previous chemotherapy. Chinese J. New Drugs. 17(2), 2056-2059 (2012).
- Huang Y. Clinical observation of Icotinib hydrochloride and Erlotinib in the treatment of patients with advanced lung cancer who failed previous chemotherapy. China Foreign Med. Treat. 33(6), 8-9 (2014).
- Xia J, Si RR, Wu YF. Clinical research on icotinib hydrochloride in the treatment of advanced non-small cell lung cancer. J. Basic Clin. Oncol. 37(3), 210-212 (2015).
- Ji CD, Yu XQ, Lai YX. Hydrochloric acid treatment for ek, EGFR mutation status clear advanced non-small cell lung cancer clinical observation. J. Hebei Med. 23(1), 100-102(2017).
- Sun Y. Clinical analysis of Icotinib in treatment of epidermal growth factor receptor sensitive mutations in advanced non-small cell lung cancer benefit. China Modern Medicine. 23(30), 59-61(2016).
- Lin WX, Zhang LJ. Therapeutic effect of Icotinib on non-small cell lung cancer. Chinese J. Pri. Med. Pharm. 21(1), 513-519 (2014).
- Shi Y, Zhang L, Liu X, et al. Icotinib versus gefitinib in previously treated advanced non-small-cell lung cancer (ICOGEN): a randomised, double-blind phase 3 non-inferiority trials. Lancet Oncol. 14(10), 953-961 (2013).
- Novello S, Kielhorn A, Stynes G, et al. Cost-minimisation analysiscomparing gemcitabine/cisplatin, paclitaxel/carboplatin andvinorelbine/cisplatin in the treatment of advanced non-small cell lung cancer in Italy. Lung Cancer. 48(3), 379-387 (2005).
- Shi Y. Expert consensus on clinical use Icotinib hydrochloride (Conmana) in China. Chinese J. New Drugs. 6(2), 124-126(2012).
