Research Article - Interventional Cardiology (2015) Volume 7, Issue 5
Evaluation of the North West Quality Improvement Programme risk prediction model as a 30-day mortality predictor
- Corresponding Author:
- John R Davies
The Essex Cardiothoracic Centre
Basildon University Hospital
NHS Foundation Trust Nethermayne, Basildon
Essex, SS16 5NL, UK
E-mail: John.Davies@btuh.nhs.uk
Abstract
Aim: Externally validate North West Quality Improvement Programme (NWQIP) risk model for complications following percutaneous coronary intervention (PCI); develop a 30-day mortality prediction model. Patients & methods: Retrospective analysis of 9279 PCI procedures from 2007 to 2012 in South East England. NWQIP discrimination and calibration was assessed for in-hospital complications and 30-day mortality. A risk model was created using logistic regression. Results: The receiver operating characteristic curve for NWQIP was 0.86; however, calibration was poor (p = 0.03). The custom receiver operating characteristic curve was 0.88 (p = 0.67). Ventilation and peripheral vascular disease were novel predictors. Conclusion: NWQIP discriminates well. However, changing demographics, comorbidities and increasingly frequent high-risk PCI procedures produce poor calibration. A model for 30-day mortality is proposed yielding good discrimination and calibration.
Keywords
30-day mortality, major adverse cardiac event (MACE), North West Quality Improvement Programme (NWQIP), risk model
Coronary heart disease is the most common cause of morbidity and mortality in the UK [1-2]. The number of patients in the UK with coronary heart disease that undergo revascularization in the form of percutaneous coronary intervention (PCI) has risen year-on-year over the past two decades from approximately 10,000 PCIs in 1991 to over 92,500 in 2013 [3].
Whether patients receive PCI for low risk indications such as stable angina, or highrisk conditions such as ST-elevation myocardial infarction (STEMI), it is vital to have a framework in place to predict important outcomes such as major adverse cardiac events (MACEs) and mortality, typically at 30 days following their PCI procedure. With the advent of the national publication of individual operator outcomes [4], the need for a robust prediction model is now essential. Multivariate prediction models [5-12] have several important uses: provision of a framework for comparing outcomes between hospitals, operators and patient populations; assist in decision making for clinicians and patients; help ensure high standards of quality for patient care are being met; potential to detect adverse practices and whether treatment is being avoided to artificially reduce mortality rates.
In the UK, the North West Quality Improvement Programme (NWQIP) risk prediction model [5] for in-hospital MACE is the most commonly used model for the UK National PCI audit as conducted by the British Cardiovascular Intervention Society (BCIS). The NWQIP model study (2001– 03, 9914 patients) published in 2006, and subsequently externally validated (2002–06, 5034 patients) [6] in 2007 has several limitations, for which further validation of the model is warranted. First, in the modern era, PCI is more commonly performed as an emergency procedure in higher risk patients such as those with cardiogenic shock, and following out-of-hospital cardiac arrest. Second, the PCI techniques and adjunctive pharmacological therapies have evolved since the inception of NWQIP. Finally, reporting in-hospital MACE is reliant on accurate and timely identification of complications, which inevitably will lead to some data inaccuracies, especially when patients are transferred out of tertiary cardiac centers to district general hospitals following their procedure. Despite the external validation study [6] reporting improved discrimination and calibration in a different geographic population, it is anticipated that trends in comorbidities and increasing percentages of emergency procedures being performed, may negatively affect the performance of NWQIP in modern PCI cohorts.
In this study, by analyzing our contemporary PCI database we set out to test the performance of NWQIP both for its ability to predict MACE and the more robust and informative outcome of 30-day mortality. We then sought to improve the model by identifying the independent predictors of 30-day mortality and to subsequently produce a risk model that is fit for purpose for modern PCI procedures and patient demographics in the UK.
Patients & methods
Database & study population
This study was a retrospective cohort study of prospectively collected data from a comprehensive cardiovascular patient information database (CVIS, Philips). Data were collected for all patients undergoing PCI at the Essex Cardiothoracic Centre (ECTC) at Basildon and Thurrock NHS University Hospital from 1 July 2007 to 31 January 2015. The ECTC is a tertiary cardiac referral center serving a population of approximately 1.7 million in the south east of England. The ECTC performs approximately 3000 PCI procedures each year, including elective, urgent and emergency priorities. Each procedure record contains a core set of information relating to patient demographics, clinical, angiographic and procedural characteristics. Outcome data including complications and mortality details are also recorded, for which the latter is updated within at least 1 month following the death of a former PCI patient. The dataset is based on that specified by the BCIS [13]. Procedure records are populated by PCI operators following treatment with additional details being inserted by trained doctors and nurses. In modern practice, records are assessed for completeness and flagged for missing or erroneous information.
The entire dataset comprises 13,938 consecutive PCI procedures. A number of these (540, 3.9%) contained missing data for either a NWQIP risk factor (left main stem lesion, graft lesion, cerebrovascular disease or priority), a custom model risk factor, or outcome data (inhospital complications or 30-day mortality) and consequently had to be excluded from analysis. The number of retained records was 13,398. Repeat PCI procedures occurring within 30 days of the initial procedure were also excluded.
The resulting cohort was split into a training set and validation set (approximately 2:1 ratio) based on the date of the procedure. The training set contained 9279 PCIs from 1 July 2007 to 31 December 2012. The validation set featured 4119 PCIs from 1 January 2013 to 31 January 2015.
Characteristics in the database included age; sex; cardiogenic shock (preprocedural); PCI priority (elective – routine admission after having been on a waiting list; urgent – patient has not been scheduled for routine admission but requires urgent intervention within the current admission and the patient cannot be sent home without procedure and emergency – the admission itself is unplanned and the patient requires immediate intervention); previous myocardial infarction/ coronary artery bypass graft/PCI; hypertension; hypercholesterolemia; diabetes; chronic obstructive pulmonary disease; peripheral vascular disease (PVD); intervention indication; clinical syndrome; angina status (Canadian Cardiovascular Society classification); valvular heart disease; left ventricle ejection fraction (LVEF); ventilated (preoperation); cerebrovascular disease; renal disease (a previously diagnosed intrinsic pathology with abnormal creatinine clearance or estimated glomerular filtration rate); renal dysfunction (abnormal levels of GFR/estimated glomerular filtration rate or creatinine clearance but which have not previously been diagnosed); glycoprotein inhibitor usage and other pre-/post-treatment drugs administered; number, type and location of lesions; thrombolysis in myocardial infarction (TIMI) flow grade; technical details of stents used; chronic total occlusions; multiple vessel PCI; stenosis percentages of coronary arteries and procedural/post-procedural complications.
External validation of North West Quality Improvement Programme
The reported logistic regression coefficients from the NWQIP risk model were used to calculate the predicted probability of in-hospital MACEs (Appendix). Subsequent validation was then performed using the area under the receiver operating characteristic (ROC) curve [14] for assessing the discrimination performance. The calibration, which is a measure of fit between observed and predicted outcomes for different groups, was assessed using the Hosmer-Lemeshow goodness of fit test [15]. First, we tested the performance using the MACE outcome, defined as the occurrence of at least one of the following: in-hospital death (during the same administration of the PCI regardless of the cause); emergency coronary artery bypass graft surgery (CABG); Q-wave myocardial infarction, defined as a new pathological Q wave with creatine kinase (CK) more than twice the laboratory upper limit, or normal with elevated CK-MB or troponin T [13]; cerebrovascular accident. Second, we used the estimated probabilities with the 30-day mortality outcome, defined as death from any cause up to and including 30 days from the date of the index PCI procedure. For deaths which occur within the 30-day period but following discharge, these are reported by a national data source, linked HES-ONS (Hospital Episode Statistics; Office for National Statistics) mortality which tracks patient deaths and is updated internally on a monthly basis.
Statistical methods
Continuous variables are expressed using mean values and standard deviation (SD), and discrete variables are represented as a percentage. Univariate analysis was performed to identify the variables in our dataset that were significantly associated (p < 0.05) with 30-day mortality. Nominal variables were analyzed using chi-square tests or Fisher’s exact test where appropriate, continuous data were tested using the Student’s t-test. The odds ratios, corresponding 95% confidence limits, and significance were calculated for each variable. The significant variables, in addition to those considered clinically important predictors were used as candidates for entry into a multivariate logistic regression model using backward selection. The candidate variables which retained a significance of p < 0.05 were used in the final model. The bootstrap resampling technique [16] was used to generate relatively unbiased approximations of the predictive performance by using 200 random samples with replacement from 70% of the training set.
In several PCI risk models [6-7,10-12] an additive integer scoring system has been adopted to act as a simple bedside tool for clinicians, allowing a more convenient way to gauge a patient’s risk. An integer is assigned to each risk factor in the model based closely on the odds ratio. A similar scoring system was used in this study and patients were then classified into one of five risk groups based on the total integer score (very low, 0–9; low, 10–14; moderate, 15–19; high, 20–24 and very high, ≥ 25).
To detect possible multicollinearity between variables in the regression model, we calculated the variance inflation factor and tolerance for each variable, a variance inflation factor ≥ 4.0 and/or a tolerance < 0.2 were considered indicators for concern.
Data were analyzed using the statistical analysis software SPSS for Windows release 20.0.0 (IBM Corp, NY, USA).
Results
Outcomes
In the training set (9279 PCIs) there were 128 (1.4%) complications under the composite classification of MACE, including 96 (1.0%) deaths, 20 (0.2%) Q-wave myocardial infarctions, 10 (0.1%) emergency CABGs and 6 (<0.1%) cerebrovascular accidents. The complications were not mutually exclusive, however, the majority of patients exhibiting MACE did only develop a single type. Mortality within 30 days of the PCI procedure occurred in 197 (2.1%) of patients, within this end point, 101 (1.1%) died following discharge but within the 30-day period. Of these, 36 died within 7 days of being discharged.
The mean age (SD) of the cohort was 65.5 (11.9) years, 7232 (74.9%) were male. The most common indication for intervention as categorized by the BCIS specification [13] was stable angina (4053, 43.7%), followed by ‘Unstable angina/NSTEMI/convalescent STEMI’ (3043, 32.8%), and primary PCI (2028, 21.9%). Two hundred twenty-six (2.4%) were in cardiogenic shock prior to the PCI, and 113 (1.2%) were ventilated preoperation.
Univariate associations with MACE
The odds ratios (and p-values) for the demographic and clinical characteristics which exhibited a significant association with in-hospital MACE were ages 70–79 years: 2.94 (0.008); ages ≥80 years: 5.97 (<0.001); female sex: 2.70 (<0.001); PVD: 2.94 (<0.001); renal disease: 2.13 (0.004); prior CABG: 0.3 (0.030); emergency PCI: 7.87 (<0.001); cerebrovascular disease: 3.22 (<0.001); cardiogenic shock: 27.29 (<0.001); preoperation ventilation: 19.10 (<0.001). The significant procedural and angiographic characteristics were LVEF 30–50%: 2.78 (0.002); LVEF < 30%: 20.35 (<0.001), TIMI flow grade < 3: 3.59 (<0.001) and left main stem lesions: 2.75 (0.008).
Univariate associations with 30-day mortality
The baseline demographic and clinical characteristics from the training set are displayed in Table 1, the procedural and angiographic characteristics are shown in Table 2. Both tables display the associations with the 30-day mortality outcome, including odds ratios and confidence intervals. The patient percentage column is relative to records which are not missing. The significant characteristics identified as candidates for entry into regression analysis were age (grouped by decade), sex, diabetes, PVD, renal disease, renal dysfunction, prior CABG, prior PCI, priority, cerebrovascular disease, cardiogenic shock, chronic obstructive pulmonary disease, preoperation ventilation and left main stem lesions. Despite LVEF and TIMI flow grade showing a significant association and a high odds ratio, these were excluded due to the large percentage of missing/blank data, which were 34.5 and 72.9%, respectively.
| Variable | Patients | Patients (%) | 30-day (count) | 30-day (%) | OR (95% CI) | p-value | Missing |
|---|---|---|---|---|---|---|---|
| Age (years) | 0 | ||||||
| <50 | 1007 | 10.4 | 8 | 0.8 | Reference | ||
| 50–59 | 1897 | 19.6 | 11 | 0.6 | 0.73 (0.29 to 1.82) | 0.497 | |
| 60–69 | 3004 | 31.1 | 46 | 1.5 | 1.94 (0.91 to 4.13) | 0.085 | |
| 70–79 | 2583 | 26.7 | 67 | 2.6 | 3.33 (1.59 to 6.95) | 0.001 | |
| ≥80 | 1171 | 12.1 | 82 | 7.0 | 9.40 (4.53 to 19.53) | <0.001 | |
| Sex | 2 | ||||||
| Male | 7232 | 74.9 | 122 | 1.7 | Reference | ||
| Female | 2428 | 25.1 | 92 | 3.8 | 2.23 (1.74 to 3.02) | <0.001 | |
| Diabetes | 299 | ||||||
| No | 7736 | 82.6 | 149 | 1.9 | Reference | ||
| Yes | 1627 | 17.4 | 44 | 2.7 | 1.42 (1.01 to 1.99) | 0.045 | |
| Hypertension | 375 | ||||||
| No | 4106 | 44.2 | 91 | 2.2 | Reference | ||
| Yes | 5181 | 55.8 | 113 | 2.2 | 0.98 (0.74 to 1.30) | 0.908 | |
| PVD | 375 | ||||||
| No | 8951 | 96.4 | 185 | 2.1 | Reference | ||
| Yes | 336 | 3.6 | 19 | 5.7 | 2.84 (1.75 to 4.61) | <0.001 | |
| Renal disease | 1731 | ||||||
| No | 6943 | 87.5 | 77 | 1.1 | Reference | ||
| Yes | 988 | 12.5 | 35 | 3.5 | 3.28 (2.18 to 4.91) | <0.001 | |
| Renal dysfunction | 375 | ||||||
| No | 8874 | 95.6 | 189 | 2.1 | Reference | ||
| Yes | 413 | 4.4 | 15 | 3.6 | 1.73 (1.01 to 2.96) | 0.042 | |
| Prior CABG | 98 | ||||||
| No | 8890 | 93.0 | 195 | 2.2 | Reference | ||
| Yes | 674 | 7.0 | 7 | 1.0 | 0.47 (0.22 to 0.99) | 0.044 | |
| Prior MI | 336 | ||||||
| No | 6801 | 72.9 | 143 | 2.1 | Reference | ||
| Yes | 2525 | 27.1 | 49 | 1.9 | 0.92 (0.66 to 1.28) | 0.624 | |
| Prior PCI | |||||||
| No | 7605 | 79.9 | 175 | 2.3 | Reference | 144 | |
| Yes | 1913 | 20.1 | 24 | 1.3 | 0.54 (0.35 to 0.83) | 0.004 | |
| Priority | 0 | ||||||
| Elective | 4260 | 44.1 | 18 | 0.4 | Reference | ||
| Urgent | 2802 | 29.0 | 29 | 1.0 | 2.47 (1.37 to 4.45) | 0.003 | |
| Emergency | 2600 | 26.9 | 167 | 6.4 | 16.18 (9.92 to 26.37) | <0.001 | |
| Cerebrovascular disease | 375 | ||||||
| No | 8927 | 96.1 | 186 | 2.1 | Reference | ||
| Yes | 360 | 3.9 | 18 | 5.0 | 2.47 (1.51 to 4.06) | <0.001 | |
| Cardiogenic shock | 0 | ||||||
| No | 9422 | 97.5 | 143 | 1.5 | Reference | ||
| Yes | 240 | 2.5 | 71 | 29.6 | 27.26 (19.74 to 37.64) | <0.001 | |
| COPD | 375 | ||||||
| No | 8907 | 95.9 | 190 | 2.1 | Reference | ||
| Yes | 380 | 4.1 | 14 | 3.7 | 1.76 (1.01 to 3.05) | 0.043 | |
| VHD | 375 | ||||||
| No | 9192 | 99.0 | 200 | 2.2 | Reference | ||
| Yes | 95 | 1.0 | 4 | 4.2 | 1.98 (0.72 to 5.43) | 0.178 | |
| Ventilated (pre-op) | 0 | ||||||
| No | 9542 | 98.8 | 176 | 1.8 | Reference | ||
| Yes | 120 | 1.2 | 38 | 31.7 | 24.66 (16.33 to 37.26) | <0.001 | |
| Coronary syndrome | 15 | ||||||
| Stable | 4248 | 44.0 | 18 | 0.4 | Reference | ||
| ACS/AMI | 5399 | 56.0 | 196 | 3.6 | 8.85 (5.45 to 14.370) | <0.001 |
ACS: Acute coronary syndrome; AMI: Acute myocardial infarction; CABG: Coronary artery bypass graft; COPD: Chronic obstructive pulmonary disease;
MI: Myocardial infarction; PCI: Percutaneous coronary intervention; PVD: Peripheral vascular disease; VHD: Valvular heart disease.
Table 1: Univariate association of demographic and clinical characteristics with 30-day mortality.
| Variable | Patients | Patients (%) | 30-day (count) | 30-day (%) | OR (95% CI) | p-value | Missing |
|---|---|---|---|---|---|---|---|
| LVEF | 3335 | ||||||
| >50% | 4123 | 65.2 | 17 | 0.4 | Reference | ||
| 30–50% | 1959 | 31.0 | 38 | 1.9 | 4.78 (2.69 to 8.49) | <0.001 | |
| <30% | 245 | 3.9 | 28 | 11.4 | 31.17 (16.80 to 57.81) | <0.001 | |
| TIMI flow | 7044 | ||||||
| 3 | 1005 | 38.4 | 11 | 1.1 | Reference | ||
| <3 | 1613 | 61.6 | 113 | 7.0 | 6.81 (3.65 to 12.71) | <0.001 | |
| Graft lesions | 17 | ||||||
| No | 9407 | 97.5 | 208 | 2.2 | Reference | ||
| Yes | 238 | 2.5 | 6 | 2.5 | 1.14 (0.50 to 2.60) | 0.749 | |
| LMS lesions | 0 | ||||||
| No | 9476 | 98.1 | 203 | 2.1 | Reference | ||
| Yes | 186 | 1.9 | 11 | 5.9 | 2.87 (1.54 to 5.37) | <0.001 | |
| Multivessel PCI | 238 | ||||||
| No | 8043 | 85.3 | 178 | 2.2 | Reference | ||
| Yes | 1381 | 14.7 | 30 | 2.2 | 0.98 (0.66 to 1.45) | 0.924 | |
| CTO | 214 | ||||||
| No | 8763 | 92.7 | 194 | 2.2 | Reference | ||
| Yes | 685 | 7.3 | 18 | 2.6 | 1.19 (0.73 to 1.94) | 0.481 | |
Table 2: Univariate associations of procedural and angiographic characteristics with 30-day mortality.
External validation of North West Quality Improvement Programme
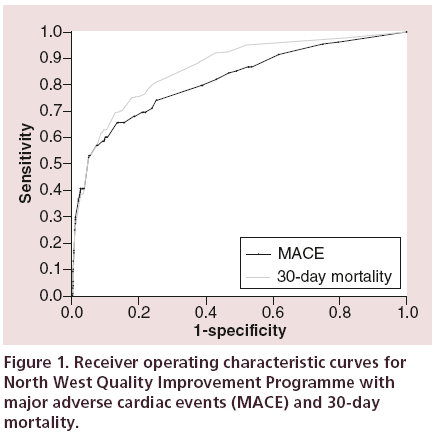
Using the training set, the NWQIP risk model was validated for two separate outcomes, in-hospital MACE and 30-day mortality. For MACE the area under the ROC curve (Figure 1) was 0.817 (SE [standard error] = 0.022, 95% CI: 0.773–0.860). The Hosmer-Lemeshow goodness of fit was significant, p < 0.001 (χ2 = 58.06, degrees of freedom [df] = 6), indicating a major difference between observed and predicted MACE outcomes.
For 30-day mortality the ROC curve (Figure 1) was 0.862 (SE = 0.014, 0.834–0.890), this improvement compared with MACE is not however statistically significant. The calibration, p = 0.028 (χ2 = 14.20, df = 6), was also significant. Despite showing good discrimination for both outcomes, the NWQIP model is poorly calibrated among different risk groups.
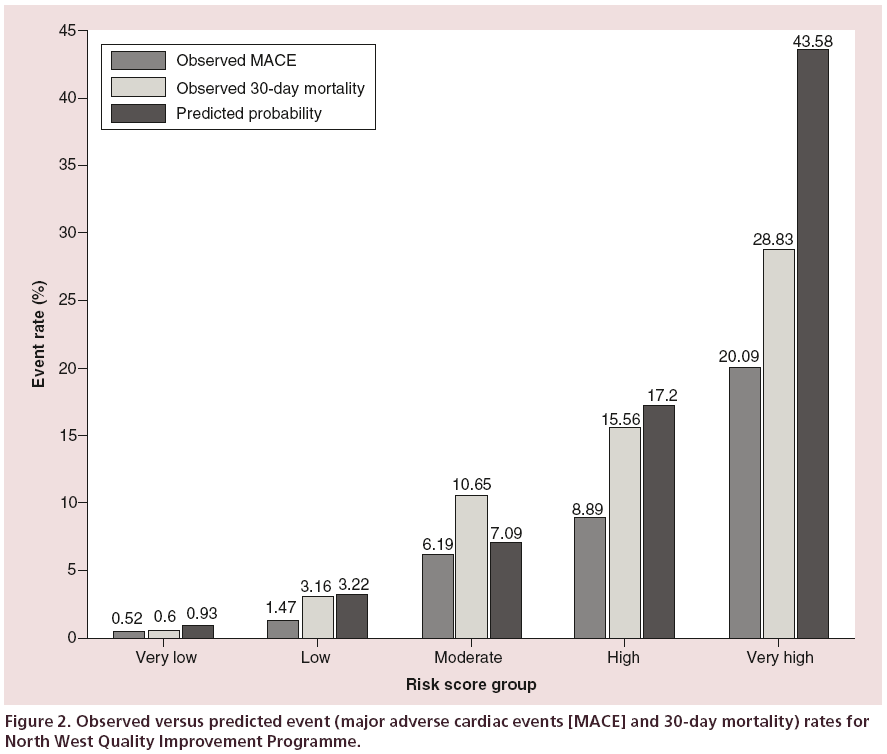
The calibration was further assessed by classifying patients into one of five risk groups as performed by Kunadian et al. [6]. The patients are classified into risk groups based on the total integer score of their risk factors (Appendix, Table A1), the groups being very low (0–5), low (6–8), moderate (9–11), high (12–14) and very high (>14). The distribution of patients into these groups was 78.5, 15.4, 3.1, 0.5 and 2.5%, respectively. The outcome rates for both MACE and 30-day mortality, using the NWQIP generated probabilities, are shown in Figure 2. The 95% CI for the estimated probabilities for each group was 0.92–0.94, 3.18–3.26, 6.92–7.26, 15.97–18.43 and 41.25–45.91, respectively. For MACE there is an overestimation in every risk group, and for 30-day mortality only the ‘low’ risk group is within the predicted range.
Multivariate predictors of 30-day mortality
The candidate variables which retained their significance in the final multivariate prediction model are shown in Table 3, which also lists the corresponding regression coefficients, odds ratios, confidence limits, standard errors, p-values and integer scores. The majority of patients, 8481 (91.4%) had a predicted probability of experiencing 30-day mortality of ≤5.0%, only 167 (1.8%) had a probability of ≥20.0%. The set of multivariate predictors for in-hospital MACE although not listed, was similar to those for 30-day mortality, except for the omission of PVD, urgent PCI and the age group 60–69 years. The corresponding odds ratios (and p-values) were age 70–79 years: 3.26 (0.005); age ≥ 80 years: 4.69 (<0.001); female sex: 2.10 (<0.001); emergency PCI: 4.21 (<0.001); cerebrovascular disease: 2.97 (0.001); cardiogenic shock: 9.23 (0.001); preoperation ventilation: 3.22 (<0.001).
| Risk factor | Coefficient | SE | p-value | Odds ratio | 95% CI | Integer score |
|---|---|---|---|---|---|---|
| Age 60–69 years | 1.102 | 0.300 | <0.001 | 3.011 | 1.67 to 5.42 | 3 |
| Age 70–79 years | 1.642 | 0.292 | <0.001 | 5.166 | 2.91 to 9.16 | 5 |
| Age ≥ 80 years | 2.452 | 0.294 | <0.001 | 11.607 | 6.53 to 20.65 | 12 |
| Female sex | .453 | 0.167 | 0.007 | 1.573 | 1.13 to 2.18 | 2 |
| Cardiogenic shock | 1.990 | 0.216 | <0.001 | 7.314 | 4.79 to 11.18 | 7 |
| Cerebrovascular disease | .733 | 0.294 | 0.013 | 2.082 | 1.17 to 3.70 | 2 |
| Urgent PCI | .698 | 0.318 | 0.028 | 2.009 | 1.08 to 3.75 | 2 |
| Emergency PCI | 2.326 | 0.268 | <0.001 | 10.232 | 6.05 to 17.30 | 10 |
| Peripheral vascular disease | .870 | 0.306 | 0.004 | 2.388 | 1.31 to 4.35 | 2 |
| Ventilated (pre-op) | 1.603 | 0.296 | <0.001 | 4.966 | 2.78 to 8.87 | 5 |
| Intercept | -7.150 | NA | NA | NA | NA | NA |
NA: Not applicable; PCI: Percutaneous coronary intervention; PVD: Peripheral vascular disease; SE: Standard error.
Table 3: Independent risk factors for 30-day mortality.
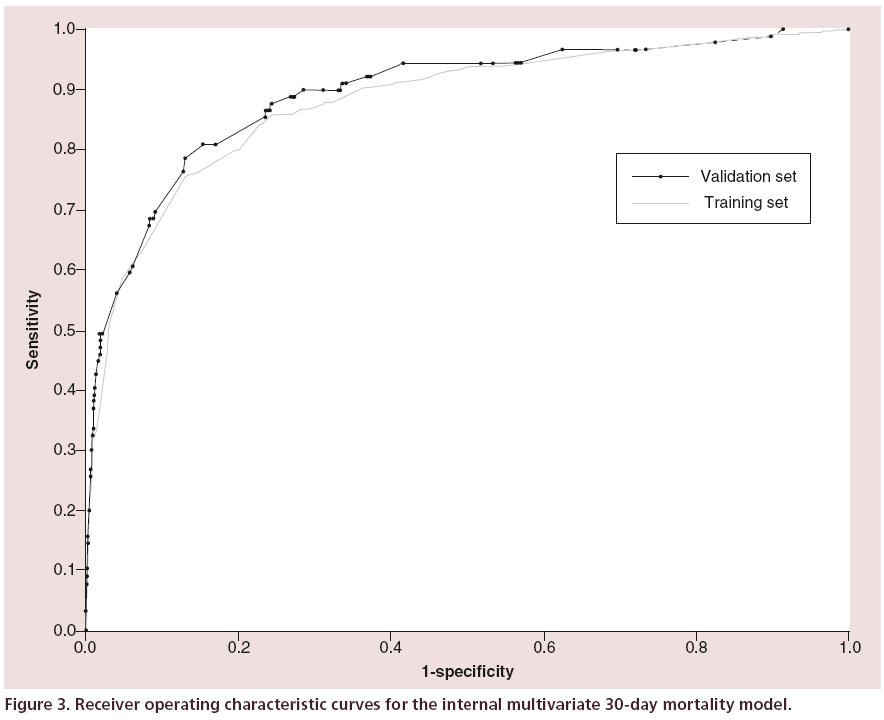
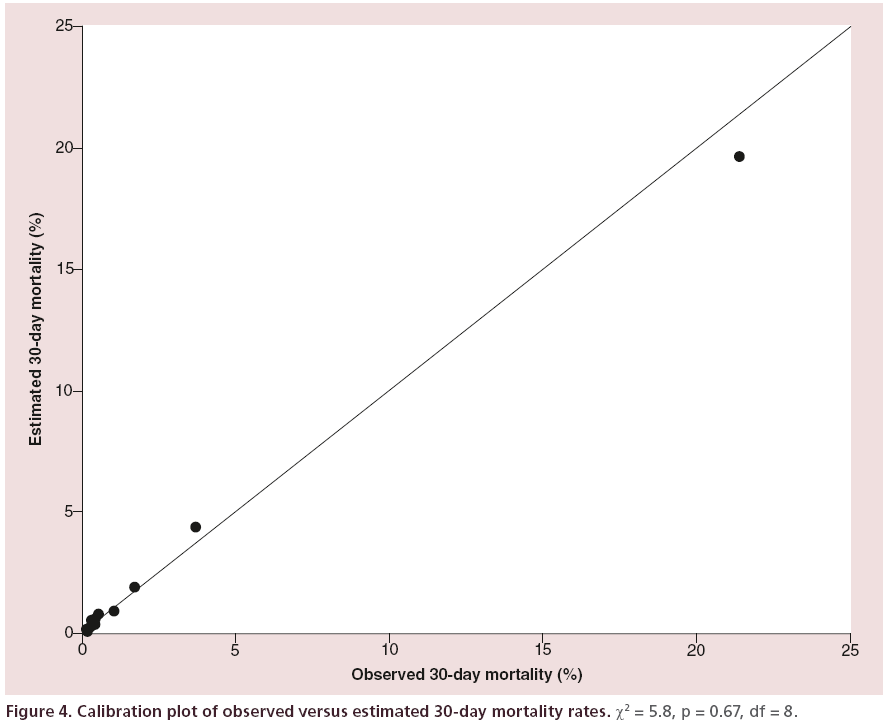
The area under the ROC curve (Figure 3) was 0.881 (SE = 0.014, 0.854–0.908) indicating very good discrimination between those that died within 30 days and those who did not. The Hosmer-Lemeshow goodness of fit test (Figure 4) was not significant, p = 0.670 (χ2= 5.801, df = 8), this indicates little departure from the perfect fit.
Integer risk score
Patients were classified into one of the five risk groups by their combined integer score, the integers were assigned to each risk factor in the multivariate model (Table 3). The distribution of the procedures into the very low, low, moderate, high and very high risk groups was 5944 (64.1%), 1921 (20.7%), 903 (9.7%), 427 (4.6%) and 84 (0.9%), respectively. The observed mortality rates were 0.4% (23), 1.5% (28), 4.2% (38), 16.9% (72) and 42.6% (36), respectively.
Internal validation of the multivariate model
Bootstrap resampling using the training set produced 200 samples which had a mean (SD) area under the ROC curve of 0.879 (0.0153) indicating a very good ability to discriminate. The coefficients from the multivariate model (Table 3) were used to calculate the estimated probability of 30-day mortality for each of the 4119 records in the validation set. In this set, 45 (1.1%) patients experienced MACE and 84 (2.0%) died within 30 days of their PCI, of these, 53 died after discharge, with 19 of the 53 (35.8%) dying within 7 days.
The baseline demographic, clinical and procedural characteristics although not listed here were similar to the training set, the deviations in percentages between characteristics were <1.5% for majority of variables, those which exhibited larger changes than this were renal disease (+5.1%), hypertension (+1.7%), prior myocardial infarction (-1.7%), prior PCI (+2.5%), multivessel PCI (-2.7%) and priority (elective, -5.2%; urgent, -1.2%; emergency, +6.4%).
The ROC curve was 0.891 (SE = 0.021, 0.850– 0.932) (Figure 3), the improvement in discrimination compared with the training set was not statistically significant. The Hosmer-Lemeshow test was not significant, p = 0.2682 (χ2 = 9.9553, df = 8), indicating little departure from the perfect fit.
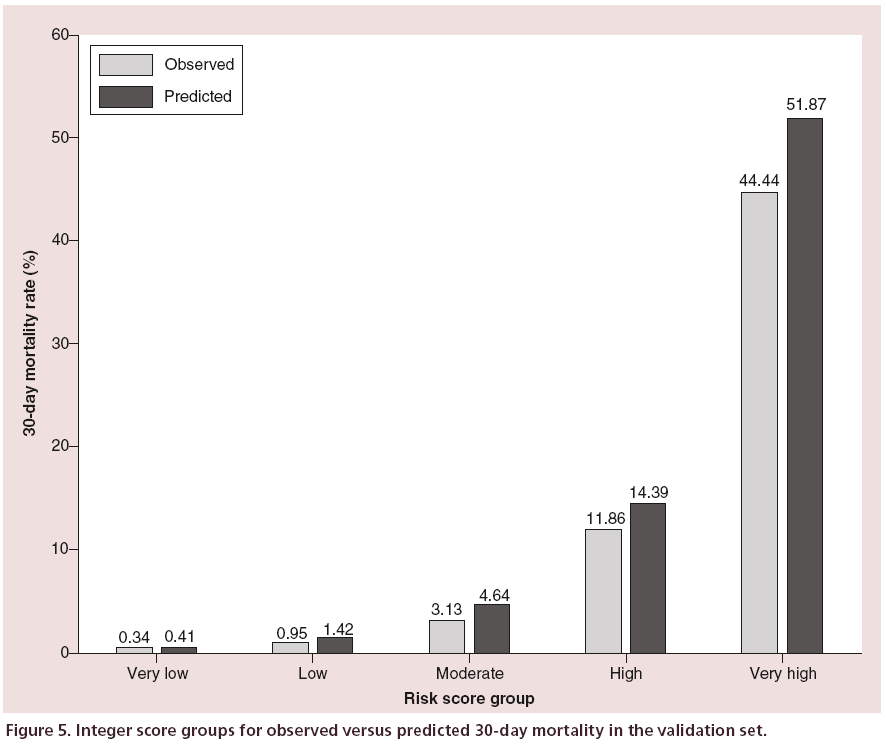
The integer score risk groups of observed and predicted 30-day mortality rates are shown in Figure 5. The distribution of patients into the very low to very high categories was 56.4% (2325), 25.7% (1058), 11.6% (479), 4.7% (194) and 1.5% (63), respectively, for which there was a small absolute overestimation for each group. The relative difference between the observed and predicted rates for the groups was 21, 49, 48, 21 and 17% respectively.
Discussion
This study revealed that the NWQIP risk model can discriminate (ROC = 0.81, 0.77–0.86) in-hospital MACE as an outcome more effectively than it did in its original setting [5] (ROC = 0.76), this was also found by Kunadian et al. [6], (ROC = 0.86, 0.82– 0.90). When using the NWQIP model with 30-day mortality, there was a small increase in discrimination performance, both of these outcomes suggest NWQIP continues to discriminate well. We suspect the main reason for the improvement is the more robust nature of 30-day mortality compared with MACE. For MACE, the model relies on accurate reporting of complications, and an under-reporting of MACE in the higher risk patient cohorts could have weakened the model’s discriminatory capability. The MACE rate found in our cohort was similar to the original NWQIP cohort (1.4 and 1.3%, respectively) despite an increase of over 12% in the proportion of patients reporting for urgent and emergency PCI in our cohort, possibly this may suggest that, based on the same risk factors, fewer patients that underwent PCI almost a decade ago would now experience MACE in the modern era of intervention practice. The outcome of 30-day mortality is obtained from the hospital’s patient administration system database following monthly updates from a national data source, and is less likely to be incorrect than MACE.
In contrast to discrimination, the calibration for both outcomes was very poor (p < 0.001 and p < 0.028, respectively) indicating large deviations between observed and predicted rates among different risk groups. This is likely to be due to changing patient demographics, and a relative increase in the number of emergency procedures performed on critically ill patients, when comparing our contemporary cohort to the original study. In general, compared with both studies [5-6], our patient cohort contained higher risk clinical and procedural characteristics, for example, 12.1% of our cohort were aged ≥80 years, compared with 2.1 and 3.8%, respectively. Emergency procedures represent a significantly larger percentage (26.9%) of PCIs compared with 10.8 and 17.6%, respectively. Other prominent increases include renal dysfunction, diabetes, prior PCI and cardiogenic shock.
The multivariate analysis identified two new additional independent risk factors, not present in the original NWQIP model, which had a significant association with 30-day mortality. These were PVD, also reported by Peterson et al. [17], and preoperation ventilation. Ventilation was not reported in the original NWQIP study. It is possible that this was not considered as a possible risk factor because of the high proportion of elective patients (56.3%). PVD was identified by Kunadian et al. [6] as a multivariate predictor in their cohort of patients. This study validates that certain risk factors (age, female sex, PCI priority, cerebrovascular disease and cardiogenic shock) have remained useful predictors of both MACE and 30-day mortality over the last decade, and exhibit similar multivariate odds ratios. Patients in the age group 60–69 years also became significant in our model. Interventions of left main stem (LMS) and graft lesions were no longer considered useful predictors for either MACE or 30-day mortality. We can only speculate as to the reason for this, but it may be that interventional cardiologists have greater experience in treating such lesions. In addition, it is possible that an improvement in stent technology, the use of intravascular imaging and embolic protection devices, and more effective adjunctive pharmacological therapy has also contributed to a reduction in risk associated with treating LMS and graft stenosis. The multivariate model developed demonstrates very good discrimination (ROC = 0.88) and calibration (p = 0.67), the performance was verified internally using a validation set (ROC = 0.89, p = 0.26). The five integer score groups (very low to very high) in the validation set did show relative overestimations of 21, 49, 48, 21 and 17%. However, the frequencies of 30-day mortality were small (23, 28, 38, 72 and 36%). Clearly, when categorizing patients into multiple risk groups based on an outcome that occurs at a low rate (2.1%), this is likely to occur. It may be the case that other factors currently not recorded or measured by PCI centers, could improve overall calibration, such as quality of life.
Study limitations
First, the primary outcome was 30-day mortality, but both the internal and external NWQIP studies [5-6] referenced did not report this outcome, and so straightforward comparisons between some components cannot be made. The rate of MACE and 30-day mortality should be very low, at any well-established PCI center, because of this it would have been beneficial to have access to a larger sample size, especially considering certain comorbidities were identified as good candidates from the univariate association with 30-day mortality. This limitation warrants other PCI centers to externally validate the multivariate model.
Approximately 4% of the PCI procedures contained missing data for either a risk factor or event outcome, and therefore had to be omitted from analysis. Missing data for clinically important risk factors should however occur less frequently in the future with more rigorous data completion policies and protocols in place.
Conclusion
In the current era of PCI, the NWQIP risk model continues to provide good discrimination, however, our study demonstrates that the model requires considerable recalibration to render the risk model useful for individual cases. Matheny et al. [18] also identified improvements in discrimination but poor calibration in other interventional models when applied to their cohort of PCI patients. We have refined the model by including two novel risk factors, most notably preprocedural ventilation, which is clearly extremely important given its strong association with an adverse outcome. Ventilation is largely a surrogate marker of out-of-hospital cardiac arrest, and therefore it is not surprising that critically ill patients have a higher probability of an adverse outcome. In addition, we have confirmed the ability of our risk model to predict the 30-day mortality outcome in a contemporary UK population. We hope the proposed model will prove useful for comparing performance of cardiac units, individual operators and for clinically assessing the risk of individual patients undergoing PCI. External validation of our multivariate model should be performed using a contemporary cohort of patients, preferably outside of the south east of England to verify geographic stability of the incorporated risk factors. This study also highlights the use of comorbidities in future risk model design.
Acknowledgements
We thank the interventional cardiologists at the ECTC for their cooperation, and M Parker and P Cousins of Anglia Ruskin University for their statistical review and helpful suggestions.
Financial & competing interests disclosure
This study was funded by Anglia Ruskin University and undertaken as part of the primary author’s doctoral studies. JR Davies is an employee of the NHS Trust which kindly provided permission for this study. The authors have no other relevant affiliations or financial involvement with any organization or entity with a financial interest in or financial conflict with the subject matter or materials discussed in the manuscript apart from those disclosed.
No writing assistance was utilized in the production of this manuscript.
Ethical conduct of research
Ethical approval for this study was granted by a National Research Ethics Service (NRES) committee, all data used in this study were anonymized prior to analysis, and they have followed the principles outlined in the Declaration of Helsinki for all human or animal experimental investigations. In addition, for investigations involving human subjects, informed consent has been obtained from the participants involved.
Executive summary
• This is the first study (to our knowledge) to externally validate the established North West Quality Improvement Programme (NWQIP) risk prediction model for both in-hospital complications and 30-day mortality following percutaneous coronary intervention.
• The NWQIP model continues to discriminate well for major adverse cardiac events, and also for 30-day mortality.
• The NWQIP model is poorly calibrated for different risk groups (observed vs predicted outcome).
• A multivariate model for 30-day mortality was developed which exhibits very good discrimination and calibration.
• Novel risk factors incorporated into the model: preoperation ventilation and peripheral vascular disease.
References
Papers of special note have been highlighted as:
•• of considerable interest.
- Office for National Statistics (ONS). Mortality statistics 2012. www.ons.gov.uk/ons/rel/vsob1/mortality-statistics--deaths-registered-in-england-and-wales--series-dr-/2012/ sty-causes-of-death.html
- British Heart Foundation. Trends in coronary heart disease. www.bhf.org.uk/∼/media/files/research/heart-statistics/bhf-trends-in-coronary-heart-disease.pdf
- British Cardiovascular Intervention Society. BCIS Audit 2013. www.bcis.org.uk/documents/E15_BCIS_Audit_2013_ for_web_no_track_Version_03-11-2014.pdf
- British Cardiovascular Intervention Society. Individual Operator Information. www.bcis.org.uk/pages/page_box_contents. asp?pageid=805&navcatid=88
- Grayson AD, Moore RK, Jackson M et al. Multivariate prediction of major adverse cardiac events after 9914 percutaneous coronary interventions in the north west of England. Heart 92, 658–663 (2006).
- Kunadian B, Dunning J, Roberts AP et al. External validation of established risk adjustment models for procedural complications after percutaneous coronary intervention. Heart 94, 1012–1018 (2008).
- Mrdovic I, Savic L, Krljanac G et al. Predicting 30-day major adverse cardiovascular events after primary percutaneous coronary intervention. Int. J. Cardiol. 162, 220–227 (2013).
- Curtis JP, Geary LL, Wang Y et al. Development of 2 registry-based Risk models suitable for characterizing hospital performance on 30-Day all-cause mortality rates among patients undergoing percutaneous coronary intervention. Circ. Cardiovasc. Qual. Outcomes 5, 628–637 (2012).
- Hamburger JN, Walsh SJ, Khurana R et al. Percutaneous coronary intervention and 30-day mortality: the British Columbia PCI risk score. Catheter. Cardiovasc. Interv. 74, 377–385 (2009).
- Hannan EL, Farrell LS, Walford G et al. The New York State risk score for predicting in-hospital/30-day mortality following percutaneous coronary intervention. JACC Cardiovasc. Interv. 6, 614–622 (2013).
- Qureshi MA, Safian RD, Grines CL et al. Simplified scoring system for predicting mortality after percutaneous coronary intervention. J. Am. Coll. Cardiol. 42, 1890–1895 (2003).
- Chowdhary S, Ivanov J, Mackie K et al. The Toronto score for in-hospital mortality after percutaneous coronary interventions. Am. Heart J. 157, 156–163 (2009).
- British Cardiovascular Intervention Society. BCIS Dataset 2014. www.bcis.org.uk/documents/ BCIS_v_5.6.2_30-10-2014.xls
- Hanley JA, McNeil BJ. The meaning and use of the area under a receiver operating characteristic (ROC) curve. Radiology 143, 29–36 (1982).
- Hosmer DW, Lemeshow S. Assessing the fit of the model(Sub) 5.2 – summary measures of goodness of fit(Sub) 5.2.2 – the Hosmer–Lemeshow tests. In: Applied Logistic Regression. John Wiley & Sons, NJ, USA, 157–169 (2013).
- Efron B, Tibshirani R. Bootstrap methods for standard errors, confidence intervals, and other measures of statistical accuracy. Stat. Sci. 1, 54–77 (1986).
- Peterson ED, Dai D, DeLong ER et al. Contemporary mortality risk prediction for percutaneous coronary intervention: results from 588,398 procedures in the National Cardiovascular Data Registry. J. Am. Coll. Cardiol. 55, 1923–1932 (2010).
- Matheny ME, Ohno-Machado L, Resnic FS. Discrimination and calibration of mortality risk prediction models in interventional cardiology. J. Biomed. Inform. 38, 367–375 (2005).
•• Features the design and internal validation of the North West Quality Improvement Programme risk model, the discrimination, calibration, and detailed demographic/ procedural/angiographic characteristics are presented.
•• Externally validated the North West Quality Improvement Programme risk model and confirmed its discrimination and calibration performance using a cohort of percutaneous coronary intervention patients almost a decade ago.
Appendix
NWQIP model calculation
The following regression coefficients were reported by Grayson et al. [5] in the original NWQIP study. The calculation of the estimated risk of in-hospital MACE as a percentage is (odds/[1+odds]) × 100. Odds = exp(- 5.4959 + [0.7048 × age 70–79 years] + [1.0106 × age ≥ 80 years] + [0.4586 × female sex] + [0.8618 × cerebrovascular disease] + [3.2636 × cardiogenic shock] + [0.4788 × urgent PCI] + [1.3625 × emergency PCI] + [1.6502 × LMS lesions] + [0.9101 × graft lesions])
| Variable | Coefficient | Odds ratio | Integer score |
|---|---|---|---|
| Age 70–79 | 0.7048 | 2.02 | 2 |
| Age ≥ 80 | 1.0106 | 2.75 | 3 |
| Female sex | 0.4586 | 1.58 | 2 |
| Urgent PCI | 0.4788 | 1.61 | 2 |
| Emergency PCI | 1.3625 | 3.91 | 4 |
| LMS lesion | 1.6502 | 5.21 | 5 |
| Graft lesion | 0.9101 | 2.48 | 3 |
| Cardiogenic shock | 3.2636 | 26.14 | 26 |
| Cerebrovascular disease | 0.8618 | 2.37 | 3 |
| Intercept | -5.4959 | NA | NA |
Integer score reported by Kunadian et al. [6].
Table A1: North West Quality Improvement Programme risk factors, coefficients and integer score.
