Research Article - Imaging in Medicine (2021) Volume 13, Issue 6
Fetal sonographic measurement correlation with the gestational age (20-41 weeks gestation) among Sudanese population during 2016-2020
- Corresponding Author:
- Mona
Ahmed
Department of Radiology
University of Science and Technology
Khartoum
Sudan
E-mail: hanko85@hotmail.com
Abstract
The importance of accurate Fetal Gestational Age (FGA) determination in the management of obstetric patients cannot be over emphasized. The choice of obstetric management decision and its outcome depends on the knowledge of the exact age of the pregnancy.
Objectives: The purpose of this study is to determine the fetal gestational age and correlate it with the conventional parameters.
Methods: Data were collected at Wad Madani Military Hospital, Nyala Military Hospital and Private Clinics from 2016-2020 (n=400) cases were selected randomly by non probability method using quota technique. Using several ultrasound machines (Esaoti My Lap 70, Honda HS2000) with probe curve linear 3.5 megahertz.
Results: New Sudanese charts were reported for BPD, HC, AC, and FL. Reference equations for the dating of pregnancy were presented. There is significant fetal biometric difference between Sudanese and non sudanese peoples (eg. Egyptian and Korean). Fetal BPD, HC, AC and FL compared with gestational age, it confirms that there is a significance difference between the measurements and gestational age, p-value is (0.00). There are equations resulting from these tables that explain the relationship between (BPD, HC, AC, and FL) and gestational age for Sudanese people.
Conclusion: The fetal growth is not uniform and varies between different groups of citizens. In the present study, we showed accuracy of sonographic instruments and presented sudanese fetal biometry. We believe that our standard, being derived from singleton pregnant women, is a reference for fetal growth.
Keyword
Fetal biometry ▪ gestational age ▪ ultrasonography
Introduction
The importance of accurate Fetal Gestational Age (FGA) determination in the management of obstetric patients cannot be over emphasized. The choice of obstetric management decision and its outcome depends on the knowledge of the exact age of the pregnancy. Accurate FGA determination enables adequate planning for the appropriate mode of delivery and further management of neonate after delivery [1], helps in counseling women at risk of preterm delivery and in the evaluation of fetal growth and detection of Intra Uterine Growth Retardation (IUGR). Uncertain gestational age has been associated with adverse pregnancy outcome which includes low birth weight, spontaneous preterm delivery and perinatal mortality independence of maternal characteristics [2]. Haines noted that a combination of uncertain date of LMP and any obstetric high risk situation (e.g. placenta previa, pregnancy induced hypertension, IUGR) places the fetus in jeopardy because of the difficulty in deciding the optimal time of delivery. Different methods are being employed in the determination of FGA which includes Last Menstrual Period (LMP), ovulation date, date of conception (in case of artificial insemination), symphysis-fundal height, quickening and ultrasonography [3]. Ultrasound has played a vital role in the estimation of FGA and has become an integral part of obstetric practice [4]. Sonographic estimation of gestational age is derived from calculation based on fetal measurement which serves as an indirect indicator of gestational age. Numerous equations regarding the relationship between fetal biometric parameters has been described and have proven early antenatal ultrasound to be an objective and accurate means of establishing FGA [5,6]. These biometric parameters includes Gestational Sac (GS), Crown Rump Length (CRL), Bi Parietal Diameter (BPD), Head Circumference (HC), Abdominal Circumference (AC), and Femur Length (FL). Accurate assessment of FGA using ultrasound has posed a serious problem to obstetricians especially as the pregnancy approaches term. This stems from the fact that there are increased fetal biological variations as pregnancy advances [7,8]. These variations can be caused by maternal age, parity, pregnancy weight, geographic location and specific population characteristics. Also technical factors like inter observer error and different measuring techniques contributes to the fetal variability as pregnancy advances to term [9,10]. noted that the accuracy of these traditional predictors of FGA (GS, CRL, BPD, HC, AC and FL) decreases as the pregnancy advances to third trimester therefore, suggested that in addition to these traditional parameters, ancillary biometric and non-biometric measurements can help narrow the biological variability between fetuses. Butt [12,13] recommended combination of multiple biometric parameters for FGA determination in the third trimester instead of relying on a single parameter. Ansari et al. [14] noted that the Fetal Kidney Length (FKL) is more accurate method of determining gestational age than the other fetal biometric indices based on BPD, HC, FL, and AC between 24 weeks and 38 weeks of gestational age. Fetal kidney can be reliably measured using Trans Vaginal Sonography (TVS) between 14 weeks and 17 weeks of gestation while it can be measured using transabdominal ultrasonography from 18 weeks of gestation and above.
Materials and methods
This study carry out to correlate the normal fetal ultrasonic scanning and biometry at 20-41 weeks of gestation in Sudanese population, in the period from May 2016 to June 2020 with 400 Sudanese pregnant Women with uneventful pregnancies (Normal), the subjects comes from different area of Sudan to study area (wad Madani military hospital). The ultrasonic machine used in this study are Esaote my-lab 70 × (made in Italy 2010) real time ultrasound machine with frequency 3.5 MHz curvilinear array transducer, Honda HS2000 (made in Japan 2006) portable real time machine 3.5MHz curvilinear array transducer.
▪ Data collection
The choice of probes will base on varying degrees of penetration needed (3.5 MHz mainly used in obstetric ultrasound). Freeze frame capability and on screen caliper were used for the measurements. Validity and reliability of the equipment will tested prior to the study through pilot study and quality assurance. Other accessory used in the study like (couch, pillow, bed sheet, cover, sterile gloves, acoustic gel and data collection sheet) attending the designated study area during the study period, with singleton pregnancies at second and third trimester with viable fetus. Pregnancies with established any congenital abnormality, all pathological conditions (diabetes and hypertension), IUGR , abnormal fetal outcome, multiple pregnancy, abnormal fetal position, poorly visualized fetal parts and abnormal placenta and amniotic fluid index were excluded. Verbal consent was firstly obtained from all potential participants. Data collected from the ultrasound reports, Tools to measure height and weight and direct interview by use data collection sheet, Data presented in Tables, Figures and graphs. The study design was approved by the hospital’s ethical committee on research involving human subjects before the study began, No information or patient details were published. Data were analyzed using R statistical package (v.2.14.12, R foundation for statistical computing, 2012) linked to SPSS v.21 (IBM Corporation, 2012).
▪ Ultrasound technique
The patient scanned in supine position on couch trans abdominal technique with 3.5MHz curvilinear transducer, All organs of the fetus must visualize clearly and the gestational age estimated by measure the trans axial image of the fetal skull at the level of thalami and cavum septum pellucid is obtained. The transducer must be perpendicular to the parietal bones. BPD measured at the widest part of the image from the outer edge of the cranium nearest to the transducer to the inner edge of the cranium farthest from the transducer and HC measured by the equation (APD+BPD)/2 × 3.14 or 1.57 × ([outer to outer BPD]+[outer to outer OFD]), AC is a circular section of the abdomen demonstrating an unbroken and short rib echo of equal size on each side. A cross-section of one vertebra visualized as a triangle of three white spots. A short length of umbilical vein and FL measured from blunt end to blunt end parallel to the shaft of the bone.
Discussion
Fetal biometry is of great interest in obstetrical practice. It is helpful in the estimation of gestational age especially in the women who do not remember the dates of their last menstrual period or whose fundal height on abdominal examination does not correspond to dates. The practice of assessing gestational age in early gestation is valuable in detection of growth aberration in later stages of pregnancy. In addition, fetal biometry distinguished the normal from abnormal fetal structures. Prenatal measurement of fetal parameters and estimated size and weights vary among different populations, depending upon their racial, demographic characteristics and nutrition. It is therefore important that fetal biometry be performed for local population and local charts of normal biometry be constructed and followed for these populations and ethnic groups. Many reference charts and tables have been published since then. However, a number of these were produced using old ultrasound equipment with low spatial resolution in different ultrasound velocities compared with today’s modern realtime scanners which have not only opened up improved measurement technique but also provide us with multiple fetal parameters. Several of these charts, however, have methodological flaws, falling short of the ideal attributes of gestational age related reference curve design, namely: non-identification of the statistical method of analysis, a supernormal data set, in adequate account in variability of measurements with gestation and failure to present scatter diagrams. In the publications of Altman and Chitty, methodological guidelines were created for the construction of fetal biometry charts [15].
The ultimate goal of fetal biometry is to enable the user to predict information concerning a fetus and to verify how closely the fetus confirms to the prediction. While constructing the fetal biometry charts, the statistical justification of the sample size is as necessary as the selection of study design type, so that the results may subsequently be generalized to the whole population or at least to the concerned ethnic group. Mean and standard deviation values of the parameter(s) are computed. The smaller the standard deviation, the less is the variability of the sample around the mean. The standard deviation is also used to define the statistical limits of ‘normality’. These intervals are called confidence limits. Traditionally, the confidence limits are set at the 5th and 95th percentile. The values of 5th and 95th percentile suggest the lower and the upper limits of normal reference intervals or normal ranges for the selected parameter. Scatter diagrams are constructed and regression analysis is done yielding a specific regression equation that enables one to predict the fetal gestational age once the specific values of fetal parameter is known. Fetal biometric studies reported from Iran, Oman, Cameron, Bangladesh, Pakistan and Israel describe the uniqueness and specification of different fetal parameters for their own populations [16,17].
Ethnic variations have also been described. Therefore, biometric curves for one population may over or under estimate the fetal age when used for another population with different demographic characteristics. Thus, the construction and use of biometric norm grams specific for populations and ethnic groups is always recommended. BPD and AC was higher in the Egyptian and Korean women than Sudanese ones in the second and third trimester, while there was an unstable variability between Egyptian and Sudanese women, Egyptian and Korean results about BPD and AC are mentioned in appendix. His may be related to women height and size as well as other epigenetic factors as the nutritional status, level of pollution and socioeconomic standards of our women. Sudanese fetuses have smaller HC than Korean fetuses and almost comparable as those from the Egyptian fetuses. While fetuses of Sudanese women had longer femur than that of Korean and Egyptian counterparts, Egyptian and Korean results about HC and FL are mentioned in appendix [18]. Fetal FL measurement can be estimated by obtaining images of the femur including the shaft and two ossified center. (TABLES 1-4) describes the means, standard deviations, minimum and maximum values of the fetal biometrics (BPD, HC, AC and FL) from 20 to 41 week of gestation. Egyptian and Korean results tables are mentioned in appendix (TABLES 5-8) the table showed the fetal BPD, HC,AC and FL compared with gestational age and get it is mean , standard deviation , minimum value and maximum value among 400 cases. Also showed that there is a significance difference between the measurements and gestational age, p-value is (0.00).
| GA(week) | No | MEAN | SD | MIN | MAX |
|---|---|---|---|---|---|
| 20 | 8 | 46.25 | 2.03 | 37 | 50 |
| 21 | 6 | 49.67 | 2.06 | 48 | 53 |
| 22 | 9 | 54.11 | 2.2 | 50 | 58 |
| 23 | 7 | 56.86 | 1.56 | 55 | 59 |
| 24 | 7 | 60.43 | 2.7 | 57 | 64 |
| 25 | 14 | 62.36 | 2.62 | 56 | 66 |
| 26 | 11 | 65.45 | 1.63 | 53 | 57 |
| 27 | 11 | 68.2 | 2.09 | 66 | 72 |
| 28 | 17 | 71.82 | 1.67 | 69 | 75 |
| 29 | 11 | 73.54 | 3.36 | 69 | 81 |
| 30 | 16 | 75.06 | 3.23 | 67 | 80 |
| 31 | 18 | 78.17 | 1.72 | 75 | 81 |
| 32 | 16 | 80.13 | 1.82 | 77 | 84 |
| 33 | 23 | 81.43 | 3.09 | 73 | 86 |
| 34 | 27 | 85.04 | 3.11 | 77 | 90 |
| 35 | 25 | 85.36 | 2.99 | 78 | 90 |
| 36 | 54 | 36.34 | 4.38 | 66 | 93 |
| 37 | 27 | 89.65 | 2.73 | 82 | 95 |
| 38 | 31 | 88.1 | 9.9 | 39 | 98 |
| 39 | 38 | 91.81 | 4 | 84 | 98 |
| 40 | 15 | 92.13 | 4.24 | 84 | 99 |
| 41 | 9 | 91.11 | 2.37 | 87 | 95 |
TABLE 1: Descriptive Statistics for BPD
| GA(week) | No | MEAN | SD | MIN | MAX |
|---|---|---|---|---|---|
| 20 | 8 | 167.12 | 14.51 | 135 | 179 |
| 21 | 6 | 184.83 | 10.22 | 170 | 196 |
| 22 | 9 | 198.33 | 5.45 | 188 | 205 |
| 23 | 7 | 207 | 8.3 | 190 | 214 |
| 24 | 7 | 223.43 | 8.22 | 212 | 235 |
| 25 | 14 | 227 | 10.27 | 206 | 242 |
| 26 | 11 | 238.09 | 4.04 | 231 | 244 |
| 27 | 11 | 249.82 | 6.1 | 239 | 261 |
| 28 | 17 | 259.35 | 6.68 | 247 | 271 |
| 29 | 11 | 259.9 | 32.64 | 165 | 289 |
| 30 | 16 | 285.56 | 25.1 | 271 | 372 |
| 31 | 18 | 286.44 | 7.68 | 274 | 306 |
| 32 | 16 | 296.4 | 24.53 | 278 | 385 |
| 33 | 23 | 297.74 | 10.81 | 263 | 314 |
| 34 | 27 | 301.26 | 21 | 207 | 321 |
| 35 | 25 | 313.96 | 12.73 | 281 | 352 |
| 36 | 54 | 314.53 | 16.79 | 281 | 334 |
| 37 | 27 | 323.76 | 10.2 | 302 | 351 |
| 38 | 31 | 327.1 | 11.72 | 297 | 346 |
| 39 | 38 | 333.03 | 10.2 | 310 | 351 |
| 40 | 15 | 331.8 | 11.54 | 309 | 355 |
| 41 | 9 | 338.22 | 8.57 | 325 | 351 |
TABLE 2: Descriptive statistics for HC
| GA(week) | No | MEAN | SD | MIN | MAX |
|---|---|---|---|---|---|
| 20 | 8 | 137.87 | 9.56 | 117 | 145 |
| 21 | 6 | 185.5 | 7.03 | 149 | 169 |
| 22 | 9 | 170.77 | 4.89 | 161 | 177 |
| 23 | 7 | 177.57 | 5.97 | 169 | 183 |
| 24 | 7 | 179 | 6.63 | 166 | 184 |
| 25 | 14 | 198.43 | 8.34 | 186 | 212 |
| 26 | 11 | 213.54 | 10 | 196 | 231 |
| 27 | 11 | 220.36 | 9.64 | 203 | 238 |
| 28 | 17 | 226.41 | 14.71 | 204 | 257 |
| 29 | 11 | 241.18 | 12.8 | 224 | 265 |
| 30 | 16 | 224.25 | 12.37 | 222 | 267 |
| 31 | 18 | 252.11 | 22.64 | 181 | 277 |
| 32 | 16 | 270.3 | 17.75 | 234 | 306 |
| 33 | 23 | 274.09 | 14.88 | 243 | 299 |
| 34 | 27 | 291.63 | 19.77 | 252 | 361 |
| 35 | 25 | 297.28 | 16.1 | 263 | 331 |
| 36 | 54 | 303.72 | 17.13 | 252 | 334 |
| 37 | 27 | 319.76 | 24.1 | 256 | 394 |
| 38 | 31 | 323.06 | 18.76 | 283 | 366 |
| 39 | 38 | 331.8 | 19.22 | 287 | 366 |
| 40 | 15 | 331.13 | 24.03 | 280 | 373 |
| 41 | 9 | 318.33 | 23.55 | 280 | 353 |
TABLE 3: Descriptive statistics for AC
| GA(week) | No | MEAN | SD | MIN | MAX |
|---|---|---|---|---|---|
| 20 | 8 | 31.75 | 5.14 | 20 | 36 |
| 21 | 6 | 37.17 | 1.33 | 35 | 39 |
| 22 | 9 | 38.55 | 1.24 | 37 | 40 |
| 23 | 7 | 43.86 | 6.44 | 40 | 58 |
| 24 | 7 | 45.43 | 2.37 | 43 | 49 |
| 25 | 14 | 48.21 | 4.23 | 45 | 62 |
| 26 | 11 | 49.82 | 2.09 | 47 | 53 |
| 27 | 11 | 51 | 1.2 | 49 | 53 |
| 28 | 17 | 55.35 | 8.47 | 49 | 87 |
| 29 | 11 | 55.91 | 1.64 | 53 | 56 |
| 30 | 16 | 59.25 | 2.82 | 53 | 65 |
| 31 | 18 | 59.33 | 1.41 | 57 | 62 |
| 32 | 16 | 63.13 | 2 | 61 | 69 |
| 33 | 23 | 65.74 | 2.4 | 61 | 71 |
| 34 | 27 | 66.5 | 2.31 | 61 | 72 |
| 35 | 25 | 67.88 | 2.71 | 59 | 73 |
| 36 | 54 | 71.66 | 2.9 | 66 | 78 |
| 37 | 27 | 73.1 | 2.1 | 69 | 79 |
| 38 | 31 | 74.32 | 2.23 | 64 | 78 |
| 39 | 38 | 76.7 | 1.17 | 73 | 79 |
| 40 | 15 | 78.2 | 0.68 | 77 | 80 |
| 41 | 9 | 79.67 | 0.71 | 79 | 81 |
TABLE 4: Descriptive statistics for FL`
| Unstandardized | Standardized | t | Sig | |
|---|---|---|---|---|
| Model |  Coefficients                   | Coefficients | ||
| BÂ Â Â Â Â Â Â Â Â Â Â Â Â Â Â Â Â Â Â Â STD Error | Beta | |||
| 1(Constant) | 0.246Â Â Â Â Â Â Â Â Â Â Â Â Â Â Â Â Â Â Â Â Â Â 0.664 | 0.371 | 0.711 | |
| BPD | 0.409Â Â Â Â Â Â Â Â Â Â Â Â Â Â Â Â Â Â Â Â Â Â 0.008 | 0.929 | 49.922 | 0 |
TABLE 5: Correlation of gestational age and BPD
| Unstandardized | Standardized | t | Sig | |
|---|---|---|---|---|
| Model |  Coefficients                 | Coefficients | ||
| BÂ Â Â Â Â Â Â Â Â Â Â Â Â Â Â Â Â Â Â Â STD Error | Beta | |||
| 1 (Constant) | -0.483Â Â Â Â Â Â Â Â Â Â Â Â Â Â Â Â Â Â Â Â Â 0.640 | -0.756 | 0.45 | |
| Â Â Â Â HC | 0.115Â Â Â Â Â Â Â Â Â Â Â Â Â Â Â Â Â Â Â Â Â Â 0.002 | 0.936 | 52.984 | 0 |
TABLE 6: Correlation of gestational age and HC
| Unstandardized | Standardized | t | Sig | |
|---|---|---|---|---|
| Model | Coefficients | Coefficients | ||
| BÂ Â Â Â Â Â Â Â Â Â Â Â Â Â Â Â Â Â Â Â Â Â STD Error | Beta | |||
| 1 (Constant) | 7.190Â Â Â Â Â Â Â Â Â Â Â Â Â Â Â Â Â Â Â 0.467 | 15.389 | 0 | |
| Â Â Â Â AC | 0.094Â Â Â Â Â Â Â Â Â Â Â Â Â Â Â Â Â Â Â Â 0.002 | 0.943 | 56.377 | 0 |
TABLE 7: Correlation of gestational age and AC
|
Unstandardized |
Standardized |
t |
Sig |
|---|---|---|---|---|
Model |
Coefficients |
Coefficients |
||
|
BÂ Â Â Â Â Â Â Â Â Â Â Â Â Â Â Â Â Â Â Â Â STD Error |
Beta |
||
1 (Constant) |
4.911Â Â Â Â Â Â Â Â Â Â Â Â Â Â Â Â Â Â Â 0.385 |
|
12.766 |
0 |
    FL |
0.437Â Â Â Â Â Â Â Â Â Â Â Â Â Â Â Â Â Â Â 0.006 |
0.966 |
74.345 |
0 |
TABLE 8: Correlation of gestational age and FL
GA=409 × BPD+246 (R2=86.2)
GA=115 × HC-483 (R2=87.6)
GA=0.94 × AC+7.19 (R2=88.9)
GA=0.437 × FL+4.911 (R2=93.3)
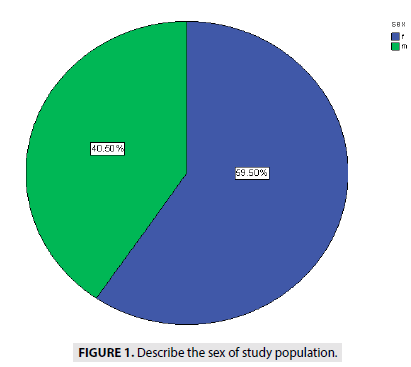
FIGURE 1 showed the distribution of the sex among 400 cases with 40.5% for male and 59.5 % for female fetuses.
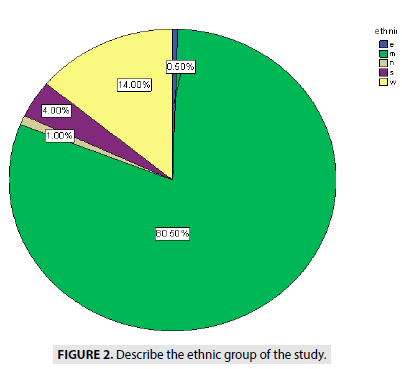
FIGURE 2 describe the ethnics of people, showed (0.5%) from eastern Sudan, (14%) from western Sudan 17 cases (1%) from northern Sudan, (4%) from southern Sudan (Blue Nile State, White Nile State, South Kurd fan State) and (80.5%) from middle of Sudan.
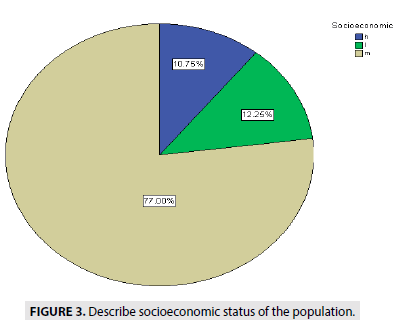
FIGURE 3 describe the socioeconomic status of people, showed (77%) are medium status, (10.7%) high status and (12, 25%) of low status.
Figure 3: Describe socioeconomic status of the population.
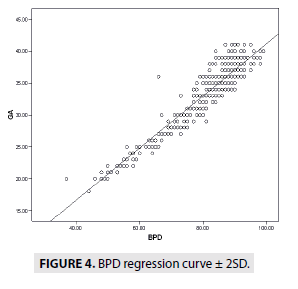
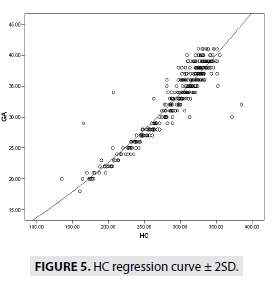
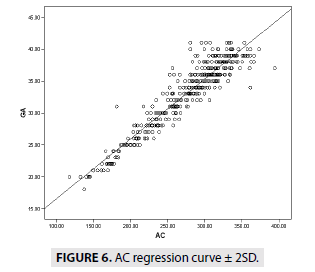
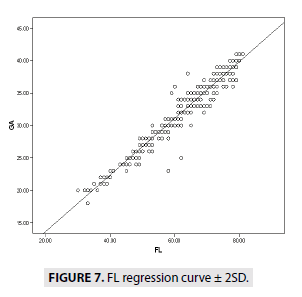
FIGURES 4-7 describe the curve of correlation between fetal measurements and gestational age in Sudanese fetuses.
Conclusion
In conclusion, the fetal growth is not uniform and varies between different groups of citizens. These differences in the various fetal biometric measurements among the dissimilar inhabitants emphasis the importance of selecting suitable charts for every population separately. Otherwise, over or underestimation of fetal growth abnormalities will include normally growing babies according to their normal population potential. This has a tremendous impact on the national health and economic resources. We endorse on the need to establish national Sudanese fetal biometric growth references.
In the present study, we showed accuracy of sonographic instruments and presented Sudanese fetal biometry. We believe that our standard, being derived from singleton pregnant women, is a reference for fetal growth.
References
- Ogunsina JA, Soyebi KO, Ogunseyinde AO, Abudu OO. Multiple fetal parameters in the estimation of gestational age in Nigerian pregnant women. West African Journal of Ultrasound. 2, 17-8 (2001).
- Hall MH, Carr-Hill RA. The significance of uncertain gestation for obstetric outcome. Br J Obstet Gynaecol. 92(5), 452-460 (1985).
- Haines CJ, Langlois SL, Jones WR. Ultrasonic measurement of fetal femoral length in singleton and twin pregnancies. Am J Obstet Gynecol. 155(4), 838-41 (1986).
- Kalish RB, Thaler HT, Chasen ST et al. First- and second-trimester ultrasound assessment of gestational age. Am J Obstet Gynecol. 191(3), 975-978 (2004).
- Hadlock FP, Deter RL, Harrist RB, Park SK. Estimating fetal age: computer-assisted analysis of multiple fetal growth parameters. Radiology. 152(2), 497-501 (1984).
- Kurtz AB, Wapner RJ, Kurtz RJ et al. Analysis of biparietal diameter as an accurate indicator of gestational age. J Clin Ultrasound. 8(4), 319-326 (1980).
- Mul T, Mongelli M, Gardosi J. A comparative analysis of second-trimester ultrasound dating formulae in pregnancies conceived with artificial reproductive techniques. Ultrasound Obstet Gynecol. 8(6), 397-402 (1996).
- Ott WJ. Accurate gestational dating: revisited. Am J Perinatol. 11(6), 404-408 (1994).
- Lunt RM, Chard T. Reproducibility of measurement of fetal biparietal diameter by ultrasonic cephalometry. J Obstet Gynaecol Br Commonw. 81(9), 682-685 (1974).
- Benson CB, Doubilet PM. Sonographic prediction of gestational age: accuracy of second- and third-trimester fetal measurements. AJR Am J Roentgenol. 157(6), 1275-1277 (1991).
- Gottlieb AG, Galan HL. Nontraditional sonographic pearls in estimating gestational age. Semin Perinatol. 32(3), 154-60 (2008).
- Butt K, Lim K. Determination of gestational age by ultrasound. J Obstet Gynaecol Can. 36(2), 171-181(2014) .
- Chitty LS, Altman DG. Charts of fetal size: limb bones. BJOG. 109(8), 919-929 (2002).
- Honarver M, Allahyari M, Dhebashi S. Assessment of gestational age based on ultrasonic femur length after the first trimester: a simple mathematical correlation between gestational age (GA) and femur length (FL). Int J GynecolObstet. 70(3), 335-340(2000).
- Pal JA. Intrauterine fetal growth profile in Pakistan. Pak J Med Sci. 8(4), 5-12 (1994).
- Ayad CE, Ibrahim MA, GarElnabi ME et al. New sudanese reference chart of fetal biometry and weight using ultrasonography. Radiology. 6(2), 131-139 (2016).
- Hegab M, Midan MF, Taha T et al. Fetal biometric charts and reference equations for pregnant women living in port said and Ismailia governorates in Egypt. Open Access Maced J Med Sci. 6(5), 751-756(2018).
- Sung EunHur, Sung Ki Lee, B. Dongjee Shin, Hyun Kyoon Lim, Se Jin Park. Fetal Biometry in Korean Fetus. Korea research institute of standards and science (2012)
