Review Article - Imaging in Medicine (2017) Volume 9, Issue 6
How (not) to misdiagnose focal renal lesions: lessons learned?
Layra Leao*, Thaís Mussi, Fernando Yamauchi & Ronaldo BaroniHospital Israelita Albert Einstein São Paulo, SP Brazil
- Corresponding Author:
- Layra Leao
Hospital Israelita Albert Einstein São Paulo
SP Brazil
E-mail: layra.leao@einstein.br
Abstract
More than half of patients over the age of 50 years old may have at least one incidental renal lesion detected on imaging studies, such as ultrasonography, computed tomography or magnetic resonance imaging. Although the majority can be easily detected and correctly characterized, misdiagnoses may occur and are often related to methods limitations, inadequate imaging protocols and misinterpretation. This pictorial essay addresses recommendations on how to recognize benign and malignant renal processes that can be potentially missed or mischaracterized on imaging studies.
Keywords
kidney disease ▪ kidney neoplasms ▪ diagnostic imaging ▪ diagnostic techniques and procedures ▪ magnetic resonance imaging ▪ tomography ▪ diagnostic ultrasound
Introduction
It is estimated that more than half of patients over the age of 50 years old have a renal lesion, most commonly cysts, and 40% of all patients will have at least one incidental renal lesion discovered during unrelated imaging exams [1,2]. In the last decades, detection of incidental renal masses has grown exponentially due to widespread use of ultrasonography (US) and cross-sectional imaging studies such as computed tomography (CT) and magnetic resonance imaging (MRI) performed for unrelated indications [3].
Despite several technical improvements, detection and characterization of some of these lesions are still challenging due to inherent methods limitations and sometimes inadequate protocols [4]. Misinterpretation is another source of pitfalls, such as normal anatomic structures or postoperative changes mistaken for tumor, and malignant processes mimicking benign lesions. Recognizing all these situations allow radiologists to avoid misdiagnosis in renal mass evaluation.
This pictorial essay illustrates several cases misdiagnosed or near-missed renal lesions on US, CT and MRI reviewed from our database Cases were didactically divided into two categories: detection mistakes and interpretation mistakes, including technical issues related to each imaging modality and lesion characterization.
Detection mistakes
■Imaging methods and technical issues
US, CT and MRI are the most common modalities available for renal lesion detection and characterization. Inadequate protocols or suboptimal image quality may induce potential pitfalls [4] (SUPPLEMENTARY FIGURE 1).
■Ultrasonography
US are often the primary imaging modality in renal masses detection and are useful in determining cystic nature of the lesion. In some cases, US can also demonstrate internal characteristics of complex cystic masses such as septae, calcifications and mural nodules, but in such cases, CT or MRI should be performed for a complete evaluation.
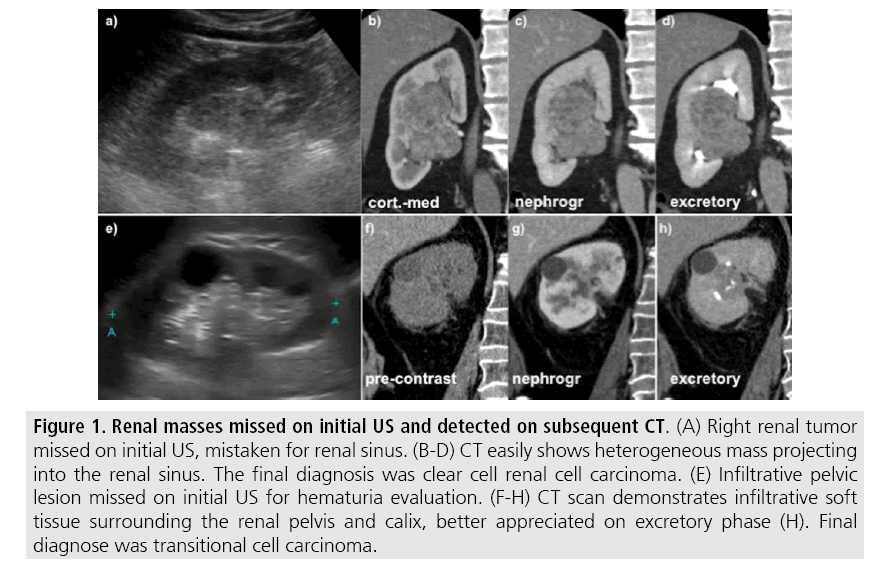
Advantages of US include wide availability, lower cost compared to cross-sectional methods and lack of ionizing radiation and nephrotoxic intravenous contrast [4,5]. On the other hand, this technique is operator dependent and detection of renal lesions may be impaired in high body mass index patients, interposition of bowel gas and small tumors that are usually undetectable by US [5]. Detection of isoechoic solid masses and urothelial malignancies are also challenging (FIGURE 1) and staging parameters such as assessment of hilar structures and retroperitoneum is also limited on US.
Figure 1: Renal masses missed on initial US and detected on subsequent CT. (A) Right renal tumor missed on initial US, mistaken for renal sinus. (B-D) CT easily shows heterogeneous mass projecting into the renal sinus. The final diagnosis was clear cell renal cell carcinoma. (E) Infiltrative pelvic lesion missed on initial US for hematuria evaluation. (F-H) CT scan demonstrates infiltrative soft tissue surrounding the renal pelvis and calix, better appreciated on excretory phase (H). Final diagnose was transitional cell carcinoma.
The most important step to avoid detection mistakes is to ensure visualization of the entire parenchyma, perinephric space and renal sinus. Use of color Doppler imaging may help to identify an area of abnormal parenchymal vascularization or normal renal vessels displaced by adjacent renal mass.
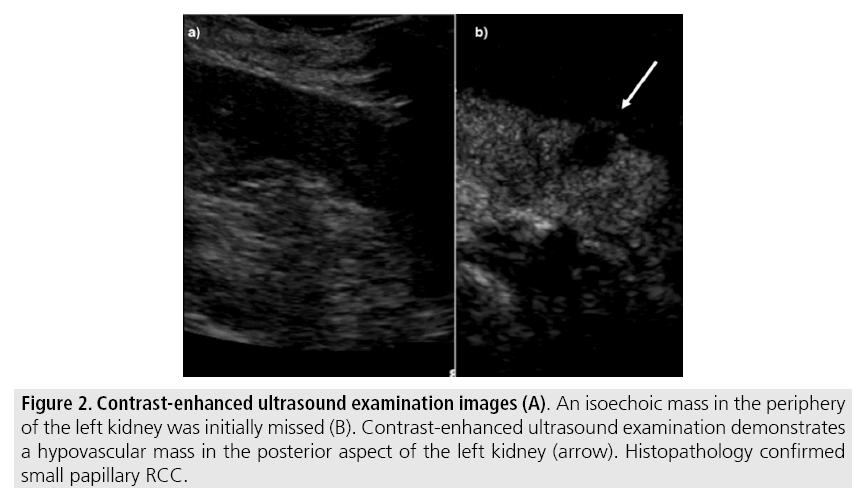
The use of contrast-enhanced US in the evaluation of focal renal lesions is promising, enabling characterization of enhancement in different structures, such as vessels, septations, small mural nodules and hypovascular lesions (FIGURE 2). Since US contrast agents are not nephrotoxic or hepatotoxic they may be an alternative option for patients with contraindications to CT and MR contrast media [1,6].
Figure 2: Contrast-enhanced ultrasound examination images (A). An isoechoic mass in the periphery of the left kidney was initially missed (B). Contrast-enhanced ultrasound examination demonstrates a hypovascular mass in the posterior aspect of the left kidney (arrow). Histopathology confirmed small papillary RCC.
■Computed tomography
CT has higher sensitivity for detection of small renal lesions compared to conventional US. A study comparing sensitivities of CT and US for detection of renal lesions in 189 small renal masses showed that US failed to identify 65 lesions visible on CT and only one lesion missed by CT was identified by US [7]. Several morphologic features can be evaluated, including internal content (calcifications, fat, areas of necrosis, septations, mural nodules, cystic component) and measurable enhancement. Diagnostic accuracy of CT is reported to be up to 95% [8] and is the most widely used method. Current imaging technique allows rapid acquisition of thin-slice images during short breath hold, minimizing motion and misregistration artefacts commonly seen on MRI studies.
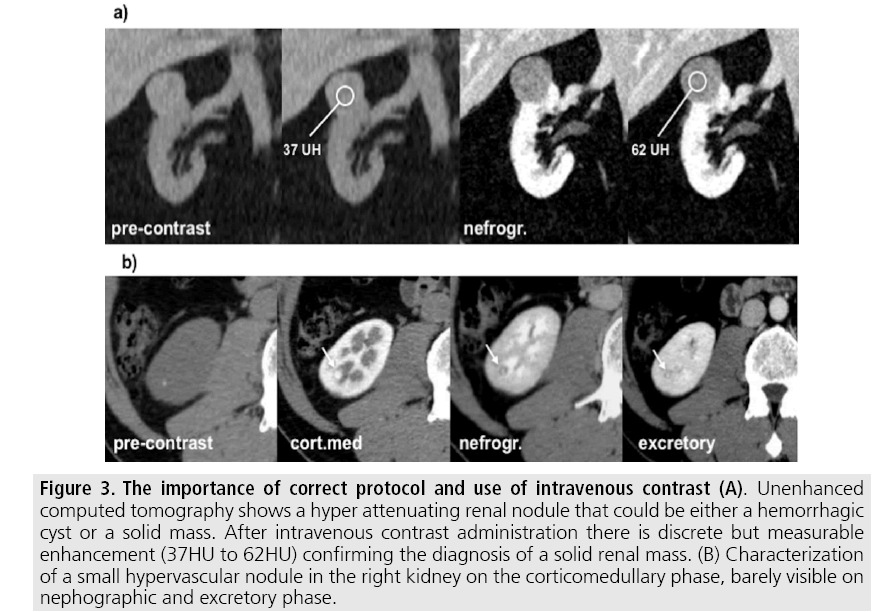
Appropriate protocol includes unenhanced phase followed by three postcontrast phases: corticomedullary, nephrographic and excretory phases (TABLE 1). Unenhanced images allow detection of calcifications, hemorrhagic and fat components, and serve as baseline for enhancement measurement. Corticomedullary phase is an arterial phase acquisition performed 40-60 s after contrast administration and exhibits maximum differentiation between the cortex and medulla (heterogeneous nephrogram) [4]. This phase helps to detect small hypervascular renal mass and allows assessment of tumor vascularity, renal artery segmentation and potential anatomical variations, useful information for surgical planning (FIGURE 3). Nephrographic phase is performed 80-100 s after contrast administration, and cortex and medulla exhibit similar enhancement (homogenous nephrogram). This phase helps to detect small renal masses missed on corticomedullary phase, essentially hypovascular lesions [8].
| Unenhanced | Corticomedullary | Nephrographic | Delayed | |
|---|---|---|---|---|
| Scan Delay | not applicable | Fixed, 40-60 s after contrast injection | Fixed, 80-100 s after contrast injection | Fixed, 5-7 min after contrast injection |
| Detector Configuration | 0.5 mm × 80 | 0.5 mm × 80 | 0.5 mm × 80 | 0.5 mm × 80 |
| Reconstruction Thickness | 1 mm | 2 mm | 2 mm | 3 mm |
Table 1: MDCT Parameters for the four acquisition phases.
Figure 3: The importance of correct protocol and use of intravenous contrast (A). Unenhanced computed tomography shows a hyper attenuating renal nodule that could be either a hemorrhagic cyst or a solid mass. After intravenous contrast administration there is discrete but measurable enhancement (37HU to 62HU) confirming the diagnosis of a solid renal mass. (B) Characterization of a small hypervascular nodule in the right kidney on the corticomedullary phase, barely visible on nephographic and excretory phase.
Excretory phase is performed 5-7 min after contrast administration and helps to delineate the relationship of the mass and collecting system and also differentiate parenchymal from urothelial masses.
Besides multi-phase image acquisition, narrow collimation, reduced pitch and thin overlapping reconstructions should be optimized. Additionally, multiplanar reformations should be routinely performed since minor contour deformation and polar lesion can be difficult to identify on axial images [9].
■Magnetic resonance
Compared to CT, MRI has better contrast resolution and lack ionizing radiation [10]. Inconclusive findings on CT, such as questionable enhancement on small renal lesions, as well as pediatric patients, pregnant and patients with contraindications to iodinated contrast media can be better evaluated by MRI [11].
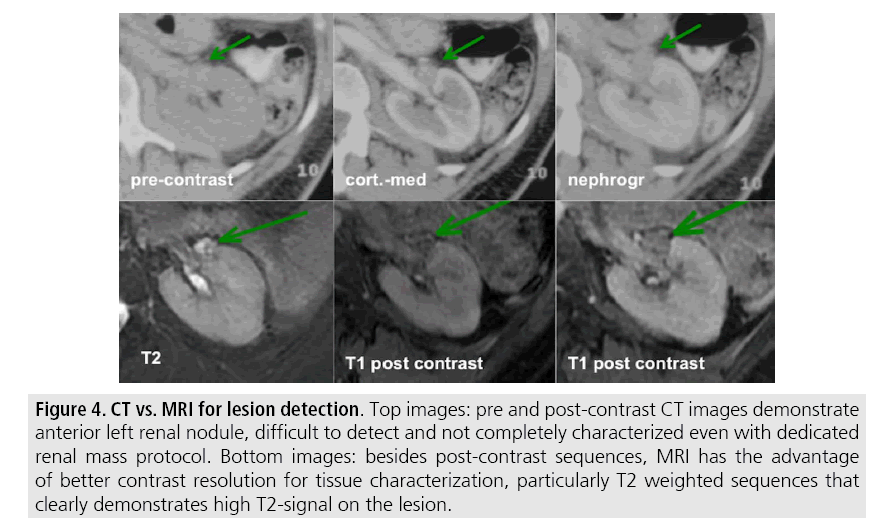
In our institution, MRI protocol for renal masses includes: T2-weighted images (WI), chemical shift imaging (T1-WI in-phase and out-of-phase), diffusion-weighted image (DWI), fat-suppressed T1-WI gradientrecalled echo sequences performed before and after the administration of intravenous gadolinium contrast on the coronal plane, and subtraction post-processing technique (TABLE 2). Multiplanar imaging is also recommended, because small renal nodules may be better depicted in a particular imaging plane due to renal orientation [12] (FIGURE 4).
| Sequence | Imaging Plane | Physiology | Volumetry | FOV | Section Thickness (mm) | Matrix | TR/TE | Reconstruction thickness (mm) |
|---|---|---|---|---|---|---|---|---|
| AX T2WI Fat-suppressed | Axial | Respiratory-triggered | 2D | 34 | 6 | - | 79/283-14000 | 1 mm |
| DWI (b0/50) | Axial | Respiratory-triggered | 2D | 34 | 6 | 224 × 256 | 1.0/ 13332 | 1 mm |
| DWI (b400/800) | Axial | Respiratory-triggered | 2D | 34 | 6 | 224 × 256 | 15485 | 1 mm |
| T2 SSFSE | Coronal | Breath-hold | 2D | 38 | 5 | 256 × 224 | 120/minimum | 1 mm |
| T2WI | Axial | Breath-hold | 2D | 34 | 5 | 256 × 192 | 160/4100 | 1 mm |
| Chemical shift (IP+OP) | Axial | Breath-hold | 2D | 34 | 3.8 | 256 × 192 | minimum-4.2/6.2 | 1 mm |
| Chemical shift (IP+OP) | Coronal | Breath-hold | 2D | 30 | 5 | 256 × 160 | 2.2; 4.5/230 | 1 mm |
| GRE T1WI Fat-suppressed pre contrast | Axial+Coronal | Breath-hold | 3D | 38 | 3.8 | 256 × 224 | 1.4/3.3 | - |
| Post-gadolinium dynamic Fat-suppressed GRE | Coronal+Axial (delayed) | Breath-hold | 3D | 38 | 3.8/3.4 (delayed) | 256 × 224 | 1.9/4.4 | - |
Table 2: Multiparametric MRI protocol.
Figure 4: CT vs. MRI for lesion detection. Top images: pre and post-contrast CT images demonstrate anterior left renal nodule, difficult to detect and not completely characterized even with dedicated renal mass protocol. Bottom images: besides post-contrast sequences, MRI has the advantage of better contrast resolution for tissue characterization, particularly T2 weighted sequences that clearly demonstrates high T2-signal on the lesion.
Subtraction images are considered a problem-solving tool when evaluating subtle enhancement on MRI, particularly when intralesional hemorrhagic or proteinaceous contents generate high signal intensity on precontrast T1-weighted images [13]. Densely calcified and heterogeneous hemorrhagic masses are better evaluated on MRI since pseudoenhancement that occurs on CT due to beam hardening effect is not present on MRI.
There are several image acquisition–related pitfalls that may result in detection mistakes, especially in less experienced users. Respiratory motion artifacts may difficult the detection of enhancing septations and small mural nodules within cystic masses. Additionally, variations in breath-hold sequences may cause misregistration artefacts on subtraction post-processed images. In these situations, user-positioned regions of interest (ROIs) may help characterize enhancement based on relative increase in signal intensity of pre and post-contrast images (more than 15-20%), once same acquisition parameters are used [14]. Reduction of motion artifacts can be achieved with motion correction algorithms and by end-expiratory breath hold, which is more reproducible when compared with end-inspiration [4,10].
Interpretation mistakes
■Normal anatomical structures
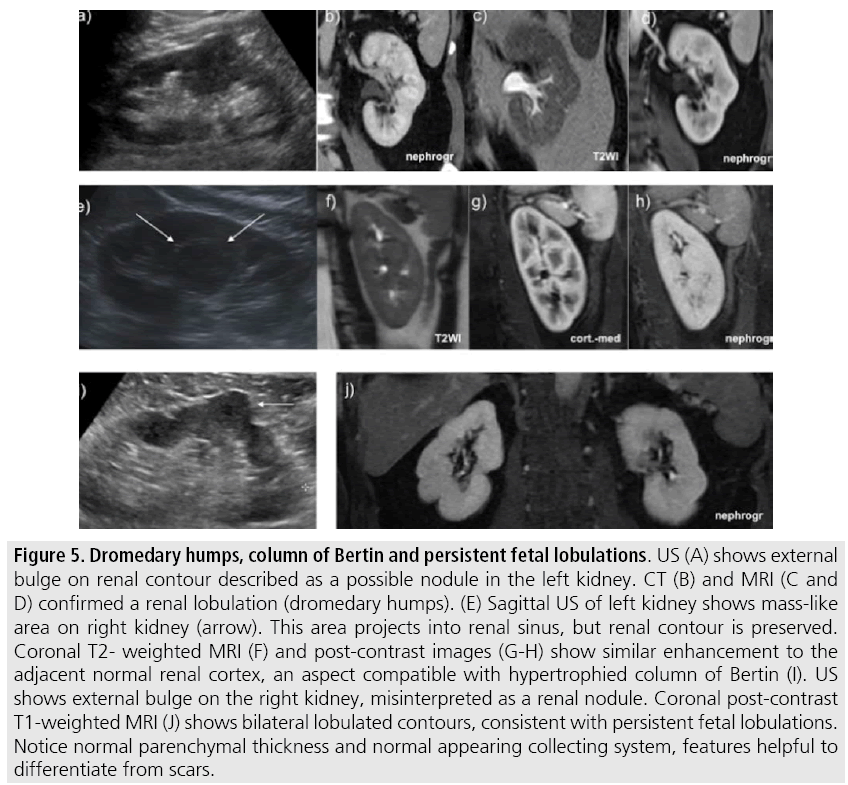
Normal renal structures may mimic cystic or solid neoplasm on imaging studies. On US, extensions of renal cortex between renal pyramids (also known as hypertrophied columns of Bertin) may appear as solid mass projecting into renal sinus [15]. Similarly, normal renal parenchyma adjacent to a scarring can be misinterpreted as solid mass (FIGURES 5A-D). Both of these pitfalls are easily identified on CT and MRI, as the attenuation or signal intensity and enhancement are identical to normal renal cortex on all phases and sequences [2] (SUPPLEMENTARY FIGURE 2).
Figure 5: Dromedary humps, column of Bertin and persistent fetal lobulations. US (A) shows external bulge on renal contour described as a possible nodule in the left kidney. CT (B) and MRI (C and D) confirmed a renal lobulation (dromedary humps). (E) Sagittal US of left kidney shows mass-like area on right kidney (arrow). This area projects into renal sinus, but renal contour is preserved. Coronal T2- weighted MRI (F) and post-contrast images (G-H) show similar enhancement to the adjacent normal renal cortex, an aspect compatible with hypertrophied column of Bertin (I). US shows external bulge on the right kidney, misinterpreted as a renal nodule. Coronal post-contrast T1-weighted MRI (J) shows bilateral lobulated contours, consistent with persistent fetal lobulations. Notice normal parenchymal thickness and normal appearing collecting system, features helpful to differentiate from scars.
Dromedary humps represent normal variants of the renal contour, but can mimic renal mass on US. They are characterized by focal bulges on the lateral border and are caused by splenic impression onto superolateral left kidney. They are easily recognized on CT and MR since they exhibit the same attenuation or signal intensity and enhancement as the surrounding normal renal parenchyma (FIGURES 5E-F).
Persistent fetal lobulations may be misdiagnosed as kidney scarring [16]. Small indentations of the renal cortex without cortical thinning, abnormal enhancement or retracted underlying collecting system are clues to diagnosis of persistent fetal lobulation (FIGURES 5H-I).
■Renal malignant mass mimickers
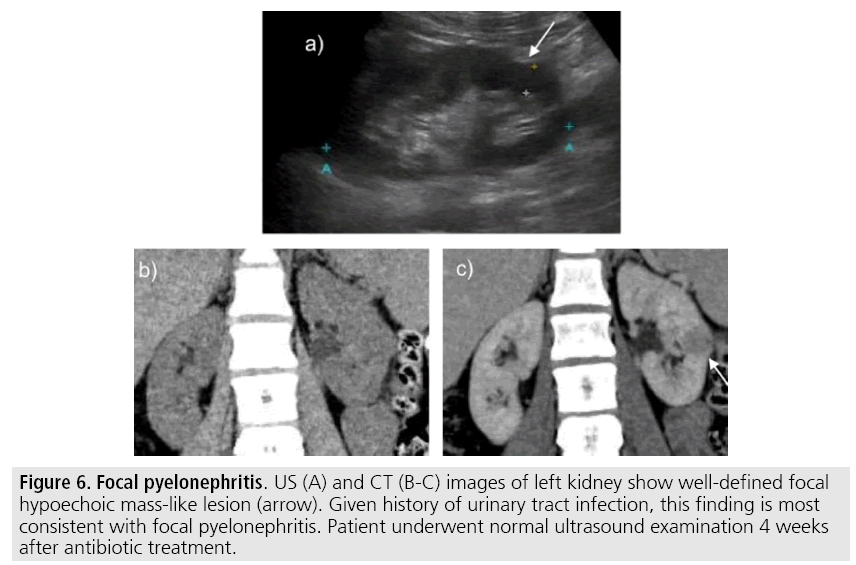
Congenital anomalies, inflammatory masses and vascular structures can have similar appearance to renal neoplasm on imaging exams and clinical context is very helpful to distinguish these entities. When typical clinical findings of infection are not present, focal pyelonephritis may mimic solid renal neoplasm or if an abscess is present, a complex cystic neoplasm (FIGURE 6). In these cases, a poorly defined interface between the infection and the renal parenchyma, edema of the surrounding renal parenchyma or asymmetric perinephric stranding may be a hint to proper diagnosis [17]. In doubtful cases, percutaneous aspiration or follow-up CT examination should be performed - a time interval of one to three months will allow acute changes to subside [2].
Figure 6: Focal pyelonephritis. US (A) and CT (B-C) images of left kidney show well-defined focal hypoechoic mass-like lesion (arrow). Given history of urinary tract infection, this finding is most consistent with focal pyelonephritis. Patient underwent normal ultrasound examination 4 weeks after antibiotic treatment.
Pseudo-enhancement refers to a phenomenon that causes artificially increased attenuation values in small renal cysts on contrast-enhanced images and they may be misinterpreted as enhancing renal nodules on CT. This phenomenon is thought to be secondary to a combination of partial volume averaging effect and image reconstruction algorithms used to adjust for “beam-hardening” artefacts [18,19]. When evaluating questionable enhancement of small renal lesions or centrally located lesions on CT, MRI may be useful [20].
Although high-density lesions (20-70 HU) on unenhanced CT images usually represent hemorrhagic cysts, those lesions should be considered indeterminate and be referred for adequate post-contrast protocols. Solid neoplasms may exhibit the same attenuation on unenhanced phase, but are usually more heterogeneous, a feature more easily recognized on narrow windows [21].
One of the greatest renal mass malignant mimicker is minimal-fat angiomyolipoma (AML), the most commonly resected benign renal mass in surgical series [22]. On CT, minimalfat AML usually presents as hypervascular solid lesion with increased density compared to renal cell carcinoma (RCC) on unenhanced CT phase; however, overlap in density values limit this diagnostic utility. On MRI, minimal-fat AML exhibit low T2-signal, a characteristic that might help to differentiate from conventional clear cell RCC and hypervascularity that helps to differentiate from papillary RCC.
Benign lesions may exhibit restricted diffusion on DWI and mimic neoplasia. Classic AML, minimal-fat AML and chronic haemorrhagic cysts may show restricted diffusion and similar ADC values compared to papillary RCC [23]. Presence of intravoxel fat on chemical shift MRI (signal drop on opposed-phase gradient-echo MR images) is a feature that cannot be used to distinguish between minimal-fat AML and clear cell RCC, since both lesions can demonstrate variable amounts of microscopic fat [24].
■Malignant processes mimicking noncancerous abnormalities
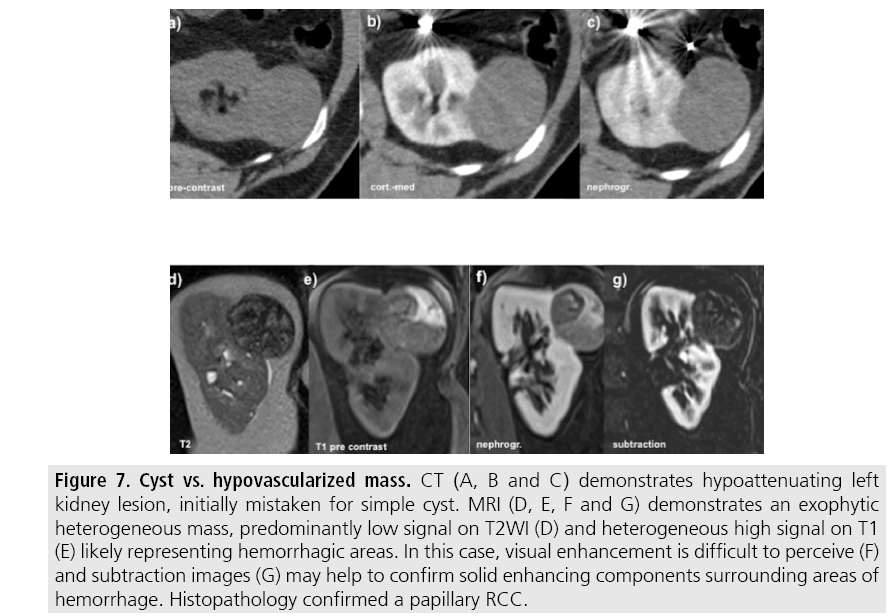
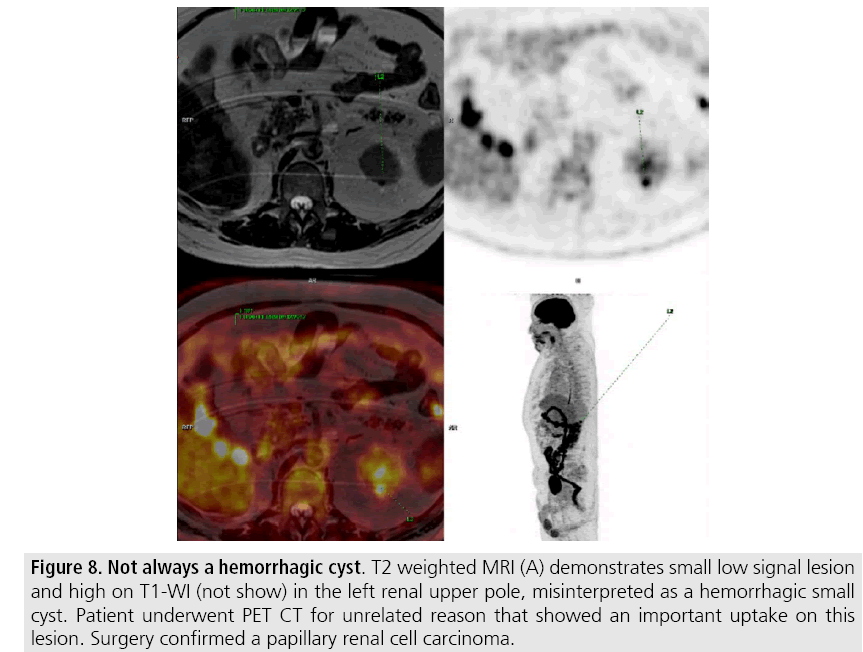
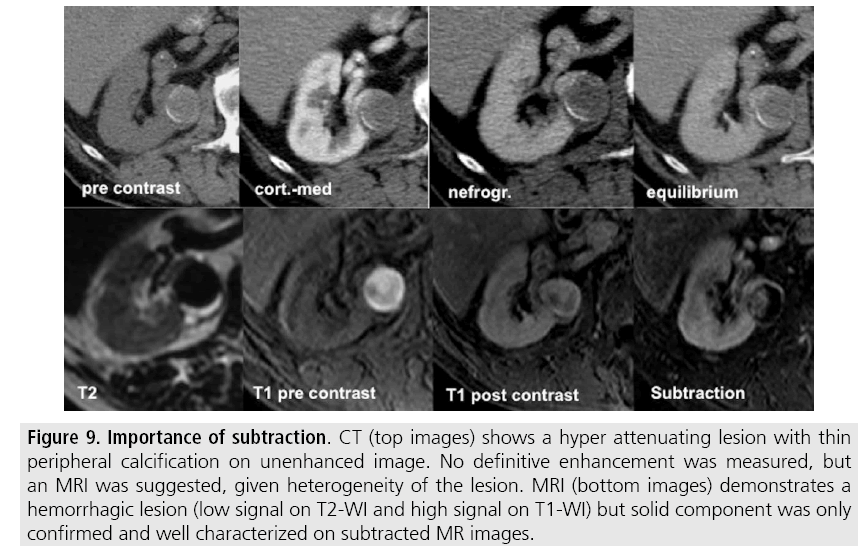
Most malignant renal neoplasms are clear cell subtype of RCC and demonstrates avidly enhancement after intravenous contrast media and are easily diagnosed on CT. However, papillary variant of RCC shows papillary architecture and very small vessels, usually presenting as hypovascular lesions that can be misdiagnosed as renal cyst on CT (FIGURES 7 and 8) [25]. Visual analysis is challenging and ROI should always be placed on those lesions to confirm enhancement (more than 20 HU increase in attenuation). In doubtful cases, MRI should be performed given higher contrast resolution (FIGURE 9).
Figure 7: Cyst vs. hypovascularized mass. CT (A, B and C) demonstrates hypoattenuating left kidney lesion, initially mistaken for simple cyst. MRI (D, E, F and G) demonstrates an exophytic heterogeneous mass, predominantly low signal on T2WI (D) and heterogeneous high signal on T1 (E) likely representing hemorrhagic areas. In this case, visual enhancement is difficult to perceive (F) and subtraction images (G) may help to confirm solid enhancing components surrounding areas of hemorrhage. Histopathology confirmed a papillary RCC.
Figure 8: Not always a hemorrhagic cyst. T2 weighted MRI (A) demonstrates small low signal lesion and high on T1-WI (not show) in the left renal upper pole, misinterpreted as a hemorrhagic small cyst. Patient underwent PET CT for unrelated reason that showed an important uptake on this lesion. Surgery confirmed a papillary renal cell carcinoma.
Figure 9: Importance of subtraction. CT (top images) shows a hyper attenuating lesion with thin peripheral calcification on unenhanced image. No definitive enhancement was measured, but an MRI was suggested, given heterogeneity of the lesion. MRI (bottom images) demonstrates a hemorrhagic lesion (low signal on T2-WI and high signal on T1-WI) but solid component was only confirmed and well characterized on subtracted MR images.
Conclusion
There are several pitfalls in renal lesion evaluation, including detection and interpretation mistakes. Although usually the first imaging modality, US has low sensitivity for the detection of renal lesions, particularly those projecting into the renal sinus. Small lesions and hemorrhagic lesions may be difficult to evaluate on CT and ROIs should be placed on every renal mass evaluated. All indeterminate renal lesions should be further evaluated with MRI (dedicated protocol), and post-contrast sequences should be post-processed to obtain subtraction images.
References
- Barr RG, Peterson C, Hindi A. Evaluation of indeterminate renal masses with contrast-enhanced US: A diagnostic performance study. Radiol. 271, 133-142 (2014).
- Bradley AJ, Lim YY, Singh FM. Imaging features, follow-up and management of incidentally detected renal lesions. Clin. Radiol. 66, 1129-1139 (2011).
- Chow WH, Devesa SS, Warren JL et al. Rising incidence of renal cell cancer in the United States. JAMA. 281, 1628-1631 (1999).
- Katabathina VS, Shiao J, Flaherty E et al. Cross-sectional imaging of renal masses: Image interpretation-related potential pitfalls and possible solutions. Semin. Roentgenol. 51, 40-48 (2016).
- Stakhovskyi O, Yap SA, Leveridge M et al. Small renal mass: What the urologist needs to know for treatment planning and assessment of treatment results. AJR. Am. J. Roentgenol. 196, 1267-1273 (2011).
- Atri M, Tabatabaeifar L, Jang HJ et al. Accuracy of contrast-enhanced US for differentiating benign from malignant solid small renal masses. Radiol. 276, 900-908 (2015).
- Jamis DCA, Choyke PL, Jennings SB et al. Small (<or=3 cm) renal masses: Detection with CT versus US and pathologic correlation. Radiol. 198, 785-788 (1996).
- Garant M, Bonaldi VM, Taourel P et al. Enhancement patterns of renal masses during multiphase helical CT acquisitions. Abdom. Imaging. 23, 431-436 (1998).
- Johnson PT, Horton KM, Fishman EK. Optimizing detectability of renal pathology with MDCT: Protocols, pearls, and pitfalls. AJR. Am. J. Roentgenol. 194, 1001-1012 (2010).
- Ramamurthy NK, Moosavi B, McInnes MD et al. Multiparametric MRI of solid renal masses: Pearls and pitfalls. Clin. Radiol. 70, 304-316 (2015).
- Heilbrun ME, Remer EM, Casalino DD et al. ACR Appropriateness criteria indeterminate renal mass. J. Am. Coll. Radiol. 12, 333-341 (2015).
- Willatt JM, Hussain HK, Chong S et al. MR imaging in the characterization of small renal masses. Abdom. Imaging. 39, 761-769 (2014).
- Pedrosa I, Sun MR, Spencer M et al. MR imaging of renal masses: Correlation with findings at surgery and pathologic analysis. Radiographics. 28, 985-1003 (2008).
- Hecht EM, Israel GM, Krinsky GA, et al. Renal masses: quantitative analysis of enhancement with signal intensity measurements versus qualitative analysis of enhancement with image subtraction for diagnosing malignancy at MR imaging. Radiol. 232, 373-378 (2004).
- Son J, Lee EY, Restrepo R et al. Focal renal lesions in pediatric patients. AJR. Am. J. Roentgenol. 199, 668-682 (2012).
- Akbar SA, Shirkhoda A, Jafri SZ. Normal variants and pitfalls in CT of the gastrointestinal and genitourinary tracts. Abdom. Imaging. 28, 115-128 (2003).
- Israel GM, Bosniak MA. Pitfalls in renal mass evaluation and how to avoid them. Radiographics. 28, 1325-38 (2008).
- Birnbaum BA, Hindman N, Lee J et al. Renal cyst pseudo-enhancement: Influence of multi-detector CT reconstruction algorithm and scanner type in phantom model. Radiol. 244, 767-775 (2007).
- Israel GM, Bosniak MA. How I do it: Evaluating renal masses. Radiol. 236, 441-450 (2005).
- Kang SK, Huang WC, Pandharipande PV et al. Solid renal masses: What the numbers tell us. AJR. Am. J. Roentgenol. 202, 1196-1206 (2014).
- Lee FSA, Felker ER, Tan N et al. Qualitative and quantitative MDCT feature for differentiating clear cell renal cell carcinoma from other solid renal cortical masses. AJR. Am. J. Roentgenol. 203, 516-524 (2014).
- Frank I, Blute ML, Cheville JC et al. Solid renal tumors: An analysis of pathological features related to tumor size. J. Urol. 170, 2217-2220 (2003).
- Lassel EA, Rao R, Schwenke C et al. Diffusion-weighted imaging of focal renal lesions: A meta-analysis. Eur. Radiol. 24, 241-249 (2014).
- Jhaveri KS, Elmi A, Hosseini NH et al. Predictive value of chemical-shift MRI in distinguishing clear cell renal cell carcinoma from non-clear cell renal cell carcinoma and minimal-fat angiomyolipoma. AJR. Am. J. Roentgenol. 205, 79-86 (2015).
- Scialpi M, Di Maggio, Midiri M et al. Small renal masses: assessment of lesion characterization and vascularity on dynamic contrast-enhanced MR imaging with fat suppression. AJR. Am. J. Roentgenol. 175, 751-757 (2000).
