Research Article - Neuropsychiatry (2018) Volume 8, Issue 4
Identification of Schizophrenic Patients and Healthy Controls Based on Musical Perception Using AEP Analysis
Tsung-Hao Hsieh1, Kuan-Yi Wu2 and Sheng-Fu Liang1,†
1Department of Computer Science and Information Engineering, National Cheng Kung University, Tainan, Taiwan
2Department of Psychiatry, Chang Gung Memorial Hospital at Linkou, College of Medicine, Chang Gung University Taoyuan, Taiwan
- Corresponding Author:
- Sheng-Fu Liang
Department of Computer Science and Information Engineering, National Cheng Kung University, Tainan, Taiwan
Abstract
Schizophrenia (SZ) is one of the least understood and most costly mental disorders in terms of human suffering and societal costs. The diagnosis of SZ involves individual evaluations of the severity of the characteristic symptoms and coupled with social or occupational dysfunction, for at least six months in the absence of another diagnosis that would better account for the presentation. However the pathophysiology of schizophrenia remains unclear and the patients with schizophrenia are believed to be heterogeneous, there are no laboratory tests or biomarkers used as directly diagnostic tools at present. The aim of this study is to propose an objectively distinguishing method for identification SZ by analyzing physiological information. An auditory event-related potential (AEP)-based schizophrenia-classification system in which passive and response-free listening to musical intervals and chord stimuli were used to reduce the workload involved in identifying SZ is developed. A feature selection strategy combines discrimination and correlation analysis is also proposed to select key features and remove redundancy. Two AEP components, amplitude of N1 evoked by chord stimuli and amplitude of P2 evoked by interval stimuli from the frontal lobe, were screened and fed to the linear discriminate analysis (LDA) for classification. The accuracy reaches 83.33% through leave-one-out cross-validation from 12 SZ and 12 healthy subjects. Due to the advantages associated with the recording process and feature analysis, it is expected to be a useful tool to help us understand abnormalities of brain function and a potential biomarker to subgroup endophenotypes in schizophrenia.
Keywords
Schizophrenia, Musical perception, Auditory evoked potential, Eature selection, Linear discriminate analysis, Biomarker
Introduction
Schizophrenia (SZ) is one of least understood and most costly psychiatric disorders in terms of human suffering and societal costs [1], and it occurs in 1% of the general American population [2], the similar life-time prevalence in other countries all over the world. It is commonly associated with impairments in social and occupational functioning, and its manifestations include positive (hallucinations or delusions) and negative (apathy or anhedonia) symptoms, cognitive impairment as well as abnormalities in mood and anxiety. According to the diagnostic statistical manual of mental disorders (DSM-V) [3], a diagnosis of schizophrenia is based on the presence of such characteristic symptoms, coupled with social or occupational dysfunction, for at least six months in the absence of another diagnosis that would better account for the presentation.
During the past two decades, researchers have been increasingly interested in finding objective biomarkers to provide the more objective, accurate and precise means of assessing actual and potential psychiatric conditions [4]. Due to this trend, it is a significant change in DSM-V that electroencephalography (EEG) spectrum ration has been included as a reference to assist the diagnosis of adult ADHD [3]. Endophenotype approaches in schizophrenia are also increasingly employed by researchers, based on the presumption that endophenotypes have more straightforward inheritance patterns and are coded by smaller numbers of genes than the complex, heterogeneous phenomenological entities such as DSM. The interventions may have the potential to offer the greatest benefit during the early stages of a disorder supported by the endophenotype or pre-emptive approaches [5].
The brain-imaging technologies such as EEG [6-8] and magnetic resonance imaging (MRI) [9-12] have been used to non-invasively examine structural or functional biomarkers in the brain associated with schizophrenia. The abnormalities have been found in the temporal lobe and superior temporal gyrus, which are close to the auditory cortical regions of the brain [13,14]. The observed differences between normal and schizophrenic brains on EEG or MRI can be extracted and fed to the classifier for objective computer-based diagnosis. The reported accuracy of these studies is between 70 and 90% [15-19]. These techniques have potential for being integrated with diagnostic evaluation by psychiatrists to obtain a more confident diagnosis of schizophrenia.
Due to its high convenience and low cost compared to MRI, EEG is relatively rapid and accessible as a brain-imaging approach; it thus has high potential for use in schizophrenia diagnosis. Early studies sought a correlation between schizophrenia and spectral components of the EEG [20]. Since 90’s, a growing number of researchers have focused on abnormal cognitive processing in schizophrenia, especially in terms of auditory perceptions [21] and the relationships of hallucinations or delusions. The best-replicated findings include a reduction in the amplitude of the P3 component (P300) [7,8,22], mismatch negative (MMN) [23,24] and failure to inhibit the second response to paired-click stimuli (p50) [8] and a gating deficit in the N1 and P2 components [25-29]. Based on the reduced P300 amplitude seen in patients with schizophrenia, the accuracy of classifying normal subjects and schizophrenia patients through auditory odd-ball tasks ranged from 70 to 80% [17,18,30].
In addition to oddball tasks in which subjects were asked to detect pure tonal stimuli [8], passive and response-free listening tasks using musical stimuli with different degrees of complexity and consonance have been designed to investigate functional abnormalities in the cortical processing of sound complexity and music consonance in patients with schizophrenia [31]. Schizophrenic patients exhibited significant reductions in the amplitudes of the N1 and P2 components elicited by musical stimuli. Consonant sounds contribute significantly more to this response than dissonant sounds do.
In this paper, we propose an auditory event-related potential (AEP) based schizophrenia classification system. Passive and response-free listening to musical intervals and chords [31] were used to reduce the workload associated with diagnosis, and EEGs were recorded to objectively measure brain activity. Statistical analysis was applied to the AEPs of normal subjects and patients with schizophrenia to detect differences in components and channels. A featureextraction method is proposed herein to select the key feature and remove redundancy in linear discriminate analysis (LDA) for identifying schizophrenia. Two evaluation experiments including cross-subject and cross-session validations were designed to test the robustness and consistency of the proposed method.
Material and Method
▪ AEP recordings
Subjects: Auditory evoked potentials (AEP) from twelve medicated day-hospital patients with schizophrenia and twelve age- and sex-matched healthy controls were used to construct and evaluate the proposed schizophrenia-classification system. All subjects were right-handed, reported normal hearing, and had not received any formal music training. They were also screened to exclude patients with a history of seizures, other neurological damage or illness, or a history of substance abuse. Each subject group comprised 8 females and 4 males who ranged in age from 20 to 29 years, with a mean (SD) age of 24.7 (2.8) years. Schizophrenia diagnoses were confirmed according to the DSM-IV criteria on the basis of a clinical interview and a review of the case files, and the severity of psychopathological symptoms was evaluated by a semi-structured interview using the Positive and Negative Syndrome Scale (PANSS) [32]. Control group participants were excluded if they had a current or past history of any psychiatric illness. The patient group consisted of patients with schizophrenia, with a mean duration of illness (SD) of 6.1 (2.5) years prior to testing. The mean (SD) PANSS score in the patient group was 59.5 (8.0), and the mean (SD) scores in the three subscales (the Positive, Negative and General Psychopathology scales) were 13.6 (2.4), 16.1 (3.7) and 29.8 (5.1), respectively. At the time of testing, all schizophrenic patients were receiving treatment with atypical antipsychotic medication; two were being treated with Olanzapine 15 mg/d, two with Clozapine (mean dosage 375 mg/d, 200 and 550 mg/d), three with oral Risperidone (mean dosage 4 mg/d, range 2-6 mg/d), four by Risperidone intramuscular injection (mean dosage 43.75 mg, range 37.5-50 mg every two weeks) and one with Zotepine (400 mg/d). One of the two patients being treated with Clozapine was also receiving combination therapy consisting of Sulpride (100 mg/d); one of the three being treated with oral Risperidone was receiving Haloperidone (7.5 mg/d) in combination; another was receiving 20 mg Flupenthixol decanoate injection every week; two patients were taking mood stabilizers (lithium, sodium valproate); and another two were taking an antidepressant (Fluoxetine). This study was approved by the Institutional Review Board of Chang Gung Memorial Hospital. All subjects gave written informed consent for the procedures before AEP testing.
Stimuli: The auditory stimuli used in this study were musical sounds with various degrees of complexity and consonance. They consisted of two types of sonic entities: intervals (combinations of two pitches) and chords (combinations of three pitches). Table 1 shows the interval stimuli that contained two types of pitch intervals: perfect fifths (7 semitones, consonant intervals) and tritones (6 semitones, dissonant intervals), which were generated by summing two sinusoidal tones. A perfect fifth is more consonant than a tritone due to simpler frequency ratios. Each type of interval contained 12 sound stimuli, and there were a total of 24 stimuli in the intervals. Table 2 shows the chord stimuli that combined 3 pitches to construct major triads (consonance), diminished triads (dissonance), and atonal chords (lack of a tonal center). There were a total of 36 different chords and 3 chords per type (major, diminished and atonal chords). All 60 stimuli were tuned to the equal-tempered chromatic scale in the range of G# (104 Hz) to E5 (659 Hz) and were created at a fixed amplitude with 16-bit resolution and 44.1-kHz sampling rate. Each sound stimulus lasted for 350 ms, with a 100-ms fade-out time.
| Interval | |
|---|---|
| Perfect fifth | Tritone |
| #G2 (103.8)+#D3 (155.5) | B2 (123.4)+F3 (174.5) |
| B2 (123.4)+#F3 (184.9) | #C3 (138.5)+G3 (195.9) |
| #C3 (138.5)+#G3 (207.6) | E3 (164.7)+#A3 (233) |
| E3 (164.7)+B3 (246.9) | F3 (174.5)+B3 (246.9) |
| F3 (174.5)+C4 (261.6) | G3 (195.9)+#C4 (277.1) |
| G3 (195.9)+D4 (293.6) | #G3 (207.6)+D4 (293.6) |
| #A3 (233)+F4 (349.1) | #A3 (233)+E4 (329.5) |
| C4 (261.6)+G4 (391.9) | C4 (261.6)+#F4 (369.9) |
| #D4 (311)+#A4 (466.1) | #D4 (311)+A4 (440) |
| E4 (329.5)+B4 (493.8) | F4 (349.1)+B4 (493.8) |
| #F4 (369.9)+#C5 (554.3) | #F4 (369.9)+C5 (523.2) |
| A4 (440)+E5 (659.1) | A4 (440)+#D5 (622.1) |
Table 1: Stimuli of interval group: perfect-fifth intervals and tritone intervals (Hz).
| Chord | ||
|---|---|---|
| Atonal Chords | Diminished Chords | Major Chords |
| A2 (109.9)+#D3 (155.5)+E4 (329.59) | #A2 (116.5)+E3 (164.7)+#C4 (277.1) | #G2 (103.8)+#D3 (155.5)+C4 (261.6) |
| #A2 (116.5)+A3 (219.9)+#D4 (311) | C3 (130.8)+#F3 (184.9)+#D4 (311) | #A2 (116.5)+F3 (174.5)+D4 (293.6) |
| C3 (130.8)+#F3 (184.9)+F4 (349.1) | #C3 (138.5)+G3 (195.9)+E4 (329.5) | B2 (123.4)+#F3 (184.9)+#D4 (311) |
| #C3 (138.5)+C4 (261.6)+#D4 (311.9) | #D3 (155.5)+A3 (219.9)+#F4 (369.9) | #C3 (138.5)+#G3 (207.6)+F4 (349.1) |
| #D3 (155.5)+#F3 (184.9)+F4 (349.1) | E3 (164.7)+#A3 (233)+G4 (391.9) | D3 (146.8)+A3 (219.9)+#F4 (369.9) |
| E3 (164.7)+#D4 (311)+A4 (440) | F3 (174.5)+B3 (246.9)+#G4 (415.2) | E3 (164.7)+B3 (246.9)+#G4 (415.2) |
| F3 (174.5)+#C4 (277.1)+C5 (523.2) | #F3 (184.9)+C4 (261.6)+A4 (440) | F3 (174.5)+C4 (261.6)+A4 (440) |
| #F3 (184.9)+F4 (349.1)+#G4 (415.2) | #G3 (207.6)+D4 (293.6)+B4 (493.8) | #F3 (184.9)+#C4 (277.1)+#A4 (466.1) |
| #G3 (207.6)+B3 (246.9)+#A4 (466.1) | A3 (219.9)+#D4 (311)+C5 (523.2) | G3 (195.9)+D4 (293.6)+B4 (493.8) |
| A3 (219.9)+#G4 (415.2)+D5 (587.2) | B3 (246.9)+F4 (349.1)+D5 (587.2) | A3 (219.9)+E4 (329.5)+#C5 (554.3) |
| B3 (246.9)+F4 (349.1)+E5 (659.1) | C4 (261.6)+#F4 (369.9)+#D5 (622.1) | #A3 (233)+F4 (349.1)+D5 (587.2) |
| C4 (261.6)+#D4 (311)+D5 (587.2) | #C4 (277.1)+G4 (391.9)+E5 (659.1) | C4 (261.6)+G4 (391.9)+E5 (659.1) |
Table 2: Stimuli of chord group: atonal chords, diminished chords, and major chords (Hz).
▪ Procedure
Subjects sat in a chair and wore a set of whole-ear headphones (Audio-Technica Ath-Pro5) for binaural stimulus presentation. They were asked to keep their eyes closed throughout the experiment. Each stimulus (24 intervals and 36 chords) was repeated 2 times (total 120 trials) in one session of the passive and responsefree listening experiment, and the stimuli were presented randomly with an inter-stimulus interval (ISI) randomized in the range of 2-4 s to minimize the effect of expectancy. Each subject participated in five sessions with a short rest in between.
EEGs were continuously recorded in DC mode at a sampling rate of 1000 Hz using 32 electrodes mounted in elastic caps and referenced to A1- A2, in accordance with the 10-20 international system. The electrode locations included the fortal (FP1, FP2, F3, FZ and F4), central (C3, Cz and C4), parietal (P3, Pz and P4), occipital (O1 and O2), and bilateral (F7, T3, T5 F6, T4 and T6) lobes. The horizontal/vertical EOG signals were also recorded [33]. The impedance at each scalp electrode was kept below 5 KΩ. The EEG signals were amplified using a Neuroscan- NuAmp, and the filter settings were DC 100 Hz with 6 dB/octave attenuation. The digitized EEG data were passed through a digital band-pass filter of 0.5-30 Hz (EEGLAB, FIR filter) to eliminate slow drifts and muscular artifacts.
▪ Schizophrenia classification system
Data preprocessing: The recorded EEG data from the 200 ms prior to and 1000 ms following the onset of each stimulus were segmented. To reduce the differences in component amplitudes in computation and prevent baseline drift, ~200- 0 ms signals were used as a baseline to correct the 0-1000 ms signals in each data point. The rejection level to detect eye artifacts (including eye blinks, eye movements and extra-ocular muscle activity) was set at ± 100 μV, and trials in which the data exceeded this level were excluded. After artifact rejection, all trials were averaged separately for each condition, e.g., complexity (interval and chord) and consonance (tritone and perfect fifth; major, diminished and atonal chords). The N1 and P2 components, which represent the first large negative amplitude and the second large positive amplitude after the onset of the stimulus, respectively, in the auditory evoked potentials (AEP) were extracted and analyzed as the features of the proposed schizophrenia-detection system. The peak amplitudes of the N1 and P2 components were determined as the peak reversals during the intervals of 100-150 ms and 180-250 ms, respectively, after stimulus onset. Topographic maps were generated using EEGLAB to define the spatial distributions and dynamics of activity on the scalp surface [34].
Feature extraction: The N1 and P2 components were obtained from the musical stimuli. However, the component (N1, P2) were determined by stimulus (interval, chord) and electrode placement (frontal/central, left/right). Therefore, the distinguishable feature extraction involved two steps.
(1) Finding regions of interest (ROI): the N1 and P2 are two major components evoked by the designed musical stimuli, so topographic maps were generated showing the spatial distributions and dynamics of these components on the scalp surface. Regions with strong N1 and P2 amplitudes were identified, and the electrodes within the coverage regions were further analyzed.
(2) Statistical analysis: after the electrodes with strong N1 and P2 amplitudes were selected, distinguishable features were extracted by statistical analysis. For each electrode within the ROIs, four AEP components (magnitudes of N1 (N1i) and P2 (P2i) evoked by the interval stimuli and magnitudes of N1 (N1c) and P2 (P2c) evoked by the chord stimuli) from the patients with schizophrenia and the healthy controls were analyzed by a two-sample t-test. Significant differences (p<0.05) were observed between the subject groups and were considered candidates for further analysis.
(3) Feature selection: The statistical analysis revealed eight candidate features (N1c-F4, N1c-Cz, N1c-C4, P2i-Fz, P2i-F3, P2i-F4, P2c-Fz and P2c-Cz) that showed significant differences between the groups. Table 3 shows the discriminability of each candidate features through the leave-one-out cross-validation. The accuracies of using single feature to identify schizophrenic patients and healthy controls are in the range of 62.5% to 75%. The P2i-Fz and P2i-F4 perform the best accuracy (75%) that is near to the performance of most ERP and AEP study using the brute-force selection method to find the feature combinations. However, the computational complexity of the brute-force method is O (n2 ), where n is the number of candidate features, with wasted computer power in cross-validating similar feature combinations. In this study, a feature selection strategy was proposed to efficiently select the complementary combinations. There are two main concepts in feature selection: overlap and complementary. A high degree of overlap leads to errors in classification. Statistical analysis revealed different degrees of overlap in features between the groups. The degree of overlap is important in detecting significant features. The discrimination information (DI) was used to rank the degree of distribution overlap between the data groups for classification, and correlation-based analysis was used to select complementary features.
| Features | ACC | SE | SP |
|---|---|---|---|
| N1c-Cz | 66.7% | 66.7% | 66.7% |
| N1c-F4 | 70.8% | 66.7% | 75.0% |
| N1c-C4 | 66.7% | 66.7% | 66.7% |
| P2c-Fz | 62.5% | 58.3% | 66.7% |
| P2c-Cz | 62.5% | 58.3% | 66.7% |
| P2i-F3 | 70.8% | 66.7% | 75.0% |
| P2i-Fz | 75.0% | 75.0% | 75.0% |
| P2i-F4 | 75.0% | 75.0% | 75.0% |
Table 3: Discriminability analysis of eight candidate features through the leave-one-out cross-validation. Sensitivity (SE), specificity (SP), and accuracy (ACC) of each candidate feature are presented.
(1) Discrimination index (DI): given a factor k, the discrimination information estimate consisted of two parts: the probability of overlap and the demarcation point between two groups, as shown in Equation (1).

Where Poverlap is the probability of overlap and Gaink is information gain which using the mean of SZ and HC as k-means start points to split the overlap into two clusters. In information theory and machine learning, information gain is also known as Kullback-Leibler divergence [35,36], which is a measure of entropy gain when one revises one’s beliefs from the prior probability distribution to the posterior probability distribution. The information gain is defined as Equation (2) and (3). This concept has been widely applied to the decision-tree-generation algorithms (ID3, C4.5, C5.0 and Gini index) and disease diagnosis [37,38]. Some pattern recognition and machine-learning methods also use this measure to reduce feature dimensions and feature ranking [39].

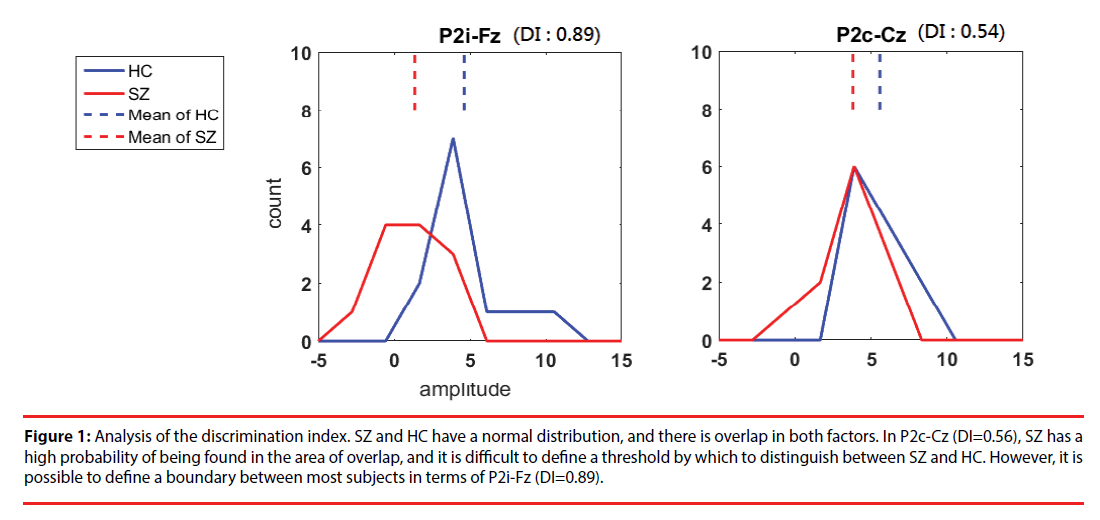
where i is the number of clusters classified by k-means. For entropy, the discrete variable j is the class SZ or HC, and Pj is the probability of obtaining classj in clusteri. Figure 1 shows examples of our DI selection. P2i-Fz (DI=0.89) is promising for discrimination; although there is overlap, a boundary can be used to identify most subjects. P2c-Cz (DI=0.56) is the least promising feature because it has a high degree of overlap and is not so useful in discriminating between SZ and HC.
Figure 1: Analysis of the discrimination index. SZ and HC have a normal distribution, and there is overlap in both factors. In P2c-Cz (DI=0.56), SZ has a high probability of being found in the area of overlap, and it is difficult to define a threshold by which to distinguish between SZ and HC. However, it is possible to define a boundary between most subjects in terms of P2i-Fz (DI=0.89).
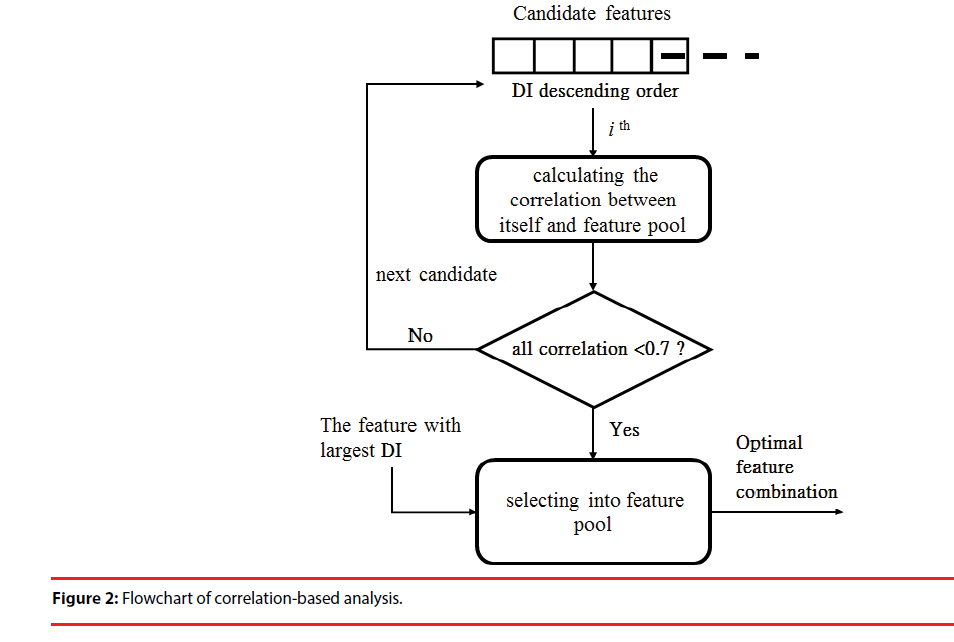
(2) Correlation-based analysis (CBA): Correlation-based analysis is a simple multivariate-selection algorithm that ranks feature subsets according to a correlation-based function [40]. In general, if the Pearson correlation coefficient between two features ranges from 0.7 to 1, the two features are highly correlated. Thus, the contributions of the two features to classification are similar and not complementary. In this step, the features with the largest DI (Figure 1) are preferentially included in the feature pool. Then, in descending order of DI, we calculated the correlation between the remaining features and each feature in the pool. If one coefficient was lower than selection upper bound (0.7), the feature was included in the pool. This step was repeated until the remaining features did not have a correlation (<0.7) with the feature pool below the bound. The feature set of the pool represents the optimal combination for the classification model (Figure 2).
The DI and CBA after feature selection are shown in Table 4. P2i-Fz had the largest DI, indicating that it would be preferentially selected into the feature pool. Although P2i-F4 was a second-order feature, it showed strong similarities to P2i-Fz (correlation greater than 0.7) and thus cannot contribute to discrimination. For this reason, it was excluded from the analysis. The next feature, N1c-F4 was chosen because the correlation (0.14) between N1c-F4 and P2i- Fz was lower than 0.7. The remaining features showed high correlations with P2i-Fz or N1c-F4 (>0.7) in the feature pool so they were not selected. Ultimately, P2i-Fz and N1c-F4 were selected for use in identifying schizophrenic patients.
| Feature | P2i-Fz | P2i-F4 | N1c-F4 | P2i-F3 | N1c-C4 | N1c-Cz | N1c-C4 | P2c-Cz |
|---|---|---|---|---|---|---|---|---|
| DI ranking (descending order) | 0.895 | 0.878 | 0.828 | 0.69 | 0.659 | 0.638 | 0.576 | 0.544 |
| Feature correlations (absolute value) | ||||||||
| P2i-Fz | 1.00 | 0.94 | 0.14 | 0.93 | 0.80 | 0.26 | 0.22 | 0.81 |
| P2i -F4 | 1.00 | 0.25 | 0.92 | 0.73 | 0.33 | 0.29 | 0.75 | |
| N1c-F4 | 1.00 | 0.16 | 0.04 | 0.91 | 0.92 | 0.12 | ||
Table 4: DI ranking and correlations of each candidate feature.
▪ Classification and performance
After feature selection, linear discriminate analysis (LDA) with a Fisher core was used to distinguish between normal and schizophrenic subjects. LDA is a well-known tool for pattern recognition that is trained with samples to identify the optimal projective space [41]. LDA projects the data into a lower-dimensional vector space to maximize the distance between groups and minimize the distance within groups.
In clinical applications, auxiliary diagnoses should be accurate and rapid. In this study, the sensitivity (SE), specificity (SP), and overall accuracy (ACC) of the developed method were evaluated and they were defined as follows:
SE=TP/(TP + FN)
SP=TN/(TN + FP)
Accuracy=(TP + TN)/(TP + FN + TN + FP)
where TP is the true positive (i.e., the total number of correctly detected positive events (schizophrenia)); TN is the true negative (i.e., the total number of correctly detected negative events (healthy people)); FP is the number of false positives (i.e., the total number of erroneously positive detections (false alarms)); and FN is the number of false negatives (i.e., the total number of erroneously negative detections (missed detections)). Finally, we designed two experiments to evaluate the feasibility of scaling musical perception by analyzing brain AEPs elicited by musical stimuli with different degrees of complexity.
Verification 1 was used to verify the proposed AEP feature and selection strategy to identify schizophrenic patients. We estimated the accuracy of this method by leave-one-out cross-validation. For a dataset with N subjects, we performed N validations. For each validation, the data from N-1 subjects were for training and the data from the remaining subject were used as the test samples. Moreover, in clinical application, auxiliary diagnosis should be not only accurate and rapid but also stable. That is, for any given subject, the results at different trials should be consistent. Therefore, in verification 2, we divided the data into two parts, with the first and second rounds used as a training set and the third and fourth rounds used as a testing set. Preprocessing was conducted as in verification 1, with the features chosen for verification 1 used for classification (Table 5).
| Features | SE | SP | ACC | |
|---|---|---|---|---|
| Without selection | All of 8 candidates | 75% | 41.8% | 58.3% |
| Feature with the strongest DI | P2i-Fz | 75% | 75% | 75% |
| DI+CBA | P2i-Fz and N1c-F4 |
83.3% | 83.3% | 83.3% |
Table 5: Sensitivity (SE), specificity (SP), and accuracy (ACC) of the proposed methods in verification 1.
Result
The experimental results consist of three parts: (1) ERPs analysis describing the differences between groups and stimulus conditions; (2) statistical analysis (two-sample t-test) and feature selection marking AEP components; and (3) classification in two different verifications. In verification 1, all subjects were subjected to AEP extraction and feature selection for identification of schizophrenic patients. Next, leave-one-out cross validation was used for performance evaluation. In verification 2, the data were divided into two parts. We used the first and second rounds as the training set and the third and fourth rounds as the testing set to verify the consistency of the proposed model. These experiments were designed to support the hypothesis that our auditory stimulus was useful in identification of schizophrenic patients and healthy controls.
▪ AEP analysis
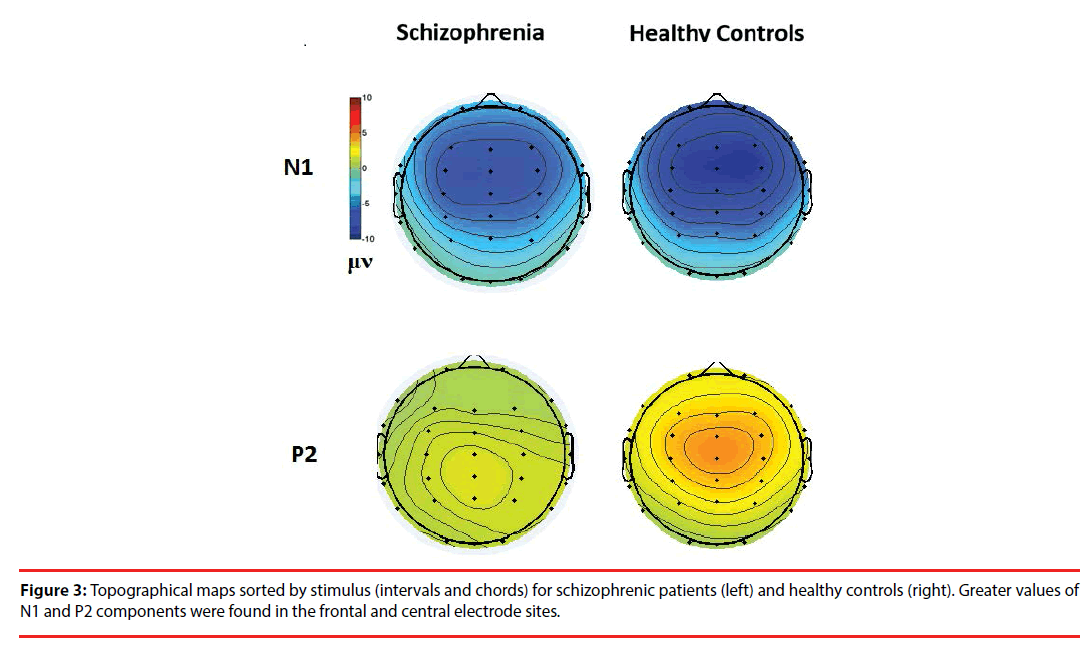
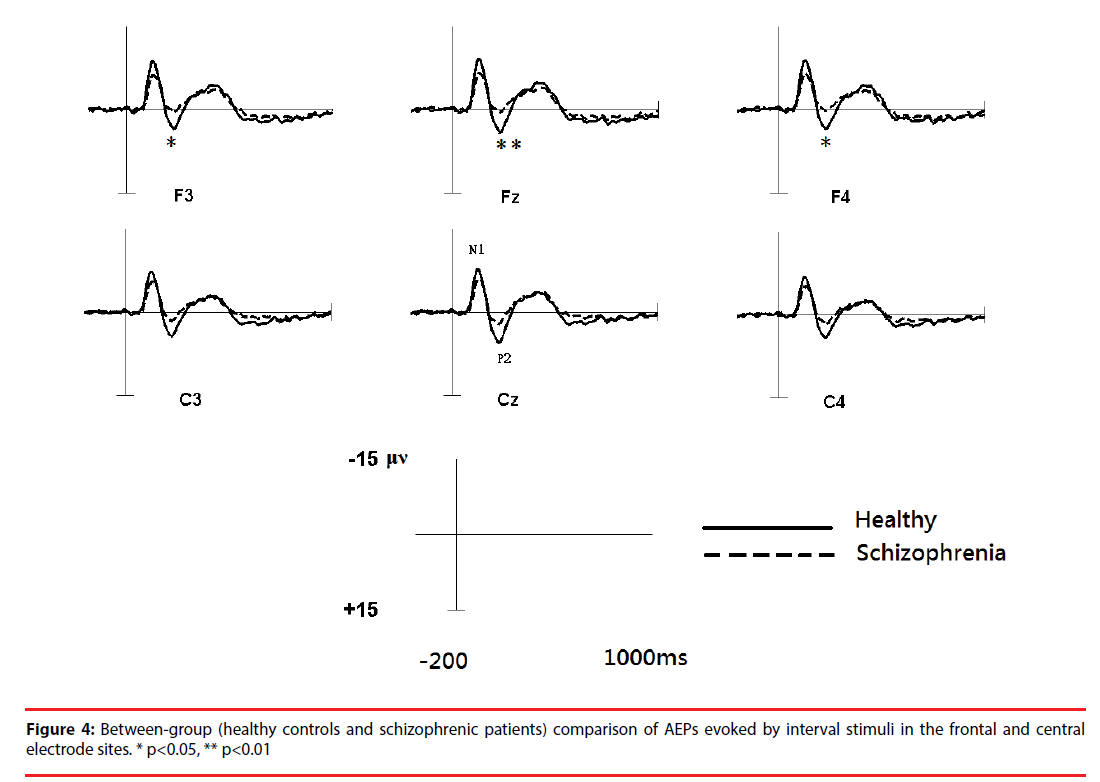
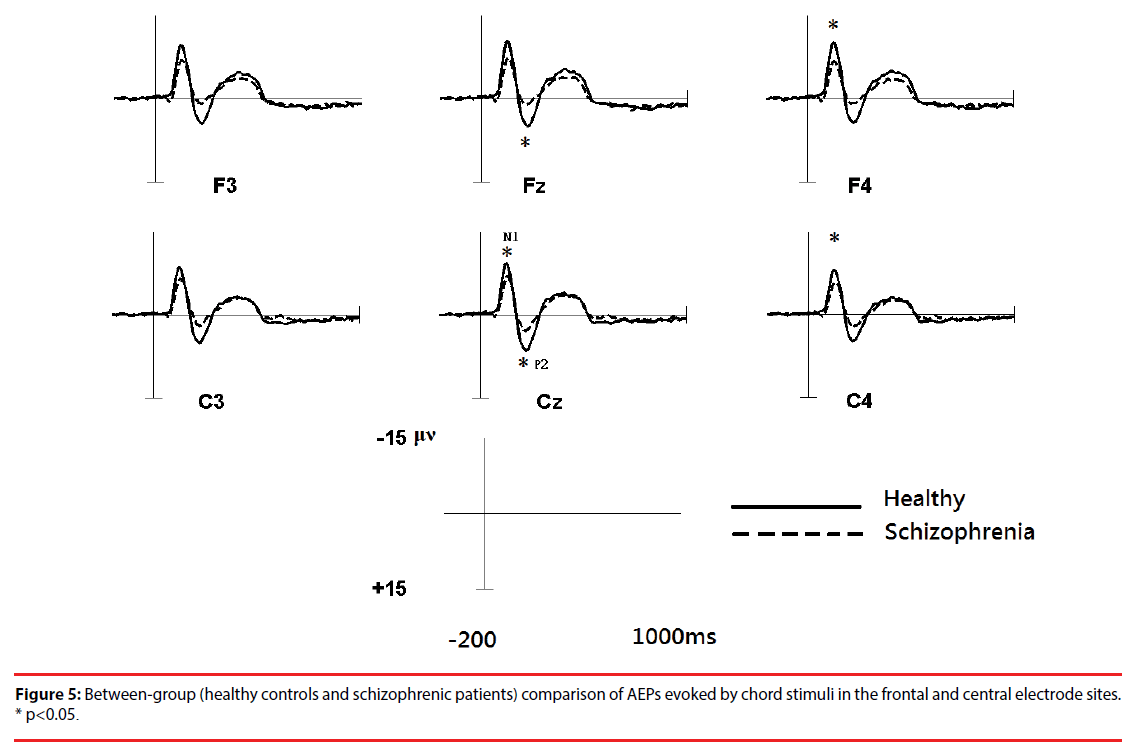
Figure 3 shows the all-channel topographical maps of auditory evoked potentials (AEP) evoked by all stimuli (intervals and chords). The greater N1 (~140 ms) and P2 (~220 ms) components were associated with ROIs (frontal and middle electrode sites.) Therefore, the six frontal-midline electrodes, F3, Fz, F4, C3, Cz and C4, were used to extract the AEP features. Figures 4 and 5 show the waveforms of AEPs evoked by interval and chord stimuli, respectively. The N1 and P2 amplitudes elicited by chord and interval stimuli were reduced in the schizophrenic patients compared to the healthy controls at the selected electrodes.
▪ Statistical analysis and feature selection
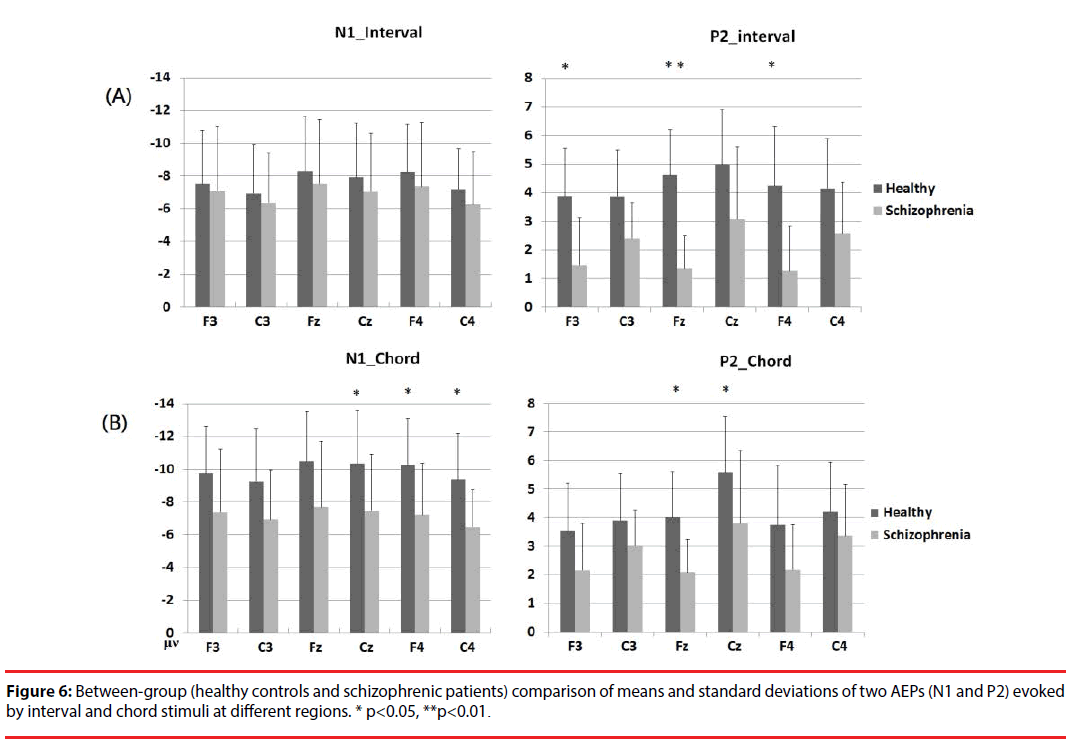
Based on a two-sample t-test, the features showing significant differences (p<0.05) between the subject groups were extracted as candidates for analysis. For each electrode within the ROIs, four AEP components (magnitudes of N1 (N1i) and P2 (P2i) evoked by the interval stimuli and magnitudes of N1 (N1c) and P2 (P2c) evoked by the chord stimuli) from patients with schizophrenia and the healthy controls were analyzed. Figure 5 shows the results of the statistical analysis. In response to intervals (Figure 6A), the healthy controls showed significantly greater (p<0.05) P2 components than the schizophrenic patients at F3, Fz and F4, but these patterns were not found in the N1 magnitudes. In response to chords (Figure 6B), healthy controls showed significantly greater N1 and P2 components than the schizophrenic patients. N1 patterns were found at Cz, F4, and C4; and P2 patterns were found at Cz and Fz. According to these results, we selected 8 significant AEP components as candidate features, including P2i (F3, Fz and F4), N1c (F4 and C4) and P2c (F3, Fz and Cz).
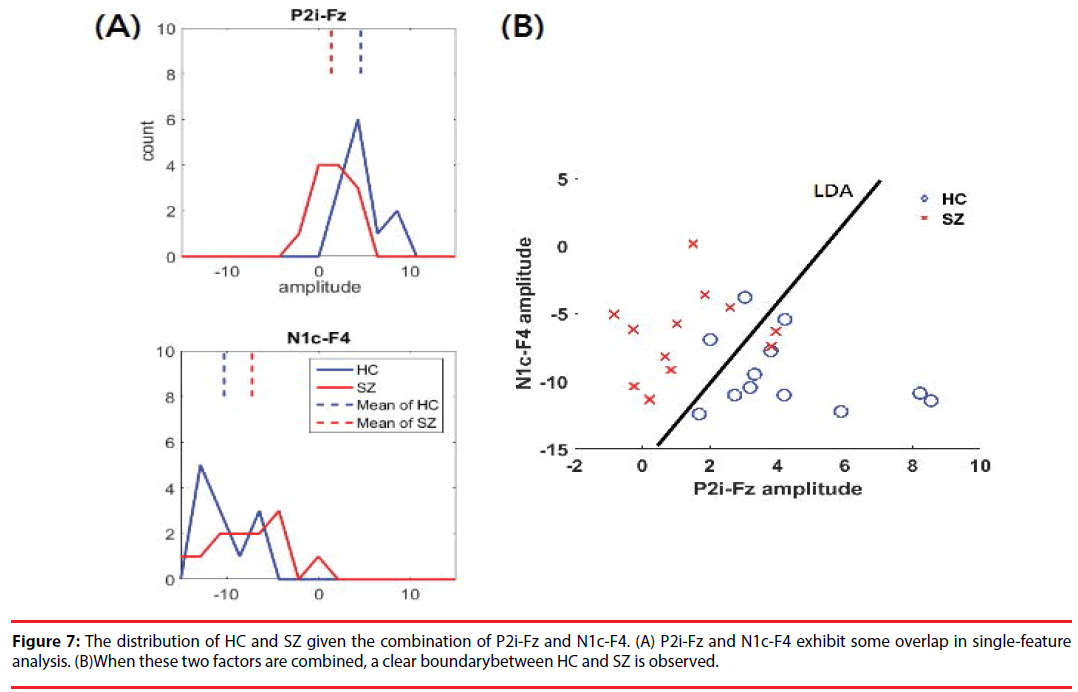
The results of DI and CBA following feature selection are shown in Table 4. P2i-Fz has the largest DI (0.89), marking it as a high-priority feature. Given its complementary to P2i-Fz, N1c-F4 (correlation lower than 0.7) is the second-highest-priority selection. Figure 7 shows the distribution of HC and SZ, given the combination of P2i-Fz and N1c-F4. In singlefactor (P2i-Fz) analysis, SZ and HC exhibit some overlap (Figure 7A). However, after P2i- Fz and N1c-F4 (Figure 7B) are combined, there is a clear difference between HC and the SZ. The detailed evaluation of LDA classification is described in the following section.
▪ Classification performance
In verification 1, after AEP statistical analysis and feature selection procedure, two AEP components (P2i-Fz and N1c-F4) were extracted to construct the classifier. Both features have significant discriminatory power. Table 3 shows the performance of a leave-one-out cross-validation (12 patients with schizophrenia and 12 healthy controls) to evaluate the proposed schizophrenia-classification system. The average accuracy is 83.3%, and the sensitivities for schizophrenia patients and specificity for healthy controls are well balanced (83%). Compared to the DI-only method, including the N1c-F4 feature improves 8% of the accuracy to discriminate from schizophrenic patients and healthy controls.
Further, in verification 2, to verify the stability of our method, the data were divided into two parts. We used the first and second rounds as a training set and the third and fourth rounds as a testing set. As for verification 1, we used P2i-Fz and N1c-F4 as the features for classification. The average accuracy was 76.1%; the sensitivity was 70%; and the specificity was 81.8%. Comparing to verification 1, the trial numbers of the AEP components of each testing subject were reduced by 50% and it affects calculation of the peak amplitudes of the AEP components. However, the average accuracy was still higher than 75%.
Discussion
Currently, the diagnosis of SZ involves individual evaluations of the severity of the characteristic symptoms and coupled with social or occupational dysfunction, for at least six months. Researchers have been increasingly interested in finding objective biomarkers to provide the more objective, accurate and precise means of assessing actual and potential psychiatric conditions. In this study, an approach integrating AEP of musical perception (interval and chord stimuli) and automatic feature selection is proposed to provide the physiological evidence for the auxiliary diagnosis of schizophrenia. The AEP analysis shows that the N1 and P2 amplitudes were significantly lower in the schizophrenic patients than in the healthy controls. Using these features selected by our feature-selection strategy based on measures of overlap and correlation analysis, to construct a linear classifier, the overall accuracy approaches 83.3% by leave-one-out cross-validation of the data from 12 schizophrenic patients and 12 healthy control subjects.
In previous studies, several techniques have been applied for identification of schizophrenia. In terms of psychological signals, early EEG studies evaluated specific bands, including the delta (1-3 Hz), theta (4-7 Hz) and alpha (8-12 Hz) bands, to analyze brain patterns associated with schizophrenia [42]. Recently, ERP studies have used auditory tasks [16] or mix-model tasks [17] to evoke N1/P3 and the amplitudes as well as latencies of these components were used as features. These electroencephalography studies had approximately 75% success in discriminating between schizophrenic patients and healthy controls. Some studies of schizophrenia have used neuroimaging technologies such as sMRI, DTI and fMRI and reported to achieve 80%- 90% accuracy [15,43,44]. Because MRI is an expensive non-invasive technology (about $1500/times) [45] that also involves long development times for data processing and the claustrophobic environment is likely to cause nervousness, all increase the difficulty of uses and make it difficult to develop a convenient tool for auxiliary schizophrenia diagnosis in widely screening of people. The passivelistening experimental design and efficient AEP feature selection yield a comparable degree of accuracy and it is suitable for rapid screening for schizophrenia. Moreover, an increasing number of SZ-diagnosis studies have examined responses to first-episode, early or mild schizophrenia to prevent the development of lesions in the brain [43,46-48]. The subjects included in this study were patients with mild SZ (PANSS score: positives 13.6, negatives 16.1 and general 29.8) and the accuracy of the proposed method can reach 83.6%.
The specific task provides strong cognitive guides by which to find robust features with good performance in schizophrenia research and diagnosis. Comparing with oddball or go/no-go tasks, in which subjects were asked to detect tonal or visual stimuli [17-19,49-51], passive and response-free music listening task [31] would reduce the workload associated with ERP-based diagnosis of mental disorders. Our work has demonstrated that patients with SZ showed reduced amplitudes of N1 and P2 components in both hemispheres in the frontal and frontal-central regions in response to musical stimuli. As an early AEP component, N1 represents the primary stimulus-dependent response, including the sensitivity to basic auditory properties such as pitch [52] and intensity [53] or even attentional factors [54]. The P2 component are closely related to perception [55] and are correlated with aspects of selective attention or stimulus encoding [56]. In terms of musical complexity, as additional notes increase complexity, chords have strong “intensity” and “homophonic” qualities that can be used to elucidate primary stimulus-dependent sensitivity. The difference between schizophrenic patients and healthy people in N1 has been replicated in a large number of previous studies [52,53,57], but the P2 response is relatively little known. The P2 has been reported as evidence of neuroplasticity associated with musical experience [57] and long-term musical training [50]. The reduction of P2 in the schizophrenic patients was observed in our previous study [31]. To our knowledge, this study was the first to integrate N1 and P2 components evoked by the passive and response-free music listening task for identification of schizophrenic patients.
In addition, an efficient and effective feature-selection strategy is still needed to avoid the inclusion of redundant features and over-complication in applications. It is general to employ statistical tests with various factors and then using brute-force approaches to determine the combinations of features and the classifiers with better performance [17-19,49-51]. We further propose a feature-selection strategy integrating the discrimination information (DI) used to rank the degree of distribution overlap and the correlation-based analysis (CBA) used to select complementary features by which to automatically construct the identification system of schizophrenic patients with superior performance. This strategy involves DI ranking of the candidate features, and exclusion of redundant features using CBA. In addition, this proposed feature-selection strategy can be applied to the development of various automatic analysis systems to avoid the time-consuming process of brute-force approaches. Due to the advantages associated with the recording process and feature analysis, the feasibility of objectively distinguishing between patients with schizophrenia and healthy people by analyzing physiological information (AEPs) was demonstrated.
Several limitations of this study should be noted. First, the recruited schizophrenic patients were under treatment with atypical antipsychotic medication. The medication effects remained as inevitable confounding factors. Second, data from small subject number were utilized in the experiments. More subjects should be recruited to evaluate the reliability and clinical applicability of the proposed method. It should also be addressed that the result in this study cannot be used as a simple test of the presence or absence of schizophrenia duo to the multi-factorial nature of psychiatric disorders.
The proposed approach can be used as a tool to help us understand abnormalities of brain function and a potential biomarker to subgroup endophenotypes of in schizophrenia. In addition, because the auditory hallucination related psychopathy shows brain structural abnormity in frontal and temporal regions [58,59], it is expected that the passive-listening experimental design and efficient feature selection integrated with the portable and wearable EEG devices [60,61] will yield an ERP-based assistant system that is suitable for rapid screening of various psychiatric and mental disorders (e.g. depression and bipolar) with auditory dysfunction in the future.
Acknowledgments
The authors would like to thank Prof. Fu-Zen Shaw of the Department of Psychology, National Cheng Kung University, Taiwan, for providing the PSG data required to develop and evaluate our methods. This work was supported in part by project grants from the National Science Council of Taiwan under Grants (NSC 95-2221-E-006 -507 -MY2 and MOST 106-2218-E006 -019) and Chang Gung Memorial Hospital (CMRPG-371771).
References
- OsJ V, Kapur S. Schizophrenia. The. Lancet 374(1), 635-645 (2009).
- Nationl Institute of Mental Health (US).
- A.P. Association, Diagnostic and statistical manual of mental disorders (DSM-5®): American Psychiatric Pub (2013).
- Singh I, Rose N. Biomarkers in psychiatry. Nature 460(1) 202-207 (2009).
- McGorry P, Keshavan M, Goldstone S, et al. Biomarkers and clinical staging in psychiatry. World Psychiatry 13(3), 211-223 (2014).
- Sponheim SR, Clementz BA, Iacono WG, et al. Clinical and biological concomitants of resting state EEG power abnormalities in schizophrenia. Biolo. psychiatry 48(11), 1088-1097 (2000).
- McCarley RW, Shenton ME, O'Donnell BF, et al. Auditory P300 abnormalities and left posterior superior temporal gyrus volume reduction in schizophrenia. Arch. Gen. Psychiatry 50(3), 190-197 (1993).
- Bramon E, Rabe-Hesketh S, Sham P, et al. Meta-analysis of the P300 and P50 waveforms in schizophrenia. Schizophr. Res 70(2-3), 315-329 (2004).
- Shenton ME, Dickey CC, Frumin M, et al. A review of MRI findings in schizophrenia. Schizophr. Res 49(1-2), 1-52 (2001).
- Calhoun VD, Eichele T, Pearlson G, et al. Functional brain networks in schizophrenia: A review. Front. Hum. Neurosci 3, 17 (2009).
- Wible CG, Kubicki M, Yoo SS, et al. A functional magnetic resonance imaging study of auditory mismatch in schizophrenia. Am. J. Psychiatry 158(6), 938-943 (2001).
- Dillon K, Calhoun V, Wang YP. A robust sparse-modeling framework for estimating schizophrenia biomarkers from Fmri. J. Neurosci. Methods 276(1), 46-55 (2017).
- Jardri R, Pouchet A, Pins D, et al. Cortical activations during auditory verbal hallucinations in schizophrenia: a coordinate-based meta-analysis. Am. J. Psychiatry 168(1), 73-81 (2011).
- Kim DI, Mathalon D, Ford J, et al. Auditory oddball deficits in schizophrenia: an independent component analysis of the fMRI multisite function BIRN study. Schizophr. Bull 35(1), 67-81 (2009).
- Kawasaki Y, Suzuki M, Kherif F, et al. Multivariate voxel-based morphometry successfully differentiates schizophrenia patients from healthy controls. Neuroimage 34(1), 235-242 (2007).
- Iyer D, Zouridakis G. Single-trial analysis of the auditory N100 improves separation of normal and schizophrenia subjects, in Engineering in Medicine and Biology Society. Annual. Int. Conf. of the IEEE 2008, 3840-3843 (2008).
- Neuhaus AH, Popescu FC, Bates JA, et al. Single-subject classification of schizophrenia using event-related potentials obtained during auditory and visual oddball paradigms. Eur. Arch. Psychiatry. Clin. Neurosci 263(3), 241-247 (2013).
- Winterer G, Ziller M, Dorn H, et al. Frontal dysfunction in schizophrenia–a new electrophysiological classifier for research and clinical applications. Eur. Arch. Psychiatry. Clin. Neurosci 250(4), 207-214 (2000).
- Neuhaus AH, Popescu FC, Grozea C, et al. Single-subject classification of schizophrenia by event-related potentials during selective attention. Neuroimage 55(2), 514-521 (2011).
- Giannitrapani D, Kayton L. Schizophrenia and EEG spectral analysis. Electroencephalogr. Clin. Neurophysiol 36(4), 377-386 (1974).
- Allen AJ, Griss ME, Folley BS, et al. Endophenotypes in schizophrenia: a selective review. Schizophr Res 109(1-3), 24-37 (2009).
- Salisbury DF, Shenton ME, Sherwood AR, et al. First-episode schizophrenic psychosis differs from first-episode affective psychosis and controls in P300 amplitude over left temporal lobe. Arch. Gen. Psychiatry 55(2), 173-180 (1998).
- Näätänen R, Kähkönen S. Central auditory dysfunction in schizophrenia as revealed by the mismatch negativity (MMN) and its magnetic equivalent MMNm: a review. Int. J. Neuropsychopharmacol 12(1), 125-135 (2009).
- Todd J, Michie PT, Schall U, et al. Mismatch negativity (MMN) reduction in schizophrenia—Impaired prediction-error generation, estimation or salience?. Int. J. Psychophysiol 83(2), 222-231 (2012).
- Boutros NN, Korzyukov O, Jansen B, et al. Sensory gating deficits during the mid-latency phase of information processing in medicated schizophrenia patients. Psychiatry. Res 126(3), 203-215 (2004).
- Boutros NN, Brockhaus-Dumke A, Gjini K, et al. Sensory-gating deficit of the N100 mid-latency auditory evoked potential in medicated schizophrenia patients. Schizophr. Res 113(2-3), 339-346 (2009).
- Rosburg T, Boutros NN, Ford JM. Reduced auditory evoked potential component N100 in schizophrenia—a critical review. Psychiatry. Res 161(3), 259-274 (2008).
- Salisbury DF, Collins K, McCarley RW. Reductions in the N1 and P2 Auditory Event-Related Potentials in First-Hospitalized and Chronic Schizophrenia. Schizophr. Bull 36(5), 991-1000 (2010).
- Boutros N, Nasrallah H, Leighty R, et al. Auditory evoked potentials, clinical vs. research applications. Psychiatry. Res 69(2), 183-195 (1997).
- Jafri MJ, Calhoun VD. Functional classification of schizophrenia using feed forward neural networks. In. Conf. Proc. IEEE. Eng. Med. Biol. Soc 6631-6634, (2006).
- Wu KY, Chao CW, Hung CI, et al. Liang, Functional abnormalities in the cortical processing of sound complexity and musical consonance in schizophrenia: evidence from an evoked potential study. BMC. Psychiatry 13(1), 158 (2013).
- Kay SR, Flszbein A, Opfer LA. The positive and negative syndrome scale (PANSS) for schizophrenia. Schizophrenia. bulletin 13(1) 261 (1987).
- Malmivuo J, Plonsey R. Bioelectromagnetism: principles and applications of bioelectric and biomagnetic fields: Oxford University Press (1995).
- Delorme A, Makeig S. EEGLAB: an open source toolbox for analysis of single-trial EEG dynamics including independent component analysis. J. neuroscience. meth 134(1) 9-21 (2004).
- Kullback S, Leibler RA. On information and sufficiency. Annals. Mathe. Stat 22(1) 79-86 (1951).
- Kullback S. Information theory and statistics: Courier Corporation (1997).
- Rokach L, Maimon O. Data mining with decision trees: theory and applications: World scientific (2014).
- Abdar M, Kalhori SRN, Sutikno T, et al. Comparing Performance of Data Mining Algorithms in Prediction Heart Diseases. Int. J. Elect. Comp. Engg 5(1), 1569-1576 (2015).
- Uğuz H. A two-stage feature selection method for text categorization by using information gain, principal component analysis and genetic algorithm. Knowledge-Based. Sys 24(1), 1024-1032 (2011).
- Hall MA, Smith LA. Feature subset selection: a correlation based filter approach," in International Conference on Neural Information Processing and Intelligent Information Systems. 855-858 (1997).
- Liang SF, Kuo CE, Hu YH, et al. Automatic stage scoring of single-channel sleep EEG by using multiscale entropy and autoregressive models. IEEE. Trans. Instrum. Meas 61(2), 1649-1657 (2012).
- Boutros NN, Arfken C, Galderisi S, et al. The status of spectral EEG abnormality as a diagnostic test for schizophrenia. Schizophrenia. Res 99(1-3), 225-237 (2008).
- Takayanagi Y, Takahashi T, Orikabe L, et al. Classification of first-episode schizophrenia patients and healthy subjects by automated MRI measures of regional brain volume and cortical thickness. PLoS One 6(6), e21047 (2011).
- Pardo PJ, Georgopoulos AP, Kenny JT, et al. Classification of adolescent psychotic disorders using linear discriminant analysis. Schizophrenia. Res 87(2-3) 297-306 (2006).
- McLoughlin G, Makeig S, Tsuang MT. In search of biomarkers in psychiatry: EEG‐based measures of brain function. Neuropsychiatr. Genet 165(1), 111-121 (2014).
- Zanetti MV, Schaufelberger MS, Doshi J, et al. Neuroanatomical pattern classification in a population-based sample of first-episode schizophrenia. Prog. Neuropsychopharmacol. Biol. Psychiatry 43(1) 116-125 (2013).
- Schwarz D, Kasparek T. Brain morphometry of MR images for automated classification of first-episode schizophrenia. Info. Fusion 19(1), 97-102 (2014).
- Yang H, Liu J, Sui J, et al. A hybrid machine learning method for fusing fMRI and genetic data: combining both improves classification of schizophrenia. Front. Hum. Neurosci 4(1), 192 (2010).
- Kim JW, Lee YS, Han DH, et al. Diagnostic utility of quantitative EEG in un-medicated schizophrenia. Neurosci. lett 589(1), 126-131 (2015).
- Chun J, Karam Z, Marzinzik F, et al. Can P300 distinguish among schizophrenia, schizoaffective and bipolar I disorders? An ERP study of response inhibition. Schizophrenia. Res 151(1), 175-184 (2013).
- Neuhaus AH, Popescu FC, Rentzsch J, et al. Critical evaluation of auditory event-related potential deficits in schizophrenia: evidence from large-scale single-subject pattern classification. Schizophrenia. bull 40(1), 1062-1071 (2014).
- Cutnell JD, Johnson KW Physics: John Wiley and Sons (2009).
- Neukirch M, Hegerl U, Kötitz R, et al.Comparison of the amplitude/intensity function of the auditory evoked N1m and N1 components. Neuropsychobiology 45(1),41-48 (2001).
- Hillyard SA, Hink RF, SchwentvVL, et al. Electrical signs of selective attention in the human brain. 182(1), 177-180 (1973).
- Javitt D.C, Shelley AM, Silipo G, et al. Deficits in auditory and visual context-dependent processing in schizophrenia: defining the pattern. Arch Gen Psychiatry 57(12), 1131-1137 (2000).
- Crowley KE, Colrain IM. A review of the evidence for P2 being an independent component process: age, sleep and modality.Clinical neurophysiology 115(4), 732-744 (2004).
- Shahin A, Bosnyak DJ, Trainor LJ, et al. Enhancement of neuroplastic P2 and N1c auditory evoked potentials in musicians. J. Neurosci 23(13), 5545-5552 (2003).
- Mathew I, Gardin TM, Tandon N, et al. Medial temporal lobe structures and hippocampal subfields in psychotic disorders: findings from the Bipolar-Schizophrenia Network on Intermediate Phenotypes (B-SNIP) study. JAMA Psychiatry 71(7), 769-777 (2014).
- Padmanabhan JL, Tandon N, Haller CS, et al. Correlations between brain structure and symptom dimensions of psychosis in schizophrenia, schizoaffective, and psychotic bipolar i disorders. Schizophr Bull 41(1), 154-162 (2015).
- Chang DW, Liang SF, Young CP, et al. A Versatile Wireless Portable Monitoring System for Brain–Behavior Approaches. IEEE Journal on Emerging and Selected Topics in Circuits and Systems 1(4), 440-450 (2011).
- King RC, Villeneuve E, White RJ, et al. Application of data fusion techniques and technologies for wearable health monitoring. Med. Eng. Phys 42(1), 1-12 (2017).
