Special Report - Imaging in Medicine (2010) Volume 2, Issue 2
Imaging of short and ultrashort T2 and T2 * tissues using clinical MRI systems
Graeme M Bydder*Department of Radiology, University of California, San Diego, 200 West Arbor Drive, San Diego, CA 92103–8226, USA
- Corresponding Author:
- Graeme M Bydder
Department of Radiology
University of California, San Diego
200 West Arbor Drive, San Diego
CA 92103–8226, USA
Tel: +1 619 471 0506
Fax: +1 619 471 0503
E-mail: gbydder@ucsd.edu
Abstract
There are now a variety of new techniques available to detect signal from tissues with short or ultrashort T2s and T2*s. There are also many methods of developing image contrast between tissues and fluids in the short T2 or T2* range, which can provide visualization of anatomy that has not previously been seen. Particular methods have been developed to target susceptibility effects, and allow accurate quantitation by compensating for the anatomical distortion produced by these effects. Specific methods have been developed to image the effects of magnetic iron oxide particles with positive contrast and to correct for the loss of signal and image distortion near to metal caused by gross susceptibility effects. These methods are likely to provide interesting options and increase the range of applications of MRI.
Keywords
short T2 tissue components ▪ susceptibility ▪ ultrashort echo time
During the first year of clinical MRI, only steady state free precession, T1-weighted and proton density-weighted clinical images were available [1–3]. Heavily T2-weighted spin echo (SE) sequences arrived suddenly in early 1982 and transformed the practice of magnetic resonance (MR) [4–6]. Images obtained with these sequences detected intermediate or long T2 relaxation components in tissue. Even with the subsequent development of new classes of sequences, such as fast SE, clinical diffusion-weighted imaging and fluid attenuated inversion recovery, the detection of signal from intermediate and long T2 relaxation components remains the dominant form of MRI for the diagnosis of parenchymal disease in the brain and much of the rest of the body.
However, even when clinical MRI began, very short mean T2 relaxation components were recognized in the cortical bone by Smith et al. [7] and Edelstein et al. [8]. This tissue showed no MR signal. The lack of signal was useful in providing a low-signal background against which abnormalities in cortical bone with sufficiently long mean T2s to result in detectable signal could be recognized, but the absence of signal from normal cortical bone meant that there was no possibility of measuring normal values of mobile proton density (ρm), T1 or T2. Nor was it possible to study normal perfusion, and there was no opportunity for active contrast manipulation, little or no distinction between adjacent short T2 tissues and no means of visualizing normal contrast enhancement. As a result, the study of cortical bone and other MR ‘invisible’ short T2 tissues, such as tendons, ligaments and menisci, has been far more limited than that of tissues and organs, such as brain, liver and muscle, where tissue mean T2s are longer and MR signal from them is readily detectable with conventional clinical sequences. However, even these longer T2 tissues contain significant proportions (e.g., 5–30%) of invisible or undetectable short T2 relaxation components when they are imaged with conventional approaches.
To image short or ultrashort T2 tissues that produce no detectable signal with conventional sequences, indirect methods have been used in which signal is obtained from surrounding or associated longer T2 tissues. When the low- or zero-signal tissue is surrounded by longer T2 tissue, signal from this tissue can be used to define the boundaries of the zero-signal tissue. It is also possible to characterize some short T2 tissues by observing the impact that their difference in susceptibility from that of the surrounding longer T2 tissues has on the signal obtained from the longer T2 tissue. For example, some features of trabecular bone can be inferred by the effect this tissue has on the MR signal of adjacent red or yellow bone marrow [9]. A third indirect method is possible when short and long T2 relaxation components are associated, and undergo magnetization exchange. The effect of saturation of the invisible short T2 components on this exchange can be observed on the detectable longer T2 components [10] and, thus, inferences can be made regarding the short T2 tissue and/or the exchange between the shorter and longer T2 components.
An alternative to using conventional sequences to study short T2 tissues in this way is to employ methods that directly detect signal from them. These usually involve the use of short echo time (TE) or ultrashort TE (UTE) sequences to detect MR signals before they have decayed to zero. There are now a variety of sequences of this type available in the clinical domain.
While T2 is a property of tissue that reflects dipolar and other nuclear interactions, frequently the effects seen with MRI are described more accurately by the observed T2 or T2*. This includes effects such as intravoxel dephasing due to B0 field inhomogeneity, tissue susceptibility differences and chemical shift. Tissue susceptibility effects reflect the fact that solid tissues, such as bone, are generally more diamagnetic than soft tissues, and that some tissues and fluids may be paramagnetic. The effects of some of these differences can be partly or almost wholly reversed by the use of SE sequences.
In some situations, T2* effects may dominate and it is useful to recognize several different approaches to imaging short T2/T2* components in relation to underlying susceptibility differences:
▪ The first approach essentially sees the problem as imaging of short or ultrashort T2 components and the basic approach is to use a short TE or UTE to acquire and encode MR signals before they decay to a low level. This may be appropriate in situations where there are only minor susceptibility differences present.
▪ The second is susceptibility-weighted imaging, where magnitude and phase data are used to recognize a loss of signal from tissue caused by susceptibility effects. It can be direct and/or indirect (where T2* become too short to detect) and is qualitative.
▪ Quantitative susceptibility imaging is the third approach. This technique recognizes the fact that susceptibility differences affect the spatial encoding of MR signals and endeavors to correct this and to calculate values of T2* that accurately reflect T2 and susceptibility effects.
▪ Positive-contrast and white-marker imaging techniques address the specific problem of imaging the effects of magnetic iron oxide particles (MIOPs), which shorten T2 and produce local disturbances of the magnetic field. The aim is to detect the presence of particles with a positive signal and at least, in part, address the problem of field distortion to achieve credible recognition and quantification of the concentration of MIOPs.
▪ The fifth group of techniques is targeted at imaging in the presence of metal. Metals can produce very large susceptibility effects with loss of signal due to T2* effects and gross image distortion. The primary objective in this situation is to deal with the image distortion and restore image integrity to a sufficient degree for the images to be clinically useful.
There is some overlap between these approaches. In some situations it may be appropriate to ignore the effects of susceptibility differences in producing image distortion and regard the problem as one of detecting short T2 signals, whereas in other situations image distortion due to susceptibility is the primary problem that needs to be addressed. Over the previous year, there has been considerable interest in these approaches with solutions now appearing to some problems that were previously intractable for many years.
Tissue properties
The tissues of the human body can be divided into those that are visible, in the sense that they provide detectable signal with clinical MR systems, and those that are ‘invisible’ because their mean T2s or T2*s are too short to provide a detectable signal. All tissues have multicomponent T2s. This means that they contain a mixture of short and long T2 components. The invisible tissues have a majority of short T2 components and a minority of long T2 components. The latter components typically do not provide enough signal to be detectable in comparison to image noise levels. The invisible tissues of the body, such as the brain, liver and muscle, have a majority of long T2 components, which produce the signals seen with conventional techniques. They also have a minority of short T2 components that do not contribute significantly to the detectable signal.
There is no agreement as to what constitutes a short TE and what is an UTE, and there is an argument regarding how TE should be measured for tissues with short T2s [11], but for simplicity, a short TE is taken to be less than 10 ms and a UTE less than 1 ms. It is also possible to define short T2/T2* as less than 10 ms and ultrashort as less than 1 ms. This reflects the fact that with older systems and SE sequences, tissues with a T2 or T2* less than 10 ms produced little or no signal and were invisible. With more recent systems and gradient-echo sequences the cut-off is closer to 1 ms.
Within the invisible group of tissues (mean T2 < 10 ms) it is possible to differentiate a first group, including tendons, ligaments and menisci, with short mean T2s of approximately 1–10 ms, a second group, including cortical bone and dentine, with ultrashort mean T2s of 0.1–1 ms. There is also a third group, including dental enamel, protons in membranes, large molecules and crystalline bone, with a mean T2s of less than 0.1 ms.
An important factor in this context is the magic-angle effect [12,13] since it can greatly increase the T2 of short T2 tissues, such as tendons, ligaments and menisci. When the orientation of tissues that contain highly ordered collagen is changed, their T2 varies from a minimum at θ = 0°, where dipolar interactions are greatest, to a maximum where 3cos2θ – 1 ≈ 0 and θ = 55°. q is the orientation of the fibers to B0. The increase can be large, for example, from 0.6 to 21 ms [12] or from 7 to 23 ms [13] in the Achilles tendon.
A recently described phenomenon is directional susceptibility in tendons, whereby their bulk magnetic susceptibility varies with orientation to B0, with signals at the water end of the proton spectrum when fibers are parallel to B0 and at the fat end of the spectrum (lower frequency) when fibers are perpendicular to B0 [14]. The difference is relatively large (of the order of three parts per million [ppm]).
The ρm of tissues also varies markedly, with bone having a ρm of 15–20% and semi-solid tissues, such as tendons and ligaments, having values of 60–70%. ρm is generally a more important factor in generating contrast with short T2 tissues than it is with longer T2 tissues. The low ρm for bone places a limit on the maximum signal that can be obtained from it.
The mean T1s of some tissues with a majority of short T2 components are short, with cortical bone having a particularly short T1, in fact, less than that of fat [15]. The relative differences in mean T2 or T2* between normal and abnormal tissue are generally much greater than those in mean T1.
Relative to air, soft tissues generally show a susceptibility difference of approximately -9 ppm, and bone and calcified tissue of approximately -11 ppm. By comparison, the principal peak of fat resonates at approximately -12 ppm. Paramagnetic materials may show small positive chemical shifts and superparamagnetic materials show greater positive shifts again. Metals including, for example, titanium and some types of stainless steel, may show large positive shifts of 10–100s ppm (or more). These changes in field may be considerably greater than those used by applied machine gradients to encode MR signals and may therefore cause image distortions.
Acquisition methods for short T2/T2* components of tissue
Some of the techniques currently being used to detect signal directly from tissues on clinical systems have been used in material science and tissue studies using small-bore high-field spectrometers for many years. Methods now in use on clinical systems are summarized in Table 1. The prototype sequence for imaging short T2 tissues is single-point imaging where a single point in k-space is acquired with an UTE. This is typically used with 3D phase encoding, which unfortunately makes the technique very time consuming [16].
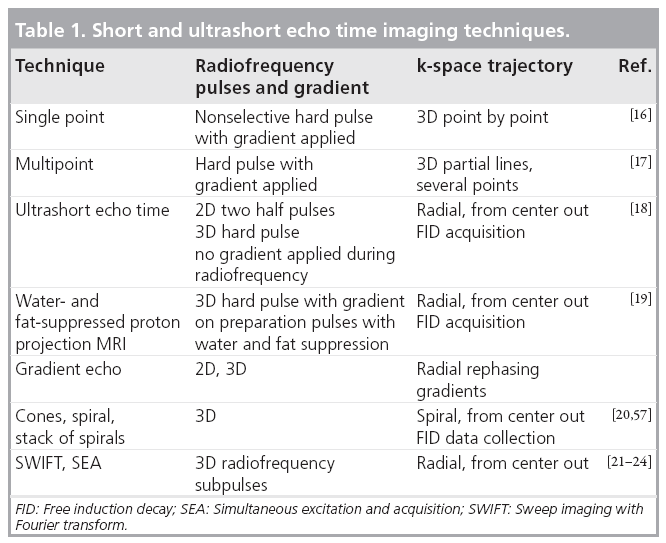
It is possible to acquire several points at a time, which makes the sequences more time efficient but results in longer TEs for the additional points [17]. There are also free induction decaybased techniques where a radial line of k-space is acquired from the center out [18]. This can be coupled with long T2 water- and fat-suppression to selectively image short T2 components [19]. Other trajectories in k-space are possible, including a stack of spirals [20].
A particularly innovative method of imaging short T2 components is to divide the excitation pulse into subpulses and acquire data after each of these pulses. The acquired data need to be deconvolved with the excitation pulse, but the end result is a much more time efficient acquisition than with typical 3D acquisitions [21–24]. Other techniques that have only been used in the preclinical phase include methods in which radiofrequency absorption, rather than signal detection, is assessed [25]. The methods borrow from older forms of spectroscopy and electron spin resonance, where electronic T2s are extremely short and may be of the order of a microsecond.
Magnetization preparation, contrast mechanisms & signal-suppression techniques
Traditional contrast mechanisms exploiting differences in ρm, chemical shift and other tissue properties can be used in ways that are well known from conventional imaging.
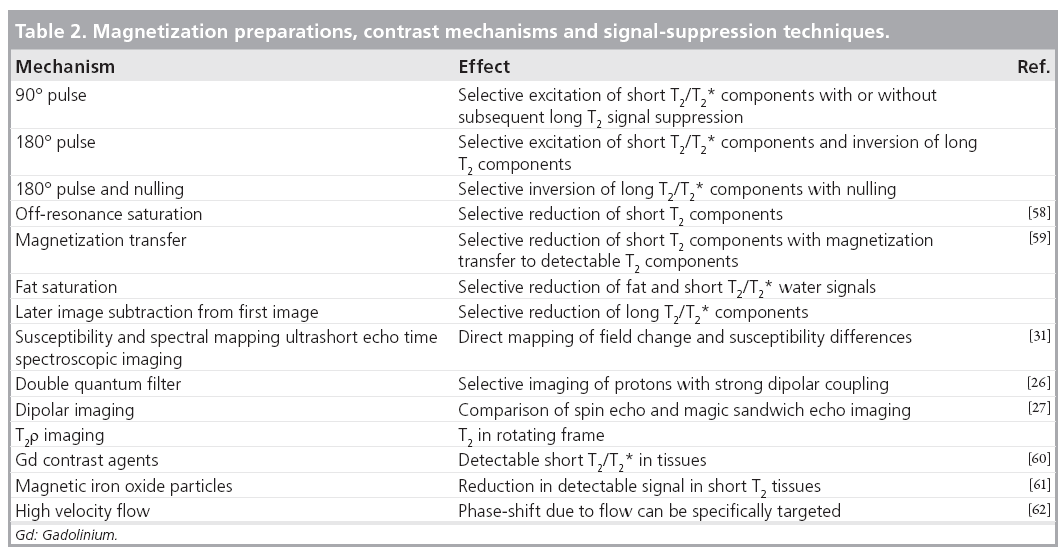
There are also numerous new contrast mechanisms, or old contrast mechanisms operating in new ways, that are of interest in imaging short/ultrashort T2/T2* components in tissue. Some of these are listed in Table 2. They are typically used in conjunction with the acquisition techniques detailed in the previous section. These provide a wide range of possible ways of effecting magnetization. For example, 90 and 180°, fat saturation and magnetization transfer pulses can all be used to suppress unwanted long T2 signals and to produce T2 contrast in the short T2 range. There are also relatively new potential mechanisms involving double quantum filters [26] and a reduction in dipolar coupling [27,28]. These techniques are usually applied in conjunction with one of the acquisition methods described in the previous section.
Susceptibility-weighted imaging
Susceptibility-weighted imaging has been in use for a considerable time. It usually exploits reductions in T2* to develop contrast, and imaging may utilize both magnitude and phase data [29,30]. The T2* may be so short that this, in effect, becomes an indirect form of imaging utilizing the reduction in signal of adjacent longer T2 components. The applicability of the technique and related methods can be expanded by utilizing forms of data collection with TEs or UTEs that can detect signal from very short T2* components [31].
Quantitative susceptibility imaging
Quantitative methods of imaging susceptibility changes need to account for errors in spatial encoding, which may require solutions to a complex inverse problem [32,33]. To date, it has mainly been applied to brain imaging.
Positive-contrast & white-marker imaging
These forms of imaging have been used to describe the particular situation with MIOPs that may not only reduce T2 and T2*, but also produce local field distortions. A variety of different methods are available. It is possible to selectively excite only off-resonance spins. It is also possible to apply an additional gradient so that only the magnetization of spins in regions affected by MIOPs are refocused. The inhomogeneities from the particles induce echo shifts and these can be used to calculate and correct for the field distortion. The images reflect both tissue MIOP concentration and deviations of the local magnetic field produced by the particles [34–38].
Imaging in the presence of metal
When forms of metal are implanted in the body an extreme situation may arise in which there is very marked T2* shortening, but the image distortion is so great that images of regions adjacent to the metal are uninterpretable. This has been a longstanding problem. In the past, a variety of solutions have been proposed, but these have had relatively little clinical impact. The recent development of multiacquisition variableresonance image combination (MAVRIC) [39] and slice encoding for metal artifact correction (SEMAC) [40] has resulted in a remarkable degree of restoration of images that are grossly degraded by a metallic artifact when imaged using conventional approaches. With MAVRIC, irradiation at a range of different off-resonance frequencies is used to detect signals whose resonant frequency has been shifted by metal. With SEMAC, phase encoding is used during slice selection to reallocate signals that are improperly located by the slice selection process. View angle tilting is also used with this technique to correct for errors with in-plane spatial encoding [41].
Imaging of boundaries involving short T2/T2* tissues
Structures of interest in the short T2 range include thin layers such as those in entheses, periosteum and the deep layers of articular cartilage where there are short T2 tissues, susceptibility effects between the soft (or semi-solid) tissues and bone, as well as partial volume effects between these tissues over curved surfaces. In this situation, high-resolution 3D-isotropic UTE imaging often has a distinct advantage since it can detect short T2/T2* signals as well as reduce the impact of susceptibility differences and partial volume effects. Imaging of ordered fibrous structures, such as tendons and ligaments, include some of the previously discussed issues but, in addition, a loss of contrast of the fiber structure or a blurred appearance may arise from obliquity of the fibers relative to the imaging slice. This Filler effect may simulate changes due to disease. There are also distinctive artifacts at boundaries from chemical shift effects, including those associated with radial acquisitions.
Clinical applications
There are now 2D and 3D UTE sequences available with imaging times of 5–6 min and clinically acceptable spatial resolution. In general the difficulty of acquiring short/ultrashort T2/T2* signals means that invisible tissues are imaged at lower spatial resolutions, but with signal levels and contrast that are not attainable with conventional techniques. A balance is necessary to obtain novel qualitative and/or quantitative information at spatial resolutions that show anatomical features with acceptable clarity.
Cortical bone
Cortical bone can be imaged with high signal [15]. The T2 is approximately 0.4 ms and T1 250–350 ms at 1.5 T, which is shorter than typical values for fat. The mobile proton density is approximately 15–20%. These data can be used both for quantitative [42] and qualitative studies (Figure 1).

Figure 1: Ultrashort echo time MRI of the skull. The inner and outer tables of the skull are seen in a manner similar to x-ray CT with bone windows.
Tendons, ligaments & entheses
In conventional sequences, the signal from tendons, ligaments and entheses is very low or zero. Entheses are the attachment sites of tendons, ligaments and capsules to bone. They typically contain calcified and uncalcified fibrocartilage (which both have short T2s). These tissues have a major role in dispersing mechanical stress at the junction between flexible tendons or ligaments and rigid bone.
Tendons and ligaments contain endotenon and endoligament, which have longer T2s than the fibrous components (although they are still in the short T2 range) and less magic-angle effect. Uncalcified fibrocartilage has a longer T2 than the tensile components of tendons as well as an increase in T2 caused by the magic-angle effect, but this may be present over a wider range of angles reflecting the more dispersed arrangement of the fibers within it. Magic-angle effects may result in a longer T2 adjacent to bone from fibers that change in direction, from parallel to the bone surface to perpendicular to it, as they insert into bone. Tendons and ligaments can readily be seen with UTE sequences and entheses have been studied in detail [43,44]. Offresonance fat-suppression pulses reduce the signal from short T2 fibers (which have a broad line width) more than endotenon or enthesis fibrocartilage (which have longer T2s and narrower line widths) and this can be an effective contrast mechanism. Inversion pulses may be used to selectively invert and null enthesis fibrocartilage (exploiting its longer T2), and so, visualize this tissue with high contrast. It is also possible to visualize oblique and transverse fibers in tendons using a combination of fatsuppressed UTE sequences to reduce short T2 tissue water components and magic-angle imaging to lengthen the T2 of the fibers at particular angles to B0 (Figure 2).

Figure 2: Ultrashort echo time image of the Achilles tendon. Abnormal oblique fibers are seen within the tendon (arrows).
Entheses are selectively involved in the seronegative spondyloarthropathies, such as ankylosing spondylitis and psoriatic arthropathy. The differential diagnosis is of a loss or reduction in fascicular pattern and includes normal sesamoid fibrocartilage, partial volume effects with a loss of fascicular pattern due to the Filler effect, magic-angle effects and disease.
Meniscii of the knee
The central region of the adult meniscus has no blood supply (the white zone) while the more peripheral region (the red zone) has a blood supply. Healing of tears in the white zone is generally unsatisfactory and the preferred surgical strategy is usually resection of the torn tissue. Suture and repair is more successful in the red zone. Distinction between the two zones has not previously been possible with MRI using conventional sequences, despite repeated attempts [45]. However, using UTE sequence and gadolinium-based contrast enhancement, the two zones can be distinguished [46] and provide a basis for surgical planning.
Anatomical descriptions of the meniscus include circumferential, radial, lamella, vertical and meshwork fiber groups. With conventional imaging, some radial fibers may be distinguishable from the majority of circumferential fibers, but with UTE and magic-angle imaging each of these fiber groups can be identified (Figure 3). It is also possible to distinguish the internal structure of the meniscus from that of the root ligaments, and the more central cartilaginous region from the more fibrous peripheral region of the meniscus.

Figure 3: Short echo time image of the meniscus. The lamellar layer, radial and vertical fibers are seen. Circumferential fibers are of low intensity.
The fiber structure provides a basis for understanding the biomechanics of the knee and the various patterns of tear in the meniscus. It also helps in distinguishing magic-angle effects within fiber groups from degenerative changes.
Temporomandibular joint disc
This demonstrated some of the characteristics of the meniscus of the knee. Fiber structure can be seen. Lamella, circumferential antero–posterior and superior–inferior fibers are identifiable.
Articular cartilage
Articular cartilage has a range of T2s from approximately 1 to 30–40 ms from deep to superficial. With conventional imaging, the deep radial and calcified layers as well as the adjacent subchondrial bone are invisible. With UTE imaging, signal is detectable from the deeper layers of cartilage, allowing more superficial cartilage and subchondral bone to be distinguished [47]. This provides a basis for study of the junction between cartilage and bone, which may be of importance in the pathogenesis of osteoarthritis. Complex magic-angle effects are seen, owing to the fibrous architecture of articular cartilage.
In disease there may be both a loss of signal from the deep layer and an increased extent of the short T2 associated with deep layers. There is electron microscope evidence of thinning of the deep layers in osteoarthritis but preservation in osteomalacia.
Spine
Imaging of the spine includes many visible tissues, therefore, to date, attention has focused on invisible structures such as entheses, the end plate of the disc, and short T2 components in the intervertebral discs and red bone marrow. Fibrocartilage has also been demonstrated in the functional entheses of the transverse ligament of the atlas and the alar ligament. The dorsal capsule of the facet joints of the lumbar spine are also subject to cartilaginous metaplasia. Evidence of iron deposition can be seen in intervertebral discs in thalassemia [48].
Brain
There are significant short T2 components in many tissues of the body with longer mean T2s, including the brain, liver and muscle. These components can be specifically detected using UTE and other acquisition methods coupled with techniques that suppress long T2 signals [49,50].
Liver
The liver contains a relatively high proportion of short T2 components. The T2*s of these may be prolonged in fibrosis [51]. The fibrosis in this situation is often of a relatively open structure and includes free water.
Pelvis
Ultrashort echo time sequences have been applied to study the effects of cryosurgery in carcinoma of the prostate [52]. Freezing of tissues results in a substantial reduction in T2*.
Quantitative approaches
Quantitation may include specific MR properties, including, in particular, T2 and T2* [53,54], the properties of the remaining signal after long T2 components are suppressed and the ratio of short T2 to long T2 components. There are also other features, such as the magic-angle effect and dipolar contrast, which can be characterized.
There are issues with measuring T2 and T2* in the correct range, characterizing different T2 components (e.g., long and short) including their relative proportions and dealing with artifacts from various sources. Quantitation may be confounded by slice selection and eddy current problems, and by contamination of short T2 components with long T2 components that are present in higher concentration.
Future perspective
Imaging of short T2 and T2* components is a rapidly expanding area that has seen a convergence of methods targeted at tissues with short T2 components, susceptibility effects, MIOP imaging and metal artifact control. The methods have improved on solid state imaging, spectroscopy (including continuous-wave methods), electron spin resonance and MR microscopy. The much lower technical performance of clinical systems compared with small-bore spectrometers is a major limitation, but innovative methods for overcoming this problem are now being developed.
The tissues of interest have mainly been in the musculoskeletal system but all tissues of the body have some short T2 components and study of these may prove to be of diagnostic interest. Some techniques, such as imaging in the presence of metal, are likely to be useful in the clinical domain immediately, while others may require validation and comparative assessment to establish their role. Sodium and phosphorous studies may also be of interest [55,56]. Quantitative approaches may be particularly useful given the large fractional changes in T2 and T2* that are frequently seen in disease. The techniques used for imaging often require high gradient performance with control of short-term eddy currents to a level not previously necessary in clinical MR systems. Despite these and other technical difficulties, application to the study of short T2 and T2* tissues appears likely to be an area of MRI of considerable importance in the near future.
Financial & competing interests disclosure
The author has received support from General Electric Healthcare. The author has no other relevant affiliations or financial involvement with any organization or entity with a financial interest in or financial conflict with the subject matter or materials discussed in the manuscript apart from those disclosed.
No writing assistance was utilized in the production of this manuscript.
References
- Hawkes RC, Holland GN, Moore WS, Worthington BS: Nuclear magnetic resonance (NMR) tomography of the brain: a preliminary clinical assessment with demonstration of pathology. J. Comput. Assist. Tomogr. 4, 577–586 (1980).
- Smith FW, Mallard JR, Hutchison JM et al.: Clinical application of nuclear magnetic resonance. Lancet 1(8211), 78–79 (1981).
- Young IR, Hall AS, Pallis CA, Legg NJ, Bydder GM, Steiner RE: Nuclear magnetic resonance imaging of the brain in multiple sclerosis. Lancet 2(8255) 1063–1066 (1981).
- Bailes DR, Young IR, Thomas DJ, Straughan K, Bydder GM, Steiner RE: NMR imaging of the brain using spin-echo sequences. Clin. Radiol. 33(4), 395–414 (1932).
- Bydder GM, Steiner RE, Young IR et al.: Clinical NMR imaging of the brain: 140 cases. AJR Am. J. Roentgenol. 139(2), 215–236 (1982).
- Crooks LE, Mills CM, Davis PL et al.: Visualization of cerebral and vascular abnormalities by NMR imaging. The effects of imaging parameters on contrast. Radiology 144(4), 843–852 (1982).
- Smith FW: Clinical application of NMR tomographic imaging. In: NMR Imaging. Witcofski RL, Karstaedt N, Partain CL (Eds). Bowman Gray School of Medicine, NC, USA 125–132 (1982).
- Edelstein WA, Bottomley PA, Hart HR et al.: NMR imaging at 5.1 MHz: work in progress. In: NMR Imaging. Witcofski RL, Karstaedt N, Partian CL (Eds). Bowman Gray School of Medicine, NC, USA 139–145 (1982).
- Wehrli FW, Song HK, Saha PK, Wright AC: Quantitative MRI for the assessment of bone structure and function. NMR Biomed. 19, 731–764 (2006).
- Henkelman RM, Stanisz GJ, Graham SJ: Magnetization transfer in MRI: a review. NMR Biomed. 14, 57–64 (2001).
- Robson MD, Gatehouse PD, Young IR, Bydder GM: Ultrashort TE (UTE) imaging of short T2 relaxation components: how should the T2 weighting be described? Proc. Intl Soc. Mag. Reson. Med. 11, 636 (2004).
- Fullerton GD, Cameron IL, Ord VA: Orientation of tendons in the magnetic field and its effect on T2 relaxation times. Radiology 155(2), 433–435 (1985).
- Henkelman RM, Stanisz GJ, Kim JK et al.: Anisotropy of NMR properties of tissue. Magn. Reson. Med. 32, 592–602 (1994).
- Krasnosselskaia LV, Fullerton GD, Dodd SJ, Cameron IL: Water in tendon: orientational analysis of the free induction decay. Magn. Reson. Med. 54(2), 280–288 (2005).
- Reichert ILH, Robson MD, Gatehouse PD et al.: Magnetic resonance imaging of cortical bone with ultrashort TE pulse sequences. Magn. Reson. Imaging 23(5), 611–618 (2005).
- Chen Q, Halse M, Balcom BJ: Centric scan SPRITE for spin density imaging of short relaxation time porous materials. Magn. Reson. Imaging 23(2), 263–266 (2005).
- Fernandez-Seara MA, Wehrli SL, Wehrli FW: Multipoint mapping for imaging of semi-solid materials. J. Magn. Reson. 160(2), 144–150 (2003).
- Bergin CJ, Pauly JM, Macovski A: Lung parenchyma: projection reconstruction MR imaging. Radiology 179(3), 771–781 (1991).
- Wu Y, Ackerman JL, Chesler DA, Graham L, Wang Y, Glimcher MJ: Density of organic matrix of native mineralized bone measured by water-and-fat suppressed proton projection MRI. Magn. Reson. Med. 50(1), 59–68 (2003).
- Qian Y, Boada FE: Acquisition-weighted stack of spirals for fast high-resolution threedimensional ultra-short echo time MR imaging. Magn. Reson. Med. 60(1), 135–145 (2008).
- Idiyatullin D, Corum C, Park JY, Garwood M: Fast and quiet MRI using a swept radiofrequency. J. Magn. Reson. 181(2), 342–349 (2006).
- Idiyatullin D, Corum C, Moeller S, Garwood M: Gapped pulses for frequency-swept MRI. J. Magn. Reson 193(2), 267–273 (2008).
- Weiger M, Pruessmann KP, Hennel F: Reconstruction strategies for MRI with simultaneous excitation and acquisition. Presented at: International Society for Magnetic Resonance in Medicine 17th Scientific Meeting and Exhibition. Honolulu, HI, USA, 18–24 April 2009.
- Blümlich B, Gong Q, Byrne E, Greferath M: NMR with excitation modulated by Frank sequences. J. Magn. Reson. 199(1), 18–24 (2009).
- Fagan AJ, Davies GR, Hutchison JM, Glasser FP, Lurie DJ: Development of a 3-D multi-nuclear continuous wave NMR imaging system. J. Magn. Reson. 176(2), 140–150 (2005).
- Navon G, Eliav U, Demco DE, Blümich B: Study of order and dynamic processes in tendon by NMR and MRI. J. Magn. Reson. Imaging 25(2), 362–380 (2007).
- Grenier D, Pascui O, Briguet A: Dipolar contrast for dense tissues imaging. J. Magn. Reson. 147, 353–356 (2000).
- Regatte RR, Schweitzer ME, Jerschow A, Reddy R: Magic sandwich echo relaxation mapping of anisotropic systems. Magn. Reson. Imaging 25(3), 433–438 (2007).
- Haacke EM, Mittal S, Wu Z, Neelavalli J, Cheng YC-N: Susceptibility-weighted imaging: technical aspects and clinical applications, part 1. AJNR Am. J. Neuroradiol. 30, 19–30 (2009).
- Mittal S, Wu Z, Neelavalli J, Haacke EM: Susceptibility-weighted imaging: technical aspects and clinical applications, part 2. AJNR Am. J. Neuroradiol. 30, 232–252 (2009).
- Du J, Chiang AJ, Chung CB et al.: Orientational analysis of the Achilles tendon and enthesis using an ultrashort echo time spectroscopic imaging sequence. Magn. Reson. Imaging (2009) (Epub ahead of print).
- Schäfer A, Wharton S, Gowland P, Bowtell R: Using magnetic field simulation to study susceptibility-related phase contrast in gradient echo MRI. Neuroimage 48(1), 126–137 (2009).
- de Rochefort L, Liu T, Kressler B et al.: Quantitative susceptibility map reconstruction from MR phase data using bayesian regularization: validation and application to brain imaging. Magn. Reson. Med. 63, 194–206 (2010).
- Cunningham CH, Arai T, Yang PC, McConnell MV, Pauly JM, Conolly SM: Positive contrast magnetic resonance imaging of cells labeled with magnetic nanoparticles. Magn. Reson. Med. 53(5), 999–1005 (2005).
- Suzuki Y, Cunningham CH, Noguchi K et al.: In vivo serial evaluation of superparamagnetic iron-oxide labeled stem cells by off-resonance positive contrast. Magn. Reson. Med. 60(6), 1269–1275 (2008).
- Liu W, Frank JA: Detection and quantification of magnetically labeled cells by cellular MRI. Eur. J. Radiol. 70(2), 258–264 (2009).
- Dahnke H, Liu W, Herzka D, Frank JA, Schaeffter T: Susceptibility gradient mapping (SGM): a new postprocessing method for positive contrast generation applied to superparamagnetic iron oxide particle (SPIO)-labeled cells. Magn. Reson. Med. 60(3), 595–603 (2008).
- Liu W, Dahnke H, Rahmer J, Jordan EK, Frank JA: Ultrashort T2* relaxometry for quantitation of highly concentrated superparamagnetic iron oxide (SPIO) nanoparticle labeled cells. Magn. Reson. Med. 61(4), 761–766 (2009).
- Koch KM, Lorbiecki JE, Hinks RS, King KF: A multispectral three-dimensional acquisition technique for imaging near metal implants. Magn. Reson. Med. 61(2), 381–390 (2009).
- Lu W, Pauly KB, Gold GE, Pauly JM, Hargreaves BA: SEMAC: slice encoding for metal artifact correction in MRI. Magn. Reson. Med. 62(1), 66–76 (2009).
- Cho ZH, Kim DJ, Kim YK: Total inhomogenity correction including chemical shifts and susceptibility by view angle tilting. Med. Phys. 15(1), 7–11 (1988).
- Techawiboonwong A, Song HK, Leonard MB, Wehrli FW: Cortical bone water: in vivo quantification with ultrashort echo-time MR imaging. Radiology 248(3), 824–833 (2008).
- Benjamin M, Milz S, Bydder GM: Magnetic resonance imaging of entheses. Part 1. Clin. Radiol. 63(6), 691–703 (2008).
- Benjamin M, Milz S, Bydder GM: Magnetic resonance imaging of entheses. Part 2. Clin. Radiol. 63(6), 704–711 (2008).
- Hauger O, Frank LR, Boutin RD et al.: Characterization of the “red zone” of knee meniscus: MR imaging and histologic correlation. Radiology 217, 193–200 (2000).
- Ra JB, Hilal SK, Cho ZH: A method for in vivo MR imaging of the short T2 component of sodium-23. Magn. Reson. Med. 3(2), 296–302 (1986).
- Robson MD, Gatehouse PD, Bydder GM, Neubauer S: Human imaging of phosphorus in cortical and trabecular bone in vivo. Magn. Reson. Med. 51, 888–892 (2004).
- Gatehouse PD, He T, Puri BK, Thomas RD, Resnick D, Bydder GM: Contrast-enhanced MRI of the menisci of the knee using ultrashort echo time (UTE) pulse sequences: imaging of the red and white zones. Br. J. Radiol. 77, 641–647 (2004).
- Gold GE, Thedens DR, Pauly JM et al.: MR imaging of articular cartilage of the knee: new methods using ultrashort TEs. AJR Am. J. Roentgenol. 170(5), 1223–1226 (1998).
- Hall-Craggs MA, Porter J, Gatehouse PD, Bydder GM: Ultrashort echo time (UTE) MRI of the spine in thalassaemia. Br. J. Radiol. 77, 104–110 (2004).
- Waldman A, Rees JH, Brock CS, Robson MD, Gatehouse PD, Bydder GM: MRI of the brain with ultra-short echo-time pulse sequences. Neuroradiology 45, 887–892 (2003).
- Portman O, Flemming S, Cox JP, Johnston DG, Bydder GM: Magnetic resonance imaging of the normal pituitary gland using ultrashort TE (UTE) pulse sequences. Neuroradiology 50, 213–220 (2008).
- Chappell KE, Patel N, Gatehouse PD et al: Magnetic resonance imaging of the liver with ultrashort TE (UTE) pulse sequences. J. Magn. Reson. Imaging 18, 709–713 (2003).
- Wansapura JP, Daniel BL, Vigen KK, Butts K: In vivo MR thermometry of frozen tissue using R2* and signal intensity. Acad. Radiol. 12, 1080–1084 (2005).
- Filho GH, Du J, Pak BC et al: Quantitative characterization of the Achilles tendon in cadaveric specimens: T1 and T2* measurements using ultrashort-TE MRI at 3T. AJR Am. J. Roentgenol. 192, 117–124 (2009).
- Du J, Pak BC, Znamirowski R et al.: Magic angle effect in magnetic resonance imaging of the Achilles tendon and enthesis.
- Magn. Reson. Imaging 27, 557–564 (2009). 57 Gurney PT, Hargreaves BA, Nishimura DG: Design and analysis of a practical 3D cones trajectory. Magn. Reson. Med. 55, 575–582 (2006).
- Du J, Takahashi AM, Bydder M, Chung CB, Bydder GM: Ultrashort TE imaging with off-resonance saturation contrast (UTE-OSC). Magn. Reson. Med. 62, 527–531 (2009).
- Springer F, Martirosian P, Machann J, Schwenzeer NF, Claussen CD, Schick F: Magnetization transfer contrast imaging in bovine and human cortical bone applying an ultrashort echo time sequence at 3 Tesla. Magn. Reson. Med. 61, 1040–1048 (2009).
- Robson MD, Gatehouse PD, So PW, Bell JD, Bydder GM: Contrast enhancement of short T2 tissues using ultrashort TE (UTE) pulse sequences. Clin. Radiol. 59, 720–726 (2004).
- Crowe LA, Wang Y-X, Gatehouse P et al.: Ex vivo MR imaging of atherosclerotic rabbit aorta labeled with USPIO – enhancement of iron loaded regions in UTE imaging. Proc. Intl Soc. Mag. Reson. Med. 13, 115 (2005).
- O’Brien KR, Myerson SG, Cowan BR, Young AA, Robson MD: Phase contrast ultrashort TE: a more reliable technique for measurement of high-velocity turbulent stenotic jets. Magn. Reson. Med. 62, 626–636 (2009).
• • Description of orientation-dependent bulk magnetic susceptibility change in tendons.
• • Description of advanced method of acquisition and data collection.
• Good background reading and description of the continuous-wave method.
• Good general coverage of susceptibility-weighted imaging.
• Good general coverage of susceptibility-weighted imaging.
• Coverage of imaging techniques for magnetic iron oxide particles.
• Key reference on metal artifact control.
• Key reference on metal artifact control.
• Clinical application of short T2 measurements.
• Distinction of red and white zones.


