Research Article - Imaging in Medicine (2016) Volume 8, Issue 2
Improving image quality in low snr parallel acquisition using a weighted least squares GRAPPA reconstruction
Raji Susan Mathew*& Joseph Suresh Paul*Medical Image Computing and Signal Processing Laboratory, Indian Institute of Information Technology, Kerala, India
- Corresponding Author:
- Raji Susan Mathew & Joseph Suresh Paul
Medical Image Computing and Signal Processing Laboratory
Indian Institute of Information Technology, Kerala, India
Tel: +919846627817
E-mail:j.paul@iiitmk.ac.in
Abstract
We analyze the performance of a Weighted Least Squares (WLS) GRAPPA calibration for improving the g-factor of GRAPPA reconstruction from low Signal-to-Noise-Ratio (SNR) acquisition. Our method is particularly useful when the SNR degradation is influenced by noise correlation across channels. When applied with regularization, this form of GRAPPA reconstruction is found to be superior compared to other recent variants of GRAPPA such as coefficient penalized GRAPPA. We demonstrate this feature quantitatively using GRAPPA derived g-factors.
Keywords
GRAPPA, calibration, weighted least squares, g-factor
Introduction
The generalized autocalibrating partially parallel acquisition (GRAPPA) [1] is a coilby- coil parallel image reconstruction that estimates missing data in k-space based on additionally acquired calibration lines. In GRAPPA reconstruction, the missing k-space is obtained by fitting the reduced data set to the autocalibration signals (ACS), acquired at Nyquist rate. This fitting process is achieved by solving GRAPPA coefficients using an overdetermined linear system of equations (LSE) in the Least-Squares (LS) sense [2]. This form of fitting leads to decreased signal magnitude and increased noise level. Further, LS regression can perform very badly when some points in the training data have excessively large or small values for the dependent variable compared to the rest of the training data. Several GRAPPA variants have been proposed in the past decades to compensate this.
In the current work, we propose a Weighted Least Squares calibration which is least sensitive to correlation among receiver coils. Data dependent weights are derived based on error correlation computed using LS calibration. Weights are obtained using a parametrically controlled non-linear mapping of error autocorrelation such that weight magnitudes reduce with increasing correlation.
The paper is organized as follows. In methods section, a brief overview of the proposed approach is presented. The results section presents the Signal-to-Noise-Ratio (SNR) performance of our method in comparison with other regularized GRAPPA methods.
Methods
■GRAPPA model
In GRAPPA, the unaliased coil images are reconstructed separately using the ACS obtained from sampling the central portion of each channel k-space at the Nyquist rate. This is achieved in two steps: Calibration of GRAPPA coil coefficients (GRAPPA weights), and estimation of the unacquired k-space points. The weight calculation in the calibration step is performed using ACS lines forming the training data.
For acquisition with nC coils, the weights are
dependent on an index η=1,..R-1, that reflects
the distance of an unacquired line from its
nearest acquired line. Let ky denote an acquired
k-space location. A diagrammatic representation
of GRAPPA reconstruction is shown in
FIGURE 1 For an acceleration factor of R=4,
each coil k-space is undersampled with R-1
unacquired lines and fully acquired ACS data.
The estimation of coil weights  is carried out
by fitting the target data
is carried out
by fitting the target data  to the
respective nearest source data k( ky) [3,4].
to the
respective nearest source data k( ky) [3,4].
where k(ky) is a vector consisting of ‘b’ nearest acquired neighbors of ky from all coils. This is mathematically represented as,
Length of kl( ky ) depends on the kernel size chosen for calibration. Using the notations described above, GRAPPA calibration equation can be expressed in matrix form as
Where KAacs is the calibration matrix whose
rows consist of k(ky) corresponding to each acquired location within the ACS.  is the
vector consisting of the corresponding target
samples at a distance ηΔky from the nearest
source data (FIGURE 1).
is the
vector consisting of the corresponding target
samples at a distance ηΔky from the nearest
source data (FIGURE 1).

Figure 1: Illustration of GRAPPA reconstruction for acceleration factor R=4.
In noisy situation, can be expressed as
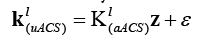
where ε represents iid Gaussian white noise. It is well-known that the magnitude of noise variance changes as a function of coil and k-space location [5]. Particularly, the errors are large near to the central region of k-space. Under this condition, Weighted Least Square (WLS) is known to provide more accurate solution to Eq. (4). In Weighted Least Square approach, the weighted mean squared error is minimized, i.e,
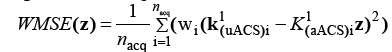
Where nacq is the number of acquired locations in the ACS. The corresponding solution is
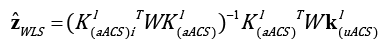
where W is diagonal matrix consisting of wi as the diagonal elements. WLS requires small weights at locations corresponding to large noise variance. Hence, if the variances are known apriori, the weights wi are chosen such that
wi=1/σi
In most cases, an appropriate estimate of σi can be obtained from repeated acquisitions (8) as in
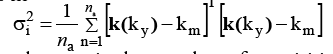
where na is the number of acquisitions and
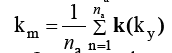
In practical situations, it is impractical to have repeated acquisitions.
The weights can also be determined based on correlation measures. Since the errors are higher at the centre and decreases radially outwards, the k-space correlation can also be described based on distances of each k(ky) from that corresponding to the k-space location with largest error. Thus, the weights can be equivalently represented by
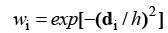
where di is the distance between k(ky) for the ith acquired ACS location and that corresponding to the central location having largest error and h is called bandwidth. The value of h is dependent on the degree of k-space correlation. FIGURE 2 shows the distances and corresponding weights for simulated phantom data obtained at reducing coil radius-to-FOV ratios. The k-space correlation increases in both cases. It is also observed that weight magnitudes reduce with both increasing correlation and distance. The spatially adaptive nature of WLS solution makes it compatible under varying correlation and at higher acceleration factors. A schematic workflow of the proposed approach is given in FIGURES 2 and 3.

Figure 2: (a)-(c) Distance maps for FOV 20, 40, 60 respectively (d)-(f) weight values corresponding to distance maps.

Figure 3: Workflow of Weighted Least Squares GRAPPA.
g-factor calculation
Parallel MR reconstruction methods exhibit nonuniform loss in SNR compared nonaccelerated imaging. In general, SNR of the reconstructed image is reduced by square root of the reduction factor R as well as by an additional coil geometry dependent factor [6,7]. The second factor called geometry factor (g-factor) quantifies the overall loss in SNR in the reconstructed image. Thus the nonuniform noise enhancement in the GRAPPA reconstructed image can be derived on a pixel-by-pixel basis by finding the ratio of fully encoded SNR map to the product of GRAPPA SNR map and square root of acceleration factor R. In addition, the g-factor is a function of both the coil sensitivities and the pattern of acquired k-space lines. An increase in the g-factor value indicates an increase in noise in the reconstructed image. The g-factor computation is performed as discussed in Breuer et al. [6].
Data sets
The volunteer datasets used in this study consist of Data set-I. 16-channel FLAIR data (with parallel imaging ON, R=2, 32 ACS lines) acquired on 1.5T clinical MR scanner (Magnetom-Avanto, Siemens, Erlangen, Germany). The acquisition parameters were set at TE=89 ms, TR=9000 ms, TI= 2500 ms with 1.5 mm in-plane resolution and 5.0 mm slice thickness. Data set-II. 6-channel FLAIR data (with parallel imaging OFF) acquired on 1.5T clinical MR scanner (Magnetom-Avanto, Siemens, Erlangen, Germany). The acquisition parameters were set at TE=89 ms, TR=9000 ms, TI=2500 ms with 1.0 mm in-plane resolution and 5.0 mm slice thickness.
Results
Results of GRAPPA reconstruction applied to volunteer data are shown in FIGURES 4 and 5. The SoS reconstruction from a fully acquired data is used as reference image for comparison. The reconstructions are performed on retrospectively sampled data with an acceleration factor R=2 and 32 ACS lines. A kernel of size 2×5 is used for calibration. The panels reveal better visual quality for images reconstructed using WLS calibration as compared to LS, Tikhonov regularization (Tik) and coefficient penalized (PC) form of regularization (FIGURE 6).

Figure 4: GRAPPA reconstructed images Data set-I. for Least Squares(LS), Tikhonov (Tik), coefficient Penalized (PC), Weighted Least Squares (WLS) at R=2. The corresponding reconstruction errors are given at the right corner of each image.

Figure 5: GRAPPA reconstructed images Data set-II. For Least Squares (LS), Tikhonov (Tik), coefficient Penalized (PC) , Weighted Least Squares (WLS) at R=2. The corresponding reconstruction errors are given at the right corner of each image.

Figure 6: g-factor maps of GRAPPA reconstructed images (A) Data set-I (B) Data set-II . The mean g-factor values are given at right corner of each image.
Conclusion
It is well-established that an optimal GRAPPA reconstruction should consider the spatial correlation in k-space [8]. In WLS, the magnitude of weights is dependent on both distance and correlation. The effect of data driven weights in WLS is similar to frequency discriminated GRAPPA [9] and High Pass GRAPPA [10]. In the frequency discriminated GRAPPA, the low frequency window is removed in the calibration step to reduce the bias in the reconstruction. In WLS, the frequency discrimination is automatically attained through weights derived from feature distances. Also, the extent of discrimination depends on k-space correlation. With appropriate choice of mapping parameter α, the method is particularly suited to yield better solutions in low SNR acquisitions. Consequently, this form of GRAPPA calibration is a better choice under non-ideal conditions.
References
- Griswold MA, Jakob PM, Heidemann RM et al. Generalized autocalibrating partially parallel acquisitions (GRAPPA). Magn. Reson. Med. 47, 1202-1210 (2002).
- Qu P, Wang C, Shen GX. Discrepancybased adaptive regularization for GRAPPA reconstruction. J. Magn. Reson. Imaging. 24, 248-255 (2006).
- Blaimer M, Breuer F, Mueller M, et al. SMASH, SENSE, PILS, GRAPPA: how to choose the optimal method. Top. Magn. Reson. Imaging. 15, 223-236 (2004).
- Hoge WS, Brooks DH, Madore B et al. A tour of accelerated parallel MR imaging from a linear systems perspective. Concepts. Magn. Reson. Part A 27, 17-37 (2005).
- Aja-Fernández S, Vegas-Sánchez-Ferrero G, Tristán-Vega A. Noise estimation in parallel MRI: GRAPPA and SENSE. Magn. Reson. Imaging. 32, 281-290 (2014).
- Breuer FA, Kannengiesser SA, Blaimer M et al. General formulation for quantitative G-factor calculation in GRAPPA reconstructions. Magn. Reson. Med. 62, 739- 746 (2009).
- Ohliger MA, Sodickson DK. An introduction to coil array design for parallel MRI. NMR Biomed. 19, 300-315 (2006).
- Park S, Park J. Adaptive self-calibrating iterative GRAPPA reconstruction. Magn. Reson. Med. 67, 1721-1729 (2012).
- Aja-Fernández S, Martín DG, Tristán-Vega A et al. Improving GRAPPA reconstruction by frequency discrimination in the ACS lines. Int. J. Comput. Assist. Radiol. Surg. 10, 1699-1710 (2015).
- Huang F, Li Y, Vijayakumar S et al. Highpass GRAPPA: an image support reduction technique for improved partially parallel imaging. Magn. Reson. Med. 59, 642-649 (2008).


