Research Article - Diabetes Management (2022) Volume 12, Issue 4
LINASH: A smartphone-based Lyfas IOT platform for non-invasive mass screening and staging of NASH
- Corresponding Author:
- Subhagata Chattopadhyay
Department of Research and Development, Acculi Labs Pvt, Karnataka, India
E-mail: subhagata.chattopadhyay2017@gmail.com
Received: 13-Jun-2022, Manuscript No. FMDM-22-66547; Editor assigned: 15-Jun- 2022, PreQC No. FMDM-22-66547 (PQ); Reviewed: 08-Jul-2022, QC No. FMDM-22- 66547; Revised: 12-Jul-2022, Manuscript No. FMDM-22-66547 (R); Published: 19-Jul- 2022, DOI: 10.37532/1758-1907.2022.12(4).375-386
Abstract
Objective: NASH is a progressive stage of Non-alcoholic Fatty Liver Disease (NAFLD) and is characterized by liver fibrosis. NAFLD is a silent tsunami of the cardiometabolic syndrome (CMS). Insulin resistance (IR) is the hallmark feature of CMS that Lyfas, a smartphone-based m-health instrument, captures non-invasively by measuring the low-by-high frequency ratio (LF/HF), derived from a short heart rate variability (HRV). The paper proposes an end-to-end Lyfas IoT Non-alcoholic Steatohepatisis (NASH) screening and staging platform (LINASH).
Methods: An online screening platform for NAFLD and NASH using Chronic Liver Disease Questionnaire (CLDQ) and developing recommendation engines for grading and management of NASH. Suspicious cases took the Lyfas tests thrice daily for a month. An average LF/HF score is captured, based on which LINASH recommends a USG elastogram to examine the liver stiffness, which, if present, further recommends blood tests and FIB-4 scoring to decide on the liver biopsy, else they are monitored. Statistical correlations and reliability of LF/HF with blood biomarkers, physical parameters, and FIB-4 are also checked. An IoT-enabled platform for generating health awareness, screening, and prediction of NASH. A total of 86 NAFLD and 38 NASH-affected subjects participated in the LINASH trial. Another 106 healthy controls were also recruited.
Results: LF/HF has a good agreement with the FIB-4 method. LF/HF also has a good correlation with ALT across the population, except for the healthy and NASH males.
Conclusion: LF/HF is a significant COB of IR and has a good correlation with ALT. It can be reliably used for screening NAFLD and possibilities of NASH, integrated with USG elastography and then FIB-4 for staging. LINASH is a fast, personalized, non-invasive, and ubiquitous smartphone-based platform that can be used for initial epidemiological surveillance on a mass scale. An inadvertent sampling bias while excluding alcoholic steatohepatitis.
Keywords
LINASH; NAFLD; NASH; LF/HF; FIB-4; lyfas
Introduction
Non-alcoholic Fatty Liver Disease (NAFLD) is mostly an accidental detection in a routine health check with or without elevated liver enzymes and no significant symptoms can be found in most cases. Lifestyle issues coupled with increased fast-food consumption are two known important precursors of the Cardiometabolic Syndrome (CMS), such as obesity, diabetes, atherogenesis, and so forth [1]. NAFLD and its extended pathological version called Non- alcoholic steatohepatitis (NASH) fall well under the CMS. Therefore, NAFLD and NASH should be screened as an entity and not in an isolated manner.
• The epidemic of NAFLD and NASH
NAFLD can be found in 25.2% of the global population and seems to be a new deadly epidemic, where >5% of liver cells (hepatocytes) are infiltrated with fat (3). Around 10%- 30% of NAFLD progresses to NASH where fat-laden hepatocytes undergo inflammatory changes and eventually are fibrosed [2,3]. The estimated prevalence of NASH by 2030 would be a whopping number of around 63%. Approximately 20%-30% of NASH develop advanced fibrosis (called cirrhosis of the liver), and hepatocellular carcinoma (HCC) which is a much flared-up CMS [3,4].
Genetic polymorphism of PNPLA3 and TM6SF2 shows a strong correlation between NASH and HCC (5). NASH is, therefore, the key cause of a few million liver transplantations, globally [5]. Hence, NAFLD and NASH need early screening and management.
Obesity and Type2 Diabetes (T2D) are two key predisposing comorbidities of NAFLD and NASH and on many occasions, NAFLD and NASH cause obesity and T2D in the population, which are also on a rise [6,7]. Junk food intake is supposed to be one emerging risk factor for Obesity and T2D and thereby NAFLD and NASH with the advancement of the age [8]. Circadian rhythm dysregulation is another known factor behind the occurrence of NASH [9]. Put together, there is a strong interplay of nutrition type, circadian clock, family history, and CMS can be found in the backdrop of the development of NASH in the population. NASH has been an enlisted illness in ICD-10 with the diagnosis code of K75.81 [10]. NASH is a silent killer. HCC and CMS are cofounding factors as cancer cells, for rapid proliferation, need to create their cellular components, nucleic acids, proteins, and lipids, and for that, they reprogram the process of lipogenesis, which is seen in NAFLD [11].
• Current methods of NAFLD and NASH diagnosis
The following modalities are used currently,
Non-invasive:
a) Ultrasonography (USG) and Ultrasound elastography (two types: strain and shear wave elastography [12].
b) Computed Tomography (CT) scan elastography.
c) Magnetic Resonance Imaging (MRI) elastography.
Invasive:
a) Liver biopsy
b) Fibrosis-4 (FIB-4) study as it requires the values of liver enzymes, and platelet count in the blood (see equation-1) [13].
• Insulin resistance in CMS
In almost all CMS, Insulin Resistance (IR) is the key occurrence [14]. IR pushes pancreatic β-cells to produce more insulin and slowly kills these cells causing hyperglycemia and T2D. IR-led CMS facilitates the occurrence of NASH through heightened sympathetic activation [15]. Certain proteins, such as inhibin, norepinephrine, and neuropeptide-Y are the known markers of hepatic stress and fibrogenesis of hepatic stellate cells that happens in NASH [15]. It is supported by the observation that reduced sympathetic activation increases hepatic progenitors and lessens liver injuries at the cellular level. Therefore, IR is one of the principal markers of NAFLD and then the NASH pathogenesis.
• The sympathetic nervous system in CMS
The Sympathetic Nervous System (SNS) supplies all organs and SNS activation takes place during stress to meet up the high metabolic demand. However, sympathetic overdrive for a prolonged period due to hypothalamic- pituitary-adrenal axis malfunction is ominous and affects the normal functioning of the organs [16]. Among several, some notable sequels of sympathetic overdrive are vasoconstriction and rise in BP, increased cardiac force of contraction and tachycardia, IR (as discussed above), decreased glucose uptake by skeletal muscles, increased lipolysis in adipose tissue, increased glycogenolysis and gluconeogenesis in the liver and kidneys, increased sodium retention and renin release in kidneys contributing to hypertension [15]. Therefore, SNS and IR are cofounding factors in CMS.
• Lyfas IoT-enabled mobile health instrument
Internet of Things (IoT)-enabled mobile health (m-Health) has been a tremendous technological support to today’s digital healthcare. It’s a new industry and the estimated market size will be $213.6 billion by 2025 from $50.8 billion in 2020 at a CAGR of 33.3% at per to the increasing number of smartphone users, which is estimated as >1.5 billion by 2040 from 748 million in 2020 [17,18]. Lyfas is an IoT-enabled non-invasive, ubiquitous, robust, and reliable biomedical application that when installed in an Android smartphone converts the phone into a healthcare instrument [19,20]. Using the inbuilt sensor in the phone camera and its light source, Lyfas captures the pulse wave velocity (PWV) and pulse rate variability (PRV, which is synonymous with HRV) from the index finger capillary using arterial photoplethysmography (APPG) and the solute components using photochromatography (PCG) [21]. Hence, Lyfas does not require any additional hardware support. Its proprietary signal processing algorithm evaluates the short heart rate variability (HRV) and its correlated optical biomarkers, which are surrogates of cardiac autonomic neuropathy (CAN) that happens due to IR in CMS. The low frequency (LF) and high frequency (HF) signals were obtained from HRV surrogates for the sympathetic and parasympathetic activations, respectively in the autonomic nervous system (ANS). Its comprehensive mind-body analytics gives a snapshot of the sympathovagal balance of the body, which can be evaluated by assessing the LF/HF ratio [22]. Therefore, Lyfas can be handy in NASH phenotyping in a widespread population at any given time. It is also worth noting that on an average of 3-5 minutes, the Lyfas test to analytics can be completed.
The objective of the study is to (i) examine the behavior of LF/HF COB in NAFLD and NASH vs. healthy adult population, (ii) mine the correlation of LF/HF with the factors associated with NAFLD and NASH, and (iii) constructing a Lyfas IOT platform for NASH screening called LINASH.
The novelty of the study lies with (i) the firstever IoT-enabled m-Health application of COBs in the screening of NAFLD and NASH to the best of the knowledge of the authors, and (ii) the application of IoT in the phenotyping of NASH non-invasively and pervasively in a much-personalized manner in the vulnerable population to assist medical doctors for its early management.
Methodology
• Statement of ethical clearance
The study protocol was approved by the Vagus Institutional Ethics Committee, Bengaluru, Malleswaram, Karnataka, India review board, which is registered with the Central Drugs Standard Control Organization, Ministry of Health and Family Welfare, Govt. of India (No. ECR/1181/Inst/KA/2019, dated 30-01-2020).
• Patients’ consent to participate
Signed informed consents of all participants’ have been taken on the organization letterhead according to the declaration of Helsinki by the research team prior test.
• Recruitment of the subjects
A total of 215 adults, divided into three groups as below are recruited for the study, based on the USG findings (by an experienced radiologist).
• Gr-I (NAFLD) Male (M) 75, Female (F) 11
• Gr-II (NASH) M 15, F 8
• Gr-III (Healthy control) M 86, F 20.
The liver enzymes e.g., ALT and AST, and Abdominal USG reports mainly helped group the participants [23].
People having a history of alcohol, Vita-A, methotrexate, or similar other agents causing NAFLD are excluded from the study. Also, no HCC patients are recruited.
The experiments were run on a high-end GPU, the Tesla V100-PCIE, containing 2496 CUDA cores. After training, all 6,988 images in the dataset were processed to generate the vasculature images (FIGURE 1). Segmentation time took 1 hour and 49 minutes.
• The rationale for choosing factors
1. Age: the incidence of NASH is increased as age increases [24].
2. Gender: M is more affected compared to F [25].
3. History of smoking: Smoking tobacco increases the risk of NAFLD in both active and passive smokers [26].
4. History of junk food intake (called junk food eaters or junkies): Eating junk food increases the risk of NAFLD [27].
The weighted score (0,1) of smoking and junk food intake is considered in this study. Scores >0.5 are considered high (abnormal).
5. BMI: Obese (BMI>29) individuals are more at risk of developing NASH [28].
6. BP: high BP (SBP>120 and DBP>80 mmHg) denotes sympathetic overdrive [16].
7. TG and LDL/HDL ratio: Dyslipidemic individuals having TG>200 mg% and LDL/ HDL>5.1 are more prone to NASH and related complications [28].
8. HbA1c: T2D (>6.5%) poses to be a high risk of development of NASH and vice versa [28].
9. Platelet count (PC): Platelets facilitate immune cell recruitment and cytokines-induced liver damage. Lipid toxicity helps the accumulation of platelets in the liver, extensive platelet adhesion, and platelet activation, which is the key pathophysiology of the immunoinflammatory reaction and activation of stellate cells of the liver [29]. These cells then behave like transitional cells or cells similar to myofibroblasts that can synthesize laminin and collagen type I, III, and IV, which eventually fills up the space of Disse in the liver, causing extensive fibrosis in the liver [30]. Thrombocytopenia is indicative of NAFLD and NASH [31].
10. ALT and AST (two important liver enzymes, elevated in NAFLD and NASH, respectively).
11. FIB-4: Fibrosis- 4 (FIB-4) estimates scarring of the liver due to fibrosis (13).
FIB-4 score calculation:
A score <1.45 indicates nil liver fibrosis with >90% confidence; while an over 65% chance of liver fibrosis is there if the scores are >3.25, which is an important indication for liver biopsy. FIB-4 scores prevent patients from undergoing unnecessary liver biopsies [13].
12. COB: Low by high-frequency short HRV signals LF/HF that is a frequency measure of sympathovagal balance where LF refers to sympathetic drive while HF parasympathetic. LF is a measure of the state of IR-led CMS and a high ratio indicates sympathetic overdrive [22]. Values over 2.5 indicate a high sympathovagal tone of sympathetic overdrive [22].
• Data metric
Factors: Age, Smoking, and history of junk food eating, BMI, BP (SBP and DBP), TG, LDL/ HDL, HbA1c, LF/HF, PC, ALT, AST, and FIB- 4. The objective is to note the strength of the correlations of all these factors with the factors associated with NAFLD and NASH.
Therefore, a total of 6 data sets are created gender and group-wise to conduct the following statistical tests to analyze the inter-factor relationships.
• Statistical methods and their rationale
It is important to mention that the statistical methods are applied to analyze the significance and reliability of LF/HF as a COB of NAFLD and NASH. In doing so, (a) Internal consistency (Cronbach’s α (32)), (b) central tendency (descriptive statistics), (c) normality measure (Quantile-Quantile plots), (d) intergroup dependencies (Kruskal-Wallis test for one-way analysis of variance as there are >2 groups in this experiment, followed by Dunn’s posthoc test to examine any statistically significant difference between any two groups), (e) correlations and its statistical significance (Spearman’s correlation) between the LF/HF and the factors related to NAFLD and NASH and the rest, and (f) Bland- Altman inter-factor reliability are also computed. It is important to note that all statistical experiments are performed with a confidence interval (CI) of 95%, and a p-value of 0.05.
• Construction of the Lyfas IoT NASH screening and staging platform (LINASH)
The LINASH platform consists of the following layers:
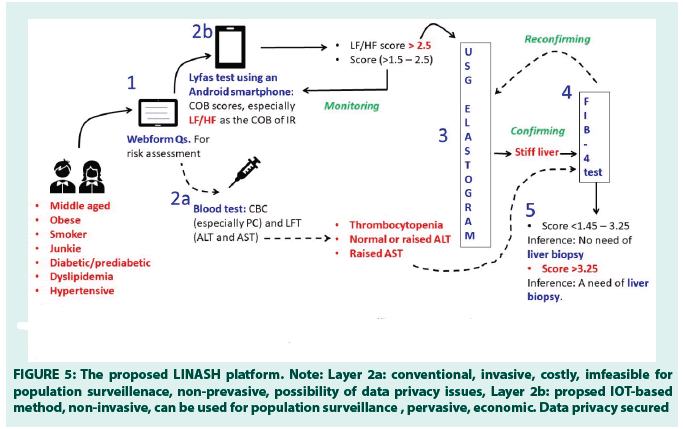
Layer 1: Web capture of biophysical data through a questionnaire (Age, gender, BMI, history of smoking, junk food eating, hypertension, diabetes/prediabetes, and dyslipidemia) and CLDQ to assess the risk severity [20].
Layer 2b: The Lyfas test recommendation engine (average LF/HF score as a COB of IR)
Layer 3: USG Elastography to note liver stiffness if 2b scores are abnormal, while for suspicious cases, Lyfas tests are continued at a quarterly interval thrice daily per week to note the pattern of the LF/HF score
Layer 4: Blood test (2a) recommendation and FIB-4 calculator layer if there is a stiff liver, and finally
Layer 5: Liver biopsy recommendation layer based on the FIB-4 score >3.25, else for suspicious cases USG Elastogram and Lyfas tests are continued quarterly as a combined monitoring method.
Results
In this section, experimental results are mentioned.
The α-values for each group are close to or above 7, which indicates that the population data is 70% consistent (33) (TABLE 1).
|
|
NAFLD | NASH | HEALTHY | TOTAL | ||||
|---|---|---|---|---|---|---|---|---|
| M | F | M | F | M | F | M | F | |
| Count | 75 | 11 | 15 | 8 | 86 | 20 | 176 | 39 |
| α | 0.81 | 0.78 | 0.69 | 0.69 | 0.75 | 0.72 | 0.7 | |
TABLE 1: The population size of the three groups and their respective α-value.
TABLE 2a through c shows the results of descriptive statistics of Healthy, NAFLD, and NASH, respectively. For easy visualization, the cells are colored red (abnormal values) and green (normal values). Age is kept as yellow.
From TABLES 2a-2c, it can be observed that:
i) Progression to NAFLD and then NASH is directly correlated with the advancement of the age.
ii) A high BMI, Positive history of smoking, and junk food eating are present in case of NASH but not in NAFLD.
iii) Correlation between high BP and NAFLD and NASH (high SBP in M and high DBP in F) are noted.
iv) Abnormal LFT, T2D, and dyslipidemia can be noted in both NAFLD and NASH populations.
v) A high FIB-4 score can be found for NASH.
vi) LF/HF scores are high in NAFLD and NASH indicative of IR.
| Mean | Median | Stdev | Min | Max | ||||||
|---|---|---|---|---|---|---|---|---|---|---|
| M | F | M | F | M | F | M | F | M | F | |
| Age | 53 | 51.35 | 54 | 51 | 11.66 | 10.2 | 36 | 36 | 74 | 73 |
| Smoker | 0.51 | 0.55 | 1 | 1 | 0.50 | 0.51 | 0 | 0 | 1 | 1 |
| Junkie | 0.58 | 0.5 | 1 | 0.5 | 0.49 | 0.5 | 0 | 0 | 1 | 1 |
| BMI | 29.01 | 26.71 | 29.22 | 27.88 | 4.02 | 3.65 | 22.13 | 22 | 35.98 | 33 |
| SBP | 129 | 121.23 | 124 | 119 | 15.88 | 16 | 100 | 102 | 139 | 131 |
| DBP | 71 | 72.33 | 70 | 72 | 18 | 17 | 97 | 92 | 100 | 89 |
| TG | 130 | 132.8 | 108 | 143 | 109 | 99.45 | 100 | 102 | 150 | 165 |
| LDL/HDL | 1.73 | 1.85 | 2 | 1.85 | 1.62 | 1.42 | 1.1 | 1.2 | 3 | 2.4 |
| HbA1c | 5.46 | 5.35 | 5 | 5 | 0.28 | 0.18 | 4.5 | 4.75 | 5.65 | 5.7 |
| PC | 218063 | 226829 | 225522 | 240628 | 54977 | 65651 | 103845 | 122792 | 299033 | 354275 |
| ALT | 71.2 | 73.5 | 65.9 | 79 | 29.09 | 30 | 28.2 | 28 | 120 | 114 |
| AST | 73.88 | 77.5 | 72.5 | 77.5 | 43.31 | 41.6 | 10 | 17 | 159 | 151 |
| LF/HF | 1.48 | 1.55 | 2 | 3 | 0.50 | 0.51 | 2 | 2 | 3 | 3 |
| FIB-4 | 1.44 | 1.2 | 1 | 1.12 | 0.50 | 0.51 | 2 | 1 | 3 | 2 |
TABLE 2a: Descriptive statistics of healthy control (normal USG findings).
|
|
Mean | Median | Stdev | Min | Max | ||||||
|---|---|---|---|---|---|---|---|---|---|---|---|
| M | F | M | F | M | F | M | F | M | F | ||
| Age | 54.88 | 54.54 | 55 | 52 | 11.51 | 15.08 | 35 | 38 | 75 | 75 | |
| Smoker | 0.48 | 0.45 | 0 | 0 | 0.50 | 0.52 | 0 | 0 | 1 | 1 | |
| Junkie | 0.25 | 0.45 | 0 | 0 | 0.43 | 0.52 | 0 | 0 | 1 | 1 | |
| BMI | 27.9 | 28.18 | 28 | 29 | 4.13 | 5.77 | 22 | 22 | 35 | 35 | |
| SBP | 144 | 140 | 142 | 146 | 28.06 | 30 | 100 | 102 | 189 | 181 | |
| DBP | 92 | 92 | 94 | 89 | 18.16 | 18 | 60 | 63 | 120 | 118 | |
| TG | 351 | 378 | 340 | 439 | 128 | 126 | 151 | 182 | 547 | 507 | |
| LDL/HDL | 4.26 | 3.72 | 4 | 4 | 1.76 | 1.27 | 2 | 2 | 7 | 6 | |
| HbA1c | 9.77 | 10.6 | 10 | 11 | 2.28 | 2.15 | 6 | 6 | 13 | 13 | |
| PC | 192818 | 207634 | 191137 | 219726 | 55108 | 67224 | 101154 | 113784 | 295657 | 290612 | |
| ALT | 74 | 88 | 76 | 89 | 28 | 24 | 29 | 41 | 119 | 120 | |
| AST | 88 | 97.72 | 90 | 99 | 42 | 35 | 12 | 33 | 156 | 151 | |
| LF/HF | 2.42 | 2.36 | 2 | 2 | 0.49 | 0.5 | 2 | 2 | 3 | 3 | |
| FIB-4 | 0.03 | 0.03 | 0.22 | 0.3 | 0.15 | 0.15 | 0.001 | 0.001 | 0.05 | 0.05 | |
TABLE 2b: Descriptive statistics of NAFLD (USG-diagnosed).
|
|
Mean | Median | Stdev | Min | Max | |||||
|---|---|---|---|---|---|---|---|---|---|---|
| M | F | M | F | M | F | M | F | M | F | |
| Age | 58.5 | 49.37 | 59 | 44 | 12.28 | 15.75 | 35 | 36 | 73 | 74 |
| Smoker | 0.7 | 0.875 | 1 | 1 | 0.48 | 0.35 | 0 | 0 | 1 | 1 |
| Junkie | 0.6 | 0.5 | 1 | 0.5 | 0.50 | 0.53 | 0 | 0 | 1 | 1 |
| BMI | 30 | 29.87 | 31 | 30.5 | 4.01 | 4.85 | 22 | 22 | 35 | 35 |
| SBP | 134 | 124.5 | 134 | 114 | 25.96 | 25.86 | 104 | 105 | 183 | 182 |
| DBP | 81 | 92.37 | 81 | 92 | 18.97 | 21 | 60 | 61 | 120 | 116 |
| TG | 345 | 369.62 | 355 | 378 | 133.53 | 131.1 | 167 | 184 | 550 | 541 |
| LDL/HDL | 4.33 | 5.6 | 4 | 6 | 1.75 | 1.4 | 2 | 4 | 7 | 7 |
| HbA1c | 9.46 | 10.75 | 9 | 10.5 | 2.58 | 2.18 | 6 | 7 | 13 | 13 |
| PC | 200812 | 169455 | 212912 | 152558 | 51211 | 55996 | 107691 | 101830 | 268482 | 248823 |
| ALT | 74.93 | 73 | 71 | 81 | 27.11 | 20 | 39 | 37 | 117 | 95 |
| AST | 96.13 | 64 | 81 | 45 | 43.62 | 54 | 26 | 11 | 158 | 158 |
| LF/HF | 2.56 | 3.59 | 2 | 2.5 | 0.51 | 0.5 | 2 | 2 | 3 | 3 |
| FIB-4 | 1.03 | 1.3 | 1.22 | 1.3 | 0.15 | 0.15 | 0.01 | 0.01 | 0.05 | 0.05 |
TABLE 2c. Descriptive statistics of NASH (USG-diagnosed).
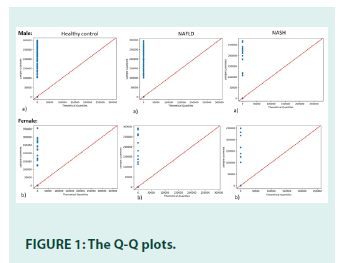
Data normality tests are conducted by Quantile- Quantile (Q-Q) plots, group-wise.
The Q-Q plot is the probability distribution plot where two probability distributions are compared by plotting their quantiles against each other. In the case of normally distributed data, the quantiles are aligned with the 45-degree straight line, called the reference line. The x and y-axes denote the theoretical and sample quantiles, respectively. Based on the Q-Q plots, The data in this study is not normally distributed.
• Kruskal-wallis one-way analysis of variance
Kruskal-Wallis one-way analysis of variance is the rank-based non-parametric version of the analysis of variance (ANOVA) when the data is not normally distributed and is smaller in size. As the number of groups in this experiment is 3 (i.e., >2), Mann-Whitney U-test has not been considered.
In this experiment, the null hypothesis (H0) is accepted when there is no significant median difference among the groups, otherwise, it is rejected and the alternate hypothesis (H1) is accepted.
The test shows that H0 is rejected for the population. To further screen the median independence between any two groups at a time, Dunn’s posthoc test is performed considering all factors.
Dunn’s posthoc test statistics for LF/HF (as an example) can be seen in TABLE 3. In this experiment, the calculated p-value of each factor is <0.05, indicating that H0 is rejected and there is a significant median difference between any two groups [32-35].
| Gr-1 | Gr-2 | Rmd | Stderr | zstat | rcrit | p | Interpretation |
|---|---|---|---|---|---|---|---|
| NAFLD | NASH | 1.66 | 2.71 | 0.61 | 5.31 | 0.53 | No significant difference or overlapping is present |
| NAFLD | HEALTHY | 9.33 | 0.007 | 1288.43 | 0.014 | 0 | Significant difference or no overlapping |
| NASH | HEALTHY | 11 | 0.72 | 15.09 | 1.428 | 0 | Significant difference or no overlapping |
TABLE 3: Dunn’s posthoc test statistics.
In TABLE 3, ‘Gr’, ‘Rmd’, ‘Stderr’, ‘zstat’, ‘rcrit’, and ‘p’ refers to ‘Group’, ‘Mean difference of the ranks’, ‘Standard error’, ‘z statistics’, ‘Critical value of rank’, and ‘p-value’. Statistically, there is no significant difference in the median of NAFLD and NASH. The reason could be the fact that NAFLD and NASH intertwine or overlap each other as the disease progresses from NAFLD to NASH with time. Hence, H0 is accepted in this case. On the other hand, there are statistically significant differences in the median between NAFLD and Healthy control and NASH and Healthy control. Hence, in these two cases, based on above TABLE 3, the H0 is rejected.
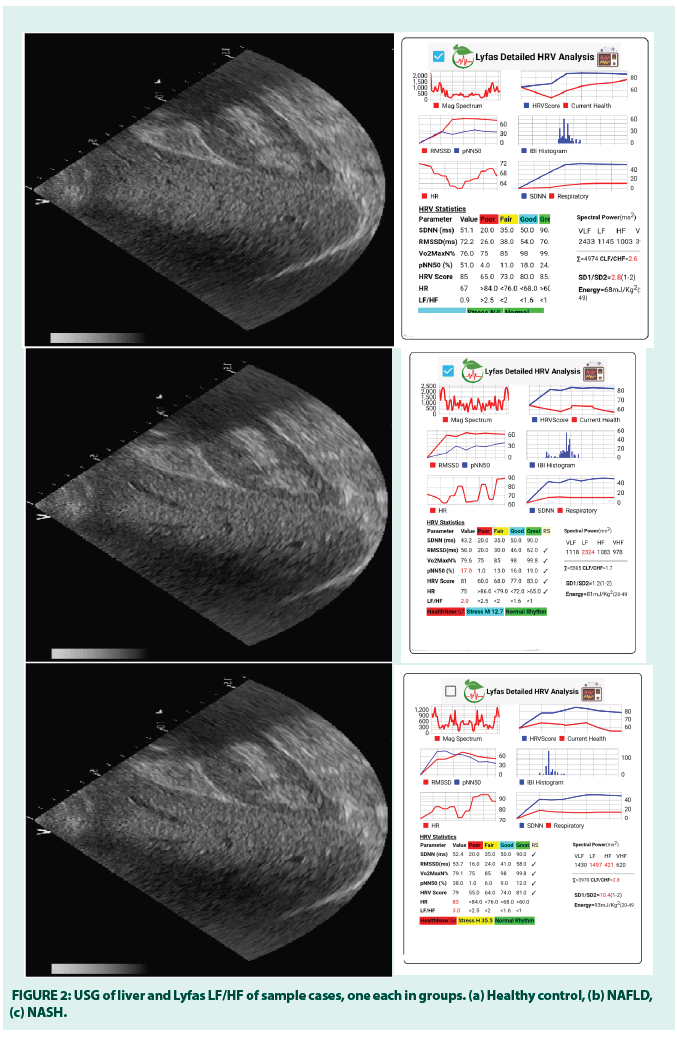
Sample cases of healthy control (M, 49 years), NAFLD (M, 56 years), and NASH (M, 52 years) and corresponding Lyfas LF/HF scores. Below are USG films of one M participant and the respective Lyfas LF/HF analytics for visual corroboration (FIGURE 2). The diagnosis has been made by a qualified radiologist.
In the above figure, the liver parenchyma in NAFLD and NASH are found to be alike in the Ultrasound test, but widely different from the normal liver.
• Spearman’s correlation test
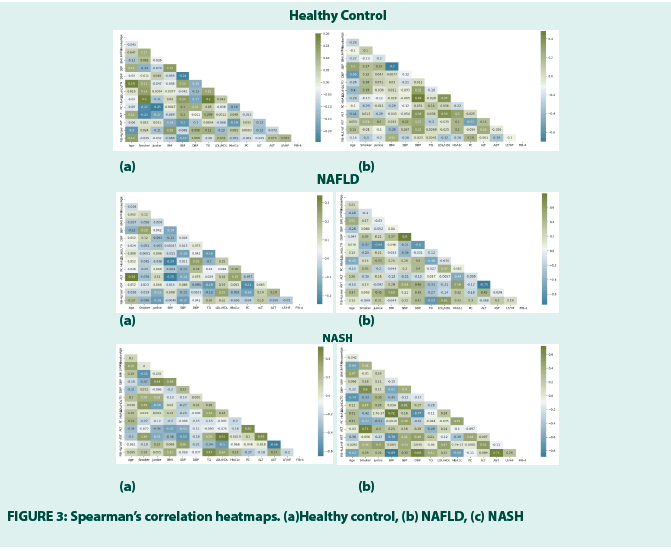
It is performed group and gender-wise (a) refer to M and (b) F to note how the factors are correlated to those associated with the liver dysfunction, especially how LF/HF is correlated with the factors associated with the liver dysfunction as the authors hypothesize that it could be one salient COB of NAFLD and NASH and Lyfas can capture it from a 120-sec short HRV. The H0 states that the correlation occurs by chance FIGURE 3.
The correlations (≥ 25% are considered that it is not by chance on the positive and negative side) and the respective statistical significance between the LF/HF and other factors are mentioned below in TABLE 4.
| Healthy (M) | Healthy (F) | NAFLD (M) | NAFLD (F) | NASH (M) | NASH (F) |
|---|---|---|---|---|---|
| Nil | DBP 32% ALT 26% BMI -39% |
ALT 25% | BMI 63% Junkie 45% ALT 45% Age 37% HbA1c 32% |
LDL/HDL 25% | ALT 51% Junkie 50% LDL/HDL 47% SBP 43% Smoker 38% |
TABLE 4: Significant correlations (%) between LF/HF and other factors.
From the above table, F shows the most number and strength of correlations between the LF/HF and other factors (both for NAFLD and NASH) and it is not just by chance, rejecting the H0. The result shows that Fs are or more at risk for NAFLD and even at higher risk to develop NASH, compared to the M. Summarily, obese and pre-diabetic or diabetic Fs who eat junk foods and show increased ALT are at high risk of developing NAFLD with the advancement of age. When, smoking, systolic hypertension, and dyslipidemia are added to their lives, they are at a high risk of developing NASH. Therefore, in Fs, if the LF/HF scores are found high, a liver USG and LFT can be advised. LF/HF values over 3 must be corroborated with the FIB-4 statistics, as the study observes (refer to TABLE 2c). Other important correlators of ALT and AST can be seen in TABLE 5.
| Gr | Factor | ALT | AST |
|---|---|---|---|
| NASH M | LDL/HDL | - | 53% |
| ALT | - | 45% | |
| NASH F | Smoking | 71% | - |
| SBP | - | 41% | |
| DBP | - | 49% | |
| NAFLD F | SBP | - | 54% |
| DBP | - | 46% | |
| HbA1c | - | 59% |
TABLE 5. Other important correlators of ALT and AST.
From TABLE 5 it can be noted that smoking, hypertension, T2D, and dyslipidemia are cofounding risk factors for NASH in the population.
• Bland-Altman reliability test
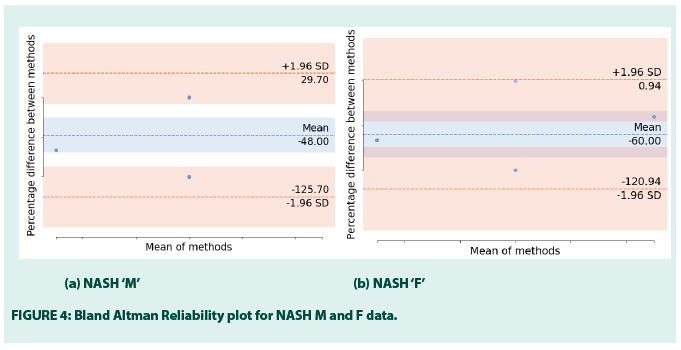
Although there is no direct correlation found between the LF/HF and FIB-4, yet, the paper studies the agreement between these two measures. LF/HF is a known biomarker of IR that occurs in CMS and the FIB-4 stages NASH to prevent unnecessary liver biopsies. Using the Bland-Altman reliability test, the paper measures if there is any existing proportional bias between these two factors (FIGURE 4). It plots the mean differences between the LF/HF and FIB-4.
FIGURE 4 is a scatter plot where X represents the mean of FIB-4 and LF/HF and Y represents the % difference between FIB-4 and LF/HF. The horizontal line in the middle of the plot denotes the mean, marked by the standard deviations for each (+1.96 to -1.96), the lower and upper bound of differences are -125.70 and 29.70 in M and -120.94 and 0.94 in F. The mean of the differences is -48.00 and -60.00, respectively. In the case of agreement, it is expected that the % differences should fall between the upper and lower bounds, which are noted in this figure. Therefore, although FIB-4 and LF/HF do not show correlations, yet, LF/HF can be used alternative to FIB-4 for NASH screening. It supports the fact that not necessarily two highly correlating factors or instruments can have a high degree of agreement and vice versa. FIGURE 5 shows the LF/HF scores in the F NAFLD and NASH [32,33].
Figure 5: The proposed LINASH platform. Note: Layer 2a: conventional, invasive, costly, imfeasible for population surveillenace, non-prevasive, possibility of data privacy issues, Layer 2b: propsed IOT-based
method, non-invasive, can be used for population surveillance , pervasive, economic. Data privacy secured
• The LINASH platform
This IoT platform is constructed to screen and stage NAFLD and NASH holistically (FIGURE 5). The vulnerable population i.e., the population with CMS takes the initial test after registering online. Chronic Liver Disease Questionnaire (CLDQ)-NAFLD/NASH instrument (38) has been used to capture the patient data in addition to lifestyle-related information (e.g., smoking, junk food intake), history of diabetes/ prediabetes, dyslipidemia, BMI, BP, the family of NASH/Cirrhosis/HCC, and the age is noted. Accordingly, the risk of developing NASH has been estimated by an experienced medical doctor (Layer-1). In case of any suspected risk, the subjects are advised to take the Lyfas test (Layer-2b), which is non-invasive, scalable, and pervasive instead of conventional blood tests at a very initial stage (Layer-2a). As LF/HF is the COB of IR that occurs in CMS, its scores are measured thrice daily for a week and the average score is considered for further investigation. It is also important to note that LF/HF is highly correlated with the ALT in NASH F (51%, p-value 0.012), NAFLD F (45%%, p-value 0.002), NAFLD M (25%%, p-value 0.232), and healthy F (26%%, p-value 0.412) across the study population. Hence, at the initial stage, LF/HF is recommended instead of pursuing the LFT, followed by the USG elastogram straight if LF/HF scores are persistently high to note the liver stiffness due to fibrosis (Layer-3). LINASH decision engine-1 works here. On the other hand, the LINASH decision engine-2 has been constructed to decide on the necessity of the liver biopsy with the help of the FIB-4 test (Layer-4) and as a precondition to it, necessary blood tests (Layer-2a) are recommended. LINASH, therefore, tries to keep the entire screening process non-invasive, pervasive, and scalable and thus could be an advantage over LFT to conduct a large population survey at any given period. FIB-4 calculator consists of the Layer-5.
The inclusion of the FIB-4 calculator has made LINASH holistic and inclusive. The FIB-4 scores lying between 1.45–3.25 recommend no requirement of biopsy, but the Lyfas test and the USG elastogram-based monitoring should continue quarterly, as the authors of this paper propose. Scores >3.25 recommend a liver biopsy to stage NASH. Therefore, LINASH is a novel, feasible, and holistic hybrid platform of Lyfas (new instrument), USG elastogram (known instrument), and FIB-4 (known instrument) to screen and stage NASH non-invasively. The authors propose that at the very initial stage, instead of blood tests, which are not only costly but also not available in the rural areas of any country, the Lyfas test, using a smartphone could be a reliable and simplistic non-invasive method. Moreover, population surveillance with blood tests is costly both time and money for the government. Lyfas IoT-enabled LINASH platform can be handy and scalable due to its pervasive nature. Patients’ data security adds an extra benefit when LINASH is used in any country-wise population [34-36].
Discussion
The paper aims to screen NAFLD and NASH using an IoT-enabled LINASH platform, non- invasively. The study observes that statistically there is not much median difference between NAFLD and NASH which can be observed in Dunn’s posthoc test where the p-value between NAFLD and NASH is 0.53, i.e., >0.05. NAFLD and NASH are overlapped, which also supports the clinical and radiological findings. Therefore, the authors suggest that NAFLD and NASH may not be viewed separately and screening must start from the NAFLD state.
The current methods of NAFLD and NASH screening, such as USG or MRI elastopgraphy are costly, non-scalable, and time-consuming. Blood tests e.g., LFT and CBC are invasive for FIB-4 scoring. Lyfas is a clinically validated, smartphonebased, IoT-enabled, and pervasive optical biomarker instrument that captures short HRV from the index finger capillaries using the phone’s camera sensor, light sources, and the technique known as arterial photoplethysmography. Using its proprietary heuristics algorithm it generates a psychophysiological snapshot (analytics) of the body within 3-5 minutes. Summarily, it captures the state of ANS homeostasis. From the short HRV, it captures 12 COBs. LF and HF are the COBs of sympathetic and parasympathetic drives, while LF/HF is a biomarker of IR, as described above. LF/HF not only has a high correlation with ALT but also has a good agreement with FIB-4, as the study observes. Therefore, instead of going for blood tests, the vulnerable population takes the Lyfas test to note the LF/HF pattern. High scores of LF/HF refer to high IR and possibilities of NAFLD or even progression to NASH in the high-risk groups. Lyfas, therefore, plays a key role in the LINASH platform. USG elastogram is also a non-invasive method that detects the stiff liver if any. A stiff liver being the sign of fibrosis mandates the FIB- 4 test followed by a requisite blood test (invasive method) for staging so that unnecessary biopsies are avoided. Therefore, LINASH is a complete end-to-end suite for NAFLD and NASH screening holistically. Lyfas is already a clinically validated instrument and is well-acknowledged in the commercial market.
To the best of the knowledge of the authors, currently, no such suite is available that can be used for the mass screening of NAFLD and NASH that has taken a shape of a tsunami. The limitation of the study lies in the accidental possibilities of sampling bias and small sample size.
Conclusion
The LINASH is a novel end-to-end suite for NAFLD and NASH screening in a larger population at any given time. Its IoT-enabled method, recommendation engines, and most importantly the smartphone-based Lyfas optical biomarker instrument could be useful to generate awareness in the population and initial screening the risk without applying any invasive method. Incorporation of FIB-4 helps in staging the NASH and deciding on the requirement of liver biopsy. This is a preliminary study to note the reliability and efficacy of LF/HF in NAFLD and NASH and the accuracy of the recommendation engines. The outcome of the study is quite encouraging to the authors to pursue a large multicentric metaanalysis.
Disclosure
The authors affirm there is no conflict of interest.
Acknowledgement
The work has no funding source
References
- Khatatbeh M, Momani W, Altaani Z, et al. Fast Food Consumption, Liver Functions, and Change in Body Weight Among University Students: A Cross-Sectional Study. Int J Prev Med. 12(2): 109 (2021).
- Eirini Martinou, Marinos Pericleous, Irena Stefanova, et al. Diagnostic Modalities of Non-Alcoholic Fatty Liver Disease: From Biochemical Biomarkers to Multi-Omics Non-Invasive Approaches. Diagnostics. 12(2): 407 (2022).
- Mahfood Haddad T, Hamdeh S, Kanmanthareddy A, et al. Nonalcoholic Fatty Liver Disease and the Risk of Clinical Cardiovascular Events: A Systematic Review and Meta-analysis. Diabetes Metab Syndr. 11(1): 209–216 (2017).
- Patrizia Burra, Chiara Becchetti, Giacomo Germani. NAFLD and Liver Transplantation: Disease Burden, Current Management and Future Challenges. JHEP Rep. 2(6): 100192 (2020).
- Amalia Gastaldelli, Kenneth Cusi. From NASH to Diabetes and from Diabetes to NASH: Mechanisms and Treatment Options. JHEP Rep. 2019; 1(4): 312-328.
- Gatineau M, Hancock C, Holman N, et al. Adult Obesity and Type 2 Diabetes. London (2014).
- Eng JM, Estall JL. Diet-Induced Models of Non-Alcoholic Fatty Liver Disease: Food for Thought on Sugar, Fat, and Cholesterol. Cells. 10(7): 1805 (2021).
- Guo X, Zheng J, Zhang S, et al. Advances in Unhealthy Nutrition and Circadian Dysregulation in Pathophysiology of NAFLD. Front Clin Diabetes Healthc. 2(1): 691828 (2021).
- Sunami Y. NASH, Fibrosis and Hepatocellular Carcinoma: Lipid Synthesis and Glutamine/Acetate Signaling. Int J Mol Sci. 21(18): 6799 (2020).
- Cheng Fang, Paul S Sidhu. Ultrasound-based Liver Elastography: Current Results and Future Perspectives. Abdom Radiol. 45(4): 3463–3472 (2020).
- Sterling RK, Lissen E, Clumeck N, et al. Development of a Simple Noninvasive Index to Predict Significant Fibrosis Patients with Hiv/Hcv Co-infection. Hepatology. 43(6): 1317-1325 (2006).
- Chopra AK. Metabolic Syndrome or Insulin Resistance: Evolution, Controversies and Association With Cardiovascular Disease Risk. J Clin Cardiol. 1(2): 77-85 (2020).
- Carnagarin R, Tan K, Adams L, et al. Metabolic Dysfunction-Associated Fatty Liver Disease (MAFLD)-A Condition Associated with Heightened Sympathetic Activation. Int J Mol Sci. 22(8): 4241 (2021).
- Sheng J, Bales NJ, Myers SA'AI, et al. The Hypothalamic-Pituitary-Adrenal Axis: Development, Programming Actions of Hormones, and Maternal-Fetal Interactions. Front Behav Neurosci. 14: 601939 (2021).
- Chattopadhyay S, Das R. Towards Corroborating the Arterial Stiffness with Lyfas Optical. Am J Biomed Sci. 14(1): 12-28 (2022).
- Khov N, Sharma A, Riley TR. Bedside Ultrasound in the Diagnosis of Nonalcoholic Fatty Liver Disease. World J Gastroenterol. 20(22): 6821–6825 (2014).
- Zhai M, Liu Z, Long J, et al. The Incidence Trends of Liver Cirrhosis Caused by Nonalcoholic Steatohepatitis via the Gbd Study 2017. Sci Rep. 11: 5195 (2021).
- Balakrishnan M. Women Have a Lower Risk of Nonalcoholic Fatty Liver Disease but Higher Risk of Nonalcoholic Fatty Liver Disease Fibrosis Than Men: Summary of the Findings of a Systematic Review and Meta-analysis. Clin Liver Dis. 18(5): 251-254 (2021).
- Akhavan Rezayat A, Tavakolizadeh Noghabi M, Hoseini B, et al. Association Between Smoking and Non-alcoholic Fatty Liver Disease: A Systematic Review and Meta-analysis. SAGE Open Med. 6(2): 2050312117745223 (2018).
- Doost Mohammadi F, Vazirinejad R, Rezaeian M, et al. Fast Food Consumption and the Risk of Non-Alcoholic Fatty Liver in Adults: A Community-Based Case-Control Study. J Occup Health. 8(4): 176-184 (2019).
- Aghakhan L, Haghighat N, Amini M, et al. The Risk Factors of Nonalcoholic Fatty Liver Disease in Morbidly Obese Patients Undergoing Bariatric Surgery in Iran. Gastroenterol Res Pract. 7(7):198 (2022).
- Dalbeni A, Castelli M, Zoncapè M, et al. Platelets in Non-alcoholic Fatty Liver Disease. Front Pharmacol. 13(2): 842636 (2022).
- Lefkowitch JH. Electron Microscopy and Other Techniques. In Scheuer P. Liver Biopsy Interpretation. Elsevier Ltd, Netherlands, United States (2016).
- Fang Liu, Hui Zhou, Lei Cao, et alet al. Risk of Reduced Platelet Counts in Patients with Nonalcoholic Fatty Liver Disease (NAFLD): A Prospective Cohort Study. Lipids Health Dis. 221 (17): 111-121 (2018).
- Cronbach LJ. Coefficient Alpha and the Internal Structure of Tests. Psychometrika. 16(8): 297–334 (1951).
- Goforth C. University of Virgina Research Data Services+Sciences. Using and Interpreting Cronbach's alpha (2015).
- Kruskal WH, Wallis WA. Use of Ranks in One-Criterion Variance Analysis. J Am Stat Assoc. 47(260): 583-621 (1952).
- Spearman C. The Proof and Measurement of Association Between Two Things. Am J Psychol. 15(1): 72–101 (1904).
- J Martin Bland, Douglas G Altman. Measuring Agreement in Method Comparison Studies. Stat Methods Med Res. 8: 135–60 (1999).
- Sakura Yamamura, Dan Nakano, Ryuki Hashida, et al. Patient-reported Outcomes in Patients with Non-alcoholic Fatty Liver Disease: A Narrative Review of Chronic Liver Disease Questionnaire-non-alcoholic Fatty Liver Disease/Non-alcoholic Steatohepatitis. J Gastroenterol Hepatol. 36(3): 629-636 (2021).
- Subhagata Chattopadhyay, Rupam Das. Comparing Heart Rate Variability with Polar H10 Sensor and Pulse Rate Variability with LYFAS: A Novel Study. J Biomed Eng. 9(1): 1-9 (2021).
- Subhagata Chattopadhyay, Rupam Das. Lyfas, A Smartphone-Based Subclinical Depression Tracker. Int J Psychiatr Res. 4(6): 1-9 (2021).
- Subhagata Chattopadhyay, Rupam Das. Statistical Validation of Cardiovascular Digital Biomarkers towards Monitoring the Cardiac Risk in COPD: A Lyfas Case Study. Artif Intell Evol. 3(1): 1-16 (2022).
- Subhagata Chattopadhyay, Rupam Das. Towards Digital Phenotyping of Hypertension-anger-anxiety Triad Using Lyfas, a Smartphone-based Non-invasive Biomarker Detecting Tool. Psychiatry. 12(4): 12-22 (2022).
- Subhagata Chattopadhyay, Rupam Das. Validating Lyfas as a Reliable Mental Health Screening and Monitoring Instrument: A Step Towards Mobile Health Application During COVID-19 Pandemic. Med Res Arch. 10(3): 1-20 (2022).
- Deepa HS, Das R. Evaluation of Non-invasive Smartphone Based Digital Biomarker Tool Lyfas in Detecting Sleep Deficiency and Its Effects: A Retrospective Observational Study. Indian J Appl Res. 11(1): 46-47 (2021).
