Research Article - Neuropsychiatry (2018) Volume 8, Issue 6
Microstructural Changes in the Brain after Acute Alcohol Intoxication Accompanied by Diffuse Axonal Injury in Rats: Assessed In Vivo Using Diffusion Kurtosis Imaging
- Corresponding Author:
- Wenbin Zheng
Department of Radiology, The Second Affliated Hospital, Medical College of Shantou University, Shantou 515041, China
Tel: +86 754 88915717
Fax: +86 754 83141198
Abstract
To utilize brain diffusion kurtosis imaging (DKI) in rats with acute alcohol intoxication accompanied by diffuse axonal injury (DAI) under high magnetic field 7.0T magnetic resonance imaging (MRI) and evaluate the impact of alcohol on DAI. Thirty male Sprague- Dawley rats were randomly divided into normal control (N-group), pure DAI (T-group), and acute alcohol intoxication accompanied by DAI (AT-group) groups. Two hours after in vivo modeling, each animal underwent magnetic resonance DKI, followed by decapitation and pathological examination of the brain. Compared with the N-group, the mean kurtosis (MK) values in the frontal lobe, hippocampus, and thalamus of the T-group and AT-group were significantly elevated (P < 0.01). The fractional anisotropy (FA) values in the frontal lobe, hippocampus, and thalamus of the T-group and AT-group were significant reduced (except for the hippocampus of the T-group). However, the mean diffusivity (MD) values of the T-group and AT-group were higher than that of the N-group, but no statistically significant difference was found between the AT-group and N-group. Compared with the T-group, the MK value of the AT-group was significantly elevated (P < 0.01 in the hippocampus and thalamus). Significant differences were also found in the decreased FA value in the hippocampus and in the decreased MD values between the T-group and AT-group. Hematoxylin and eosin staining showed significant abnormal morphological changes in rats of the AT group. DKI can detect microstructural changes in brain tissues associated with acute alcohol intoxication accompanied by DAI. MK value provides a more comprehensive and detailed assessment of severity of brain injury and is a powerful complement to DTI. Acute alcohol intoxication might worsen pathophysiological changes of brain tissues after DAI.
Keywords
Diffusion kurtosis imaging, Magnetic resonance imaging, Alcohol intoxication, Diffuse Axonal Injury
Introduction
In recent years, the incidence of acute alcohol intoxication accompanied by craniocerebral trauma has increased. Diffuse axonal injury (DAI) is a common type of closed head injury and is often found in patients with blunt head trauma caused by twisted or overstretched nerve fibers, which results in nerve fiber fracture and primary axonal injury [1-3]. Patients with DAI immediately enter a coma, sustain changes during the coma, and have severe damage and disability. Alcohol, as a lipid soluble substance, rapidly affects cell functions through the neurilemma of the brain and binds to lecithin and deposits in brain tissue, which generate long-lasting neurotoxic side effects in the central nervous system [4,5]. Acute alcohol consumption can lead to falls, fights, and traffic accidents, resulting in an increased risk of trauma. Current findings in defining whether alcohol intoxication is a severe traumatic brain injury remain inconsistent [6,7].
Conventional imaging examinations, such as computed tomography (CT) and magnetic resonance imaging (MRI), can directly and objectively detect abnormal signals of brain injury to a certain degree. However, such morphological changes are often inconsistent with clinical severity. In addition, morphological changes due to occult injury cannot be observed during early stages of brain injury [8].
In previous studies, quantitative analysis of changes in apparent diffusion coefficient and fractional anisotropy (FA) values obtained from diffusion tensor imaging (DTI) in different brain regions of subjects with acute alcohol intoxication accompanied by DAI could detect changes in microstructure of the brain that were not detected by conventional imaging [9]. However, the theoretical premise of DTI is based on a normal distribution of water molecule diffusion that would be described by a Gaussian distribution model [10]. However, structures of most biological tissues are complex and do not conform to a Gaussian distribution, which indicates that DTI is limited by complex tissue structure, especially in brain tissue. Some of these limitations can be resolved by diffusion kurtosis imaging (DKI), which is an extension that is based on the DTI technique. DKI can reflect the non-Gaussian distribution of water molecule diffusion and identify abnormal microstructural changes in the brain that cannot be detected by DTI. DKI plays an important role in detection of abnormal structure in gray matter [11-13]. This study simulated the application of high magnetic field 7.0T MRI through DKI in rat models of DAI and alcohol intoxication accompanied by DAI. Taken together with the pathological results, this study provides a more intuitive imaging basis to clarify changes in microstructure of the brain that occur after DAI and alcohol intoxication accompanied by DAI.
Experimental Materials and Methods
▪ Animal modeling
Thirty healthy male Sprague-Dawley rats weighing 250–300 g were provided by the Laboratory Animal Center of Shantou University Medical College (Guangdong, China) and were maintained under standard laboratory conditions with 12-hour light/dark cycles. After one week of stabilization on an ad lib diet, rats were randomly divided into 3 groups with 10 rats per group: normal control (N-group), pure DAI (T-group), and acute alcohol intoxication accompanied by DAI (AT-group). Rats in the AT group received a single intragastric administration of 15 mL/kg 56% v/v Red Star Erguotou white liquor (Beijing, China) to model acute alcohol intoxication,which showed increased lactic acid in the brain and decreased organ blood flow in the high-dose animal models, as well as increased brain edema and negative effects on neurobehavioral function and microstructure [14,15]. DAI modeling in rats of the AT-group and T-group was conducted in accordance with the Marmarou mode [16]. All procedures of animal treatments followed the guidelines issued by National Institute of Health and this study was approved by the Animal Ethics Committee of Shantou University of Traditional Chinese Medicine (SUMC-2015-036).
▪ Scanning devices and methods
All rats were anesthetized with 4% isoflurane mixed with 1 L/min oxygen and maintained with 2% isoflurane mixed with 1 L/min oxygen during the prone position MRI. Real-time observation of respiration was performed throughout the entire procedure to ensure that breathing was maintained at approximately 50–60/min. MRI scans were performed on an Agilent 7T/160 mm animal MR scanner (Agilent VnmrJ 3 Imaging, USA) which used a single-channel body coil as transmitter and receiver coils. Diffusion kurtosis imaging was obtained with a fast spin echo multislice (FSEMS) sequence, together with a TR/TE of 2000/36 ms,field of view = 30mm×30mm, 5 slices, slice thickness/ gap = 2.0/0.2mm, 2 averages, 4 shots and 16 kzero. Two b-values (1000 s/mm2 and 2000 s/ mm2) were applied to 30 directions following acquisition of the image at b = 0 s/mm2. The average duration time for the DKI scan was approximately 33min7s.
▪ Histological staining
After all images were acquired, rats were immediately sacrificed for histology,the left ventricle of each animal was immediately perfused with 4% paraformaldehyde. This was followed by rapid collection of brain tissue, which was postfixed in 4% neutral paraformaldehyde for 24 h. Each brain was divided equally into 2 hemispheres along the sagittal plane. Three brain regions, including the frontal lobe, hippocampus, and thalamus were isolated from the brain hemisphere. This was followed by dehydrating, clearing, and paraffin-embedding before serial sectioning the tissue blocks into 4 μm thick sections. After drying the tissue slices on glass slides in an oven, they were stained with hematoxylin and eosin.
▪ Data processing
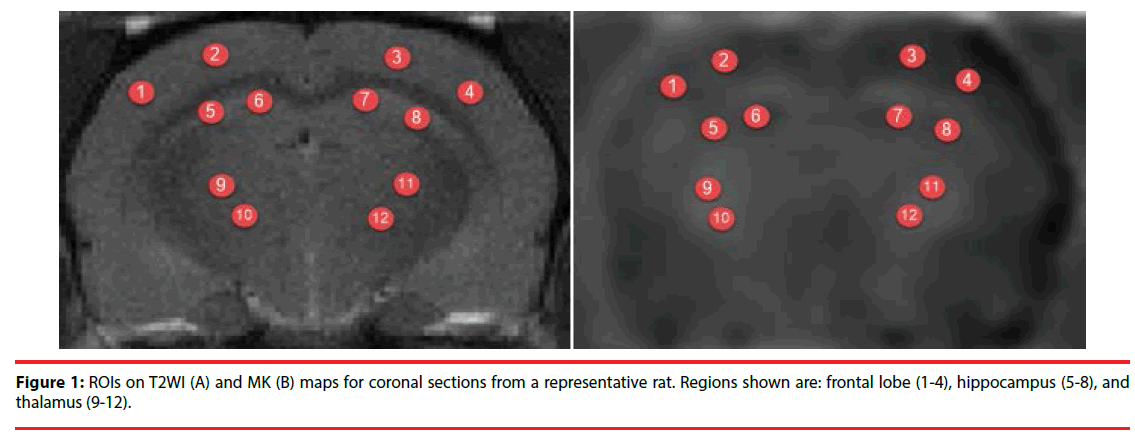
Images were analyzed in MATLAB (The Mathworks, Natick, MA, USA) and MRIcro software (Neuropsychology Lab, Columbia, SC, USA). Regions of interest (ROIs) included the frontal lobe, hippocampus, and thalamus. The average MK, FA, and MD values were calculated bilaterally on the left and right sides in the ROIs (Figure 1). Every ROI was tested four times to obtain the mean value and every region of interest was about 5 mm2.
▪ Statistical analysis
Each of the measured parameters (MD, FA, and MK) was expressed as mean ± standard deviation. Data analysis was conducted using SPSS 17.0 (SPSS Inc., Chicago, IL, USA) with a one-way ANOVA to compare groups. A level of p < 0.05 was considered statistically significant.
Results
▪ MRI results
Brain tissue structure of the T2-weighted images N-group clearly showed a good ratio of gray and white matter. The ratios of gray and white matter in brain tissues of the T-group and ATgroup were slightly obscure, but no significant abnormal signal lesion was found. Long T2 signal scalp hematomas were found on top of the scalp in part of the T- group and AT-group rats.
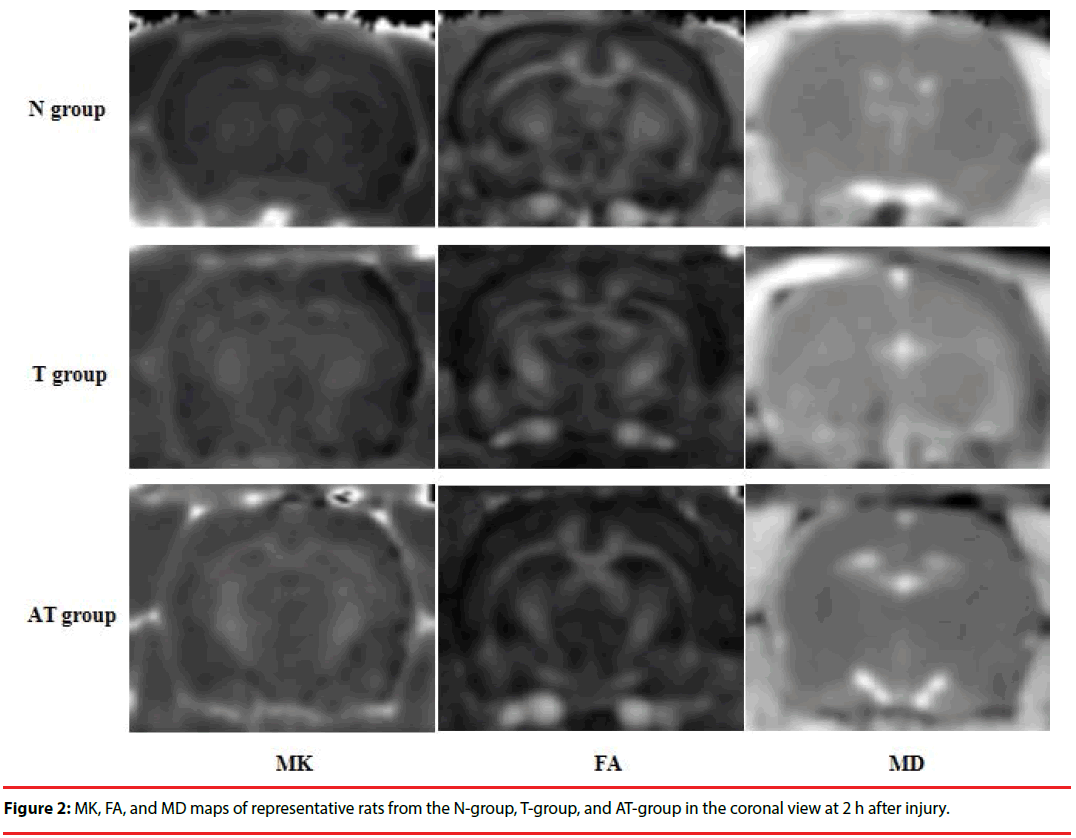
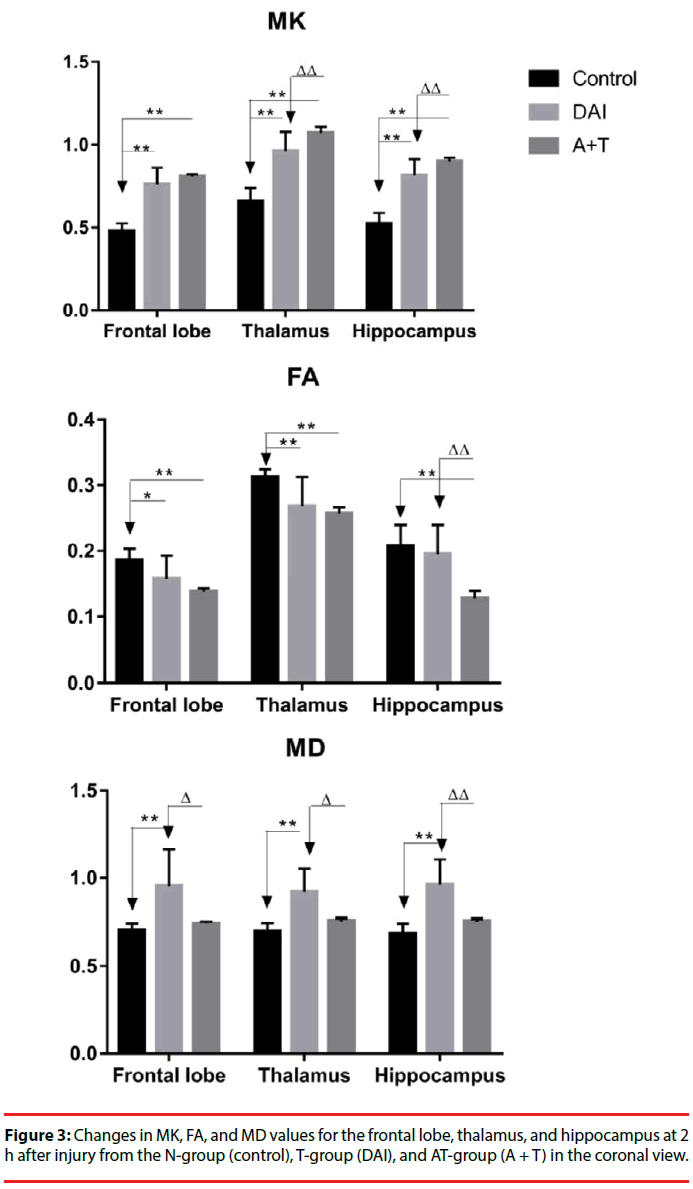
Compared with the N-group, the MK, FA, and MD maps of the T-group and AT-group after DKI showed abnormal signal lesions (Figure 2). As shown in Figure 3 and Table 1, statistical analysis of the detected MK, FA, and MD values in the frontal lobe, hippocampus, and thalamus showed that MK values of the frontal lobe, hippocampus, and thalamus of the T-group and AT-group were significantly higher than those of the N-group (P < 0.01). The MK values increased by 59%, 56%, and 46% in the frontal lobe, hippocampus, and thalamus, respectively, in the T-group, while these increases were more significant in the AT-group in which the MK values increased by 69%, 72%, and 63%, respectively. The MK values of the hippocampus (10%) and thalamus (11%) in the AT-group were significantly higher than in the T-group (P < 0.01). Although the MK value of the frontal lobe in the AT-group was 6% higher than in the T-group, no statistically significant difference was found (P > 0.05).
| ROI | DKI Values | N group (N=10) | T group (N=10) | AT group (N=10) |
|---|---|---|---|---|
| Frontal lobe | MK | 0.479±0.45 | 0.762±0.098 | 0.808±0.014 |
| FA | 0.186±0.018 | 0.158±0.035 | 0.138±0.005 | |
| MD | 0.704±0.041 | 0.954±0.363 | 0.745±0.010 | |
| MK | 0.658±0.081 | 0.962±0.116 | 1.070±0.038 | |
| Thalamus | FA | 0.313±0.012 | 0.268±0.045 | 0.257±0.010 |
| MD | 0.698±0.050 | 0.922±0.267 | 0.758±0.015 | |
| MK | 0.522±0.066 | 0.816±0.097 | 0.899±0.023 | |
| Hippocampus | FA | 0.208±0.032 | 0.195±0.045 | 0.128±0.011 |
| MD | 0.688±0.056 | 0.962±0.319 | 0.757±0.013 |
Table 1: Comparisons of MK, FA, and MD values in the frontal lobe, thalamus, and hippocampus between the N-group, T-group, and AT-group (mean fronta).
Compared with the N-group, FA values of the frontal lobe, hippocampus, and thalamus in the T-group were reduced by 15%, 6%, and 14%, respectively, but no statistically significant difference was found in the hippocampus (P < 0.05 in the frontal lobe; P > 0.05 in the hippocampus; P < 0.01 in the thalamus). Reduction of FA values of different brain regions in the AT-group was more significant, decreasing by approximately 26%, 38%, and 18% in the frontal lobe, hippocampus, and thalamus, respectively (P < 0.01). Compared with the T-group, significant reduction of the FA value was only found in the hippocampus of the ATgroup (34% reduction, P < 0.01), while no significant reductions were found in the frontal lobe and thalamus of the 2 groups.
MD values in different brain regions of the T-group and AT-group were higher than those of the N-group. Significant increases of MD values were found in the frontal lobe, hippocampus, and thalamus, with increases of 36%, 40%, and 32%, respectively, in the T-group (P < 0.01). Although the MD values of the frontal lobe, hippocampus, and thalamus in the AT-group increase by 6%, 10%, and 9%, respectively, no statistically significant difference was found between the N-group and AT-group (P > 0.05). MD values of the rat frontal lobe, hippocampus, and thalamus in the AT-group were 22%, 21%, and 18%, respectively, lower than those of the T-group (P < 0.05 in the frontal lobe and thalamus; P < 0.01 in the hippocampus).
▪ Results of pathological examination
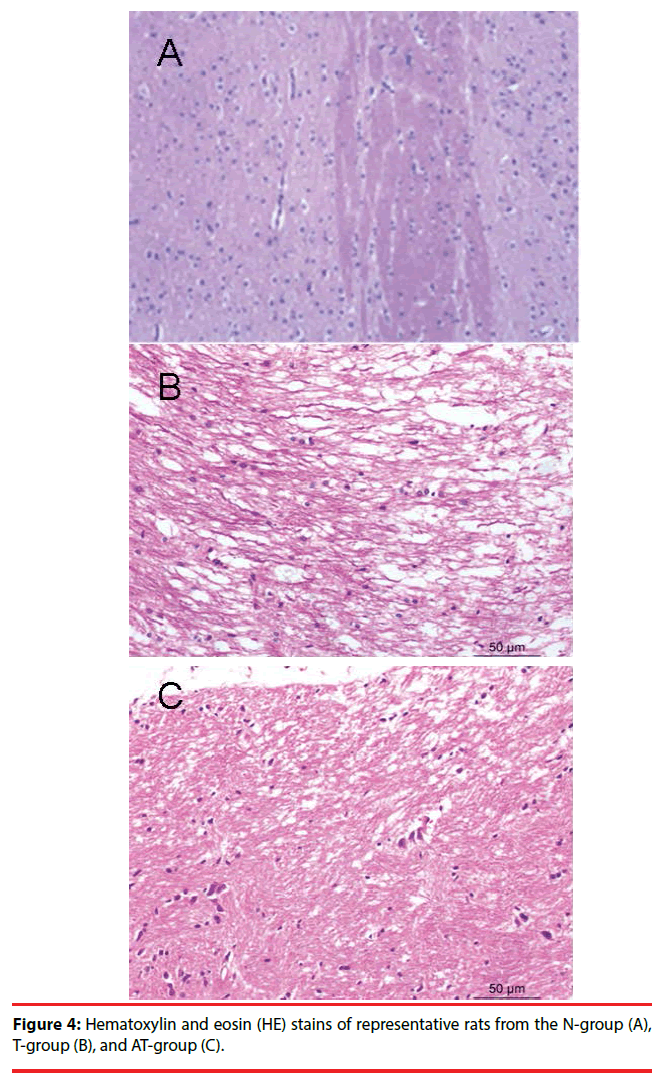
Nerve cells of the N-group were well arranged with clear boundaries between cells and cytoplasmic staining. Nuclear staining of nerve cells in the N-group was moderate, with no widened spaces around blood vessels (Figure 4A).
Neurons and glial cells of the T-group were swollen, with a scattered arrangement and light nuclear staining. Some of the cells were scattered on a patchy subarachnoid hemorrhage, with a loose axonal structure, fractures in some nerve fibers, collapse of the surrounding vascular lumen, endothelial shrinkage, and expansion of extracellular space (Figure 4B). These morphological changes were also observed in the AT-group where they were more significant than in the T-group (Figure 4C).
Discussion
When acute alcohol intoxication is accompanied by brain trauma, the brain exhibits cerebral ischemia and hypoxia as well as damage to the blood-brain barrier [17-19]. Zink et al. showed that compared with patients who had pure brain trauma, patients with acute alcohol intoxication accompanied by brain trauma had significantly lower mean arterial blood and intracranial pressures as well as an increase in lactic acid in tissues and veins of the brain, which resulted in a significant decline in cerebral blood flow. Atrial blood gas analysis demonstrated that the relative decline in pH, PaO2 and HCO3- reflects an inhibition of respiratory function, resulting in more severe brain ischemia and hypoxia [20,21]. In addition, mechanical damage can lead disruption of the blood-brain barrier. This increases vascular permeability, which then increases the concentration of plasma proteins in the extracellular space and limits diffusion of water molecules. Mechanical damage can also lead to mitochondrial dysfunction, which can cause impaired energy metabolism and calcium ion overload [22]. Cerebral ischemia and hypoxia caused by brain trauma can lead to an oxidative stress reaction in brain tissue, which can cause release of glutamate, lactate, H+, K+, Ca2+, nitric oxide, as well as arachidonic acid and its metabolites [23,24]. Studies have shown that alcohol and its metabolites can produce large amounts of hydroxyl free radicals, resulting in more intense oxidative stress after brain trauma as well as limited water diffusion [25,26]. Cerebral edema, demyelination, axonal structural damage, transport barriers, and release of proinflammatory factors caused by acute alcohol intoxication accompanied by DAI [9,27-29] significantly increase the complexity of brain tissue structure in the region of interest. In a previous DTI study, one of the common indicators used was MD, which mainly represents average diffusion motion of a water molecule per unit of time and reflects the state of intracellular water homeostasis [30]. A reduction of the MD value represents cytotoxic cerebral edema, while an elevation of the MD value represents vasogenic cerebral edema [14,31,32].
This study used DKI and found that MD values of the rats with pure DAI were significantly higher than those of the normal control rats, indicating that the brain injuries mainly played a role in vasogenic cerebral edema [9]. However, no significant elevation of MD values was found in the rats with acute alcohol intoxication and DAI. In addition, the MD values of the ATgroup were significantly lower than those of the T-group. This might have been due to increased severity of brain ischemia and hypoxia induced by alcohol [33]. Since alcohol is the main cause of cytotoxic cerebral edema [14,32], its dual roles lead to a gradual transition of brain tissues from vasogenic cerebral edema to cytotoxic cerebral edema. Therefore, the change of MD values in rats of the AT-group was mainly associated with coexistence of the 2 types of cerebral edema and domination of vasogenic cerebral edema, which suggests that alcohol increased the severity of cerebral edema after DAI and made treatment more complicated.
The other parameter of DKI, FA value, is a measure of anisotropy and integrity of white matter and is positively correlated with myelin integrity and fiber density. A decrease in FA value is associated with neuronal loss and demyelination [34]. Studies have shown that the level of decrease in FA value is closely associated with the severity of DAI [35,36]. In this study, FA values of the T-group and AT-group were significantly lower than those of the N-group. Compared with the T-group, the decrease in FA values in the hippocampus of the AT-group was more significant, while no significant decrease of FA value was found in the frontal lobe and thalamus of the AT-group. Thus, our results, to some extent, showed that acute alcohol intoxication led to more severe brain damage.
The MK value is the most important parameter of DKI and indicates the mean value of diffusion kurtosis in all gradient directions. The magnitude of the MK value is determined by structural complexity of tissue in the region of interest. An increase in complexity of tissue structure increases the significance of limited non-normal distribution of water diffusion and leads to a higher MK value [10,11,36]. In this study, compared with the N-group, MK values were significantly increased in the rats with DAI, regardless of whether or not they were subjected to acute alcohol intoxication. The increase in MK value was more significant in the AT-group than in the T-group. After traumatic brain injury, the brain parenchyma undergoes a series of complex processes including apoptosis and necrosis, microtubule degradation, cellular edema, demyelination, axonal rupture, secondary inflammatory exudation, edema, and cell death [2,3,37]. These complex nerve cells demonstrate morphological and microscopic changes in brain tissue because of brain injury. However, DTI only reflects a single imaging feature such as in cerebral edema and axonal injury. In contrast, MK value, the important parameter of DKI, can demonstrate microstructural changes in brain tissues caused by the complex processes described above and changes of signal and numerical values in MRI.
Conclusions
DKI can detect microstructural changes in brain tissues associated with acute alcohol intoxication accompanied by DAI. As related indicators of DTI, FA and MD values may underestimate severity of brain injury. In contrast, MK value provides a more comprehensive and detailed assessment of severity of brain injury and is a powerful complement to DTI. Finally, acute alcohol intoxication might worsen pathophysiological changes of brain tissues after DAI.
Competing Interests
The authors declare that they have no competing interests.
Acknowledgments
We thank the members of the Medical Imaging Training Center of Shantou University Medical College for their assistance. This project was supported by National Natural Science Foundation of China (grant No. 81571627, WB Zheng), the Natural Science Foundation of Guangdong Province, China (grant No. 2014A030313481, WB Zheng), Characteristic Innovation Project of Ordinary University of Guangdong Province, China (grant No.922-38040223 and 923- 38040404, WB Zheng).
References
- Lee H, Wintermark M, Gean AD, et al. Focal lesions in acute mild traumatic brain injury and neurocognitive outcome: CT versus 3T MRI. J. Neurotrauma 25(9), 1049-1056 (2008).
- Kong LM, Lian GP, Zheng WB, et al. Effect of alcohol on diffuse axonal injury in rat brainstem: diffusion tensor imaging and aquaporin-4 expression study. Biomed. Res. Int 2013, 798261 (2013).
- Hui ES, Cheung MM, Chan KC, et al. B-value dependence of DTI quantitation and sensitivity in detecting neural tissue changes. Neuroimage 49(3), 2366-2374 (2010).
- Hori M, Fukunaga I, Masutani Y, et al. Visualizing non-Gaussian diffusion: clinical application of q-space imaging and diffusional kurtosis imaging of the brain and spine. Magn. Reson. Med. Sci 11(4), 221-233 (2012).
- Jensen JH, Helpern JA. MRI quantification of non-Gaussian water diffusion by kurtosis analysis. NMR. Biomed 23(7), 698-710 (2010).
- Jensen JH, Helpern JA, Ramani A, et al. Diffusional kurtosis imaging: the quantification of non-gaussian water diffusion by means of magnetic resonance imaging. Magn. Reson. Med 53(6), 1432-1440 (2005).
- Liu HM, Zheng WB, Yan G, et al. Acute ethanol-induced changes in edema and metabolite concentrations in rat brain. Biomed. Res. Int 2014, 351903 (2014).
- Ding JY, Kreipke CW, Speirs SL, et al. Hypoxia-inducible factor-1alpha signaling in aquaporin upregulation after traumatic brain injury. Neurosci. Lett 453(1), 68-72 (2009).
- Meythaler JM, Peduzzi JD, Eleftheriou E, et al. Current concepts: diffuse axonal injury-associated traumatic brain injury. Arch. Phys. Med. Rehabil 82(10), 1461-1471 (2001).
- Johnson VE, Stewart W, Smith DH. Axonal pathology in traumatic brain injury. Exp. Neurol 246, 35-43 (2013).
- Lin Y, Wen L. Inflammatory response following diffuse axonal injury. Int. J. Med. Sci 10(5), 515-521 (2013).
- Sun C, Shen L, Li X, et al. Risk of pneumonia in central nervous system injury with alcohol intake: a meta-analysis. Int. J. Clin. Exp. Med 8(9), 15738-15744 (2015).
- Field M, Wiers RW, Christiansen P, et al. Acute alcohol effects on inhibitory control and implicit cognition: implications for loss of control over drinking. Alcohol. Clin. Exp. Res 34(8), 1346-1352 (2010).
- Opreanu RC, Kuhn D, Basson MD. Influence of alcohol on mortality in traumatic brain injury. J Am Coll Surg 210(6), 997-1007 (2010).
- Chen XR, Zeng JY, Shen ZW, et al. Diffusion Kurtosis Imaging Detects Microstructural Changes in the Brain after Acute Alcohol Intoxication in Rats. Biomed. Res. Int 2017, 4757025 (2017).
- Molina PE, Katz PS, Souza-Smith F, et al. Alcohol's Burden on Immunity Following Burn, Hemorrhagic Shock, or Traumatic Brain Injury. Alcohol. Res 37(2), 263-278 (2015).
- van de Looij Y, Mauconduit F, Beaumont M, et al. Diffusion tensor imaging of diffuse axonal injury in a rat brain trauma model. NMR. Biomed 25(1), 93-103 (2012).
- Cernak I, Vink R, Zapple DN, et al. The pathobiology of moderate diffuse traumatic brain injury as identified using a new experimental model of injury in rats. Neurobiol. Dis 17(1), 29-43 (2004).
- Kong LM, Zheng WB, Lian GP, et al. Acute effects of alcohol on the human brain: diffusion tensor imaging study. AJNR. Am. J. Neuroradiol 33(5), 928-934 (2012).
- Zink BJ, Walsh RF, Feustel PJ. Effects of ethanol in traumatic brain injury. J. Neurotrauma 10(3), 275-286 (1993).
- Mukherjee P, McKinstry RC. Diffusion tensor imaging and tractography of human brain development. Neuroimaging. Clin. N. Am 16(1), 19-43, vii (2006).
- Rutgers DR, Fillard P, Paradot G, et al. Diffusion tensor imaging characteristics of the corpus callosum in mild, moderate, and severe traumatic brain injury. AJNR. Am. J. Neuroradiol 29(9), 1730-1735 (2008).
- Hong JH, Kim OL, Kim SH, et al. Cerebellar peduncle injury in patients with ataxia following diffuse axonal injury. Brain. Res. Bull 80(1-2), 30-35 (2009).
- Wu EX, Cheung MM. MR diffusion kurtosis imaging for neural tissue characterization. NMR. Biomed 23(7), 836-848 (2010).
- Greve MW, Zink BJ. Pathophysiology of traumatic brain injury. Mt. Sinai. J. Med 76(2), 97-104 (2009).
- Alexander S, Kerr ME, Yonas H, et al. The effects of admission alcohol level on cerebral blood flow and outcomes after severe traumatic brain injury. J. Neurotrauma 21(5), 575-583 (2004).
- Taylor B, Irving HM, Kanteres F, et al. The more you drink, the harder you fall: a systematic review and meta-analysis of how acute alcohol consumption and injury or collision risk increase together. Drug Alcohol Depend 110(1-2), 108-116 (2010).
- Tien HC, Tremblay LN, Rizoli SB, et al. Association between alcohol and mortality in patients with severe traumatic head injury. Arch. Surg 141(12), 1185-1191; discussion 1192 (2006).
- Zink BJ, Schultz CH, Wang X, et al. Effects of ethanol on brain lactate in experimental traumatic brain injury with hemorrhagic shock. Brain. Res 837(1-2), 1-7 (1999).
- Robertson CL. Mitochondrial dysfunction contributes to cell death following traumatic brain injury in adult and immature animals. J. Bioenerg. Biomembr 36(4), 363-368 (2004).
- Tyurin VA, Tyurina YY, Borisenko GG, et al. Oxidative stress following traumatic brain injury in rats: quantitation of biomarkers and detection of free radical intermediates. J. Neurochem 75(5), 2178-2189 (2000).
- Awasthi D, Church DF, Torbati D, et al. Oxidative stress following traumatic brain injury in rats. Surg. Neurol 47(6), 575-581; discussion 581-572 (1997).
- Ibrahim M, Hassan W, Meinerz DF, et al. Ethanol-induced oxidative stress: the role of binaphthyl diselenide as a potent antioxidant. Biol. Trace. Elem. Res 147(1-3), 309-314 (2012).
- Zima T, Fialova L, Mestek O, et al. Oxidative stress, metabolism of ethanol and alcohol-related diseases. J. Biomed. Sci 8(1), 59-70 (2001).
- Gottesfeld Z, Moore AN, Dash PK. Acute ethanol intake attenuates inflammatory cytokines after brain injury in rats: a possible role for corticosterone. J. Neurotrauma 19(3), 317-326 (2002).
- Yamakami I, Vink R, Faden AI, et al. Effects of acute ethanol intoxication on experimental brain injury in the rat: neurobehavioral and phosphorus-31 nuclear magnetic resonance spectroscopy studies. J Neurosurg 82(5), 813-821 (1995).
- Siedler DG, Chuah MI, Kirkcaldie MT, et al. Diffuse axonal injury in brain trauma: insights from alterations in neurofilaments. Front. Cell. Neurosci 8, 429 (2014).
