Research Article - Clinical Practice (2017) Volume 14, Issue 2
Monitoring of myocutaneous flaps by intracapillary glucose and lactate measurements: experimental study
- Corresponding Author:
- Guillier David
CHU Dijon, Department of Plastic Reconstructive and Hand Surgery
Department of Oral and Maxillofacial Surgery
University Hospital, Dijon
France E-mail: docteurguillierdavid@gmail.com
Abstract
Introduction: In surgery, some defects require reconstruction with microsurgical flap. The free flap failure rate varies between 2% and 5% with severe. Vascular thrombosis is the most frequent complication and represents 15-73%. The success rate of salvage therapy is greater when salvage surgery is early. Currently clinical monitoring is the gold standard. Many non-invasive or minimally invasive techniques have been developed to improve early diagnosis of complications of vascular thrombosis. Each technique has advantages and disadvantages. The aim of our experimental study was to compare the clinical assessment and intracapillary glycemia and lactataemia measurements during monitoring of free flaps. Material and methods: Pigs (Sus scrofa domesticus) were operated under general anesthesia. A myocutaneous latissimus dorsi with skin paddle was performed. Each animal was operated twice (right and left) similarly. 4 groups were made: Group 1 (no flap ligature or control group); Group 2 (flap with final ligation of the artery); Group 3 (flap with final ligation of the two veins); Group 4 (flap with transient ligature of the artery and two veins for 1 hour). An incision was made in the center of the skin paddle to make the measurements. Postoperative monitoring protocol consisted of a triple monitoring: clinical, biological and histological. Results: Eight animals were operated and sixteen flaps were realized. Each flap was clinically and biologically tested 25 times. Clinical, biological and histological monitoring showed significant variations according to the groups. Discussion-Conclusion: Experimentally the intra-capillary measures of lactate and glucose levels associated with clinical monitoring may shorten the delay in diagnosis. Ultimately this will save lives and achieve better functional and aesthetic resultsd.
Keywords
experimentation, glucose, lactate, microsurgery, monitoring, thrombosis
Introduction
In surgery, some defects require reconstruction with microsurgical flap. This type of reconstruction requires a patient in good general condition. The free flap failure rate varies between 2% and 5% [1,2]. There are multiple causes: infection, dehiscence of sutures, compression or vascular thrombosis. Vascular thrombosis are the most frequent complications and represent 15-73% [3-5]. The majority of these complications occurred within the first 24 postoperative hours. The salvage rate of postoperative vascular complications is between 0 and 100% [2,6-11]. The consequences of failure are often severe: higher risk of death, delay of combination therapy (radiotherapy, chemotherapy), functional sequelae, aesthetic results, psychological and social effects.
The success rate is greater when salvage surgery is early [12]. It is therefore essential to detect as soon as possible arterial or venous thrombosis [1,2]. Currently clinical monitoring is the gold standard. It is based on color, capillary refill time and local heat of the flap. Many noninvasive or minimally invasive techniques have been developed to improve early diagnosis of complications of vascular thrombosis. Each technique has advantages and disadvantages.
The aim of our experimental study was to compare the clinical assessment and intracapillary glucose and lactate measurements during monitoring of free flaps.
Material and methods
The study was conducted in an approved center specializing in the care of the animals and was approved by an ethics committee. The pig (Sus scrofa domesticus), about 25 kg, was retained.
Anesthetic protocol
Each animal was sedated by intramuscular injection (200 mg ketamine and acepromazine 5 mg) before prone installation. Induction was performed by intravenous (propofol 50 mg). The intubation was orotracheal. Ventilation was provided by halogenated inhalational anesthetics (isoflurane) to provide a frequency of 20-25 cycles/minute. Intraoperative analgesia was provided by the sufentanyl.
Surgical protocol
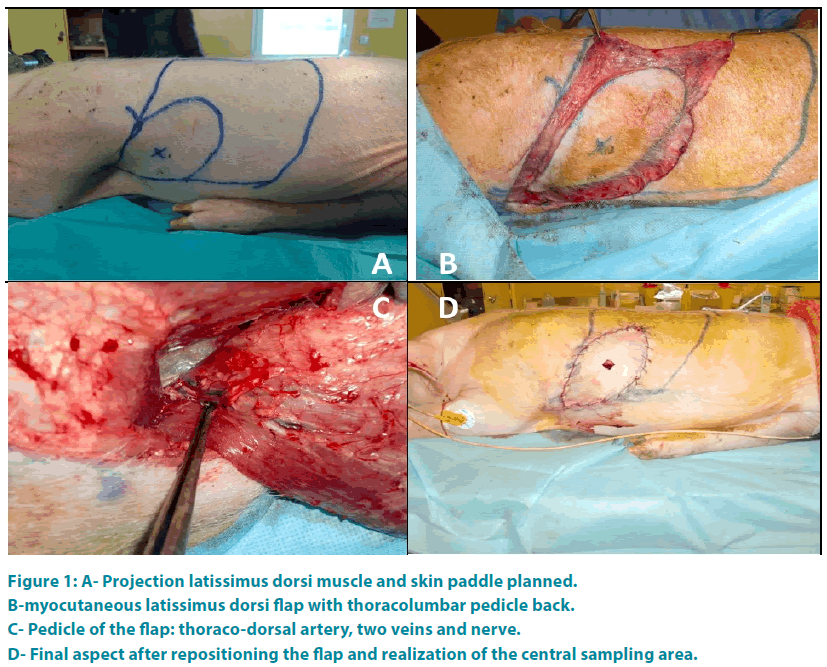
For each animal the intervention a myocutaneous latissimus dorsi flap was realized. First the olecranon and the lower edge of the scapula were spotted. Then a line through the middle of these two points and parallel to the thoracic spine defines the anterior border of latissimus dorsi. The neurovascular pedicle is situated 0.5 cm to 1 cm behind this line. The upper border of the muscle was represented by the line connecting the olecranon to the thoracic spine and passing through the tip of the scapula. The posterior border of the muscle was defined by a line parallel to the first line and 1cm outside to the spinous processes of the thoracic spine. A line perpendicular to the previous limit represented the lower border of the muscle. The shape of the skin paddle was oval (FIGURE 1A). Then the flap was taken from distal to proximal (FIGURE 1B) preserving the main vascular pedicle located in the deep surface of the muscle. Once the flap is raised, artery and vein were individualized (FIGURE 1C) and the tendon of the muscle cut.
Figure 1: A- Projection latissimus dorsi muscle and skin paddle planned.
B-myocutaneous latissimus dorsi flap with thoracolumbar pedicle back.
C- Pedicle of the flap: thoraco-dorsal artery, two veins and nerve.
D- Final aspect after repositioning the flap and realization of the central sampling area.
Each animal was operated twice (right and left) similarly.
4 groups were made:
- Group 1: no flap ligature or control group;
- Group 2: flap with final ligation of the artery;
- Group 3: flap with final ligation of the two veins;
- Group 4: flap with transient ligature of the artery and two veins for 1 hour.
An incision was made in the center of the skin paddle to make the measurements (FIGURE 1D).
Postoperative care
Extubation was performed in the animal’s box. Proper nutrition was issued. Analgesics (Tramadol) and anesthetic (ketamine) were administered.
Postoperative monitoring protocol
Postoperative monitoring protocol consisted of a triple monitoring: clinical, biological and histological. The observer did not know the flap’s group. H0 is the time corresponding to the time of the first evaluation at the end of surgical procedure.
Clinical monitoring included: bleeding (no bleeding, bleeding type (arterial or venous)) and the status of the skin paddle with appearance (normal, venous, ischemic or congestive) and the skin refill time (normal equal to 3 seconds, venous if less than or equal to 2 seconds, ischemia if greater than or equal to 4 seconds). Clinical monitoring was performed every hour for 24 hours.
Biological monitoring consisted of:
- intracapillary measurements of glucose (mmol/l) from the central incision by Accu- Check® Performa (Roche® Manheim, Germany);
-intracapillary measurements lactate (mmol/l) from the central incision Lactate-ProTM® (ARKRAY Amstelveen, Netherlands).
Biological monitoring was performed every hour for 24 hours.
Histological monitoring was carried out at the third hour (H3), sixth hour (H6) and twentyfourth hour (H24) after a myocutaneous sampling of the center of each skin paddle. The specimen were fixed in formalin and analyzed microscopically after staining with hematoxylineosin- saffron (HES).
Statistical analysis
Statistical analysis was performed using the software STATA®13 (StataCorp®, Texas, USA). The evolution of kinetics of lactate and glucose was evaluated by analysis of variance. A difference was statistically significant if p<0.05.
2End of protocol
Each animal was euthanized at the twenty-fifth time (H25).
Results
Eight animals were operated on a 4-day period. The mean operative time was 71.9 minutes (60- 85 minutes). No animal died during the study. No complication was notified.
Sixteen flaps were realized and distributed as follows:
- Group 1 (without ligation): 5 flaps;
- Group 2 (final ligation of the artery): 2 flaps;
- Group 3 (final ligation of the two veins): 5 flaps;
- Group 4 (transient ligation for 1 hour of the artery and the two veins): 4 flaps.
Clinical monitoring
Each flap was clinically tested 25 times.
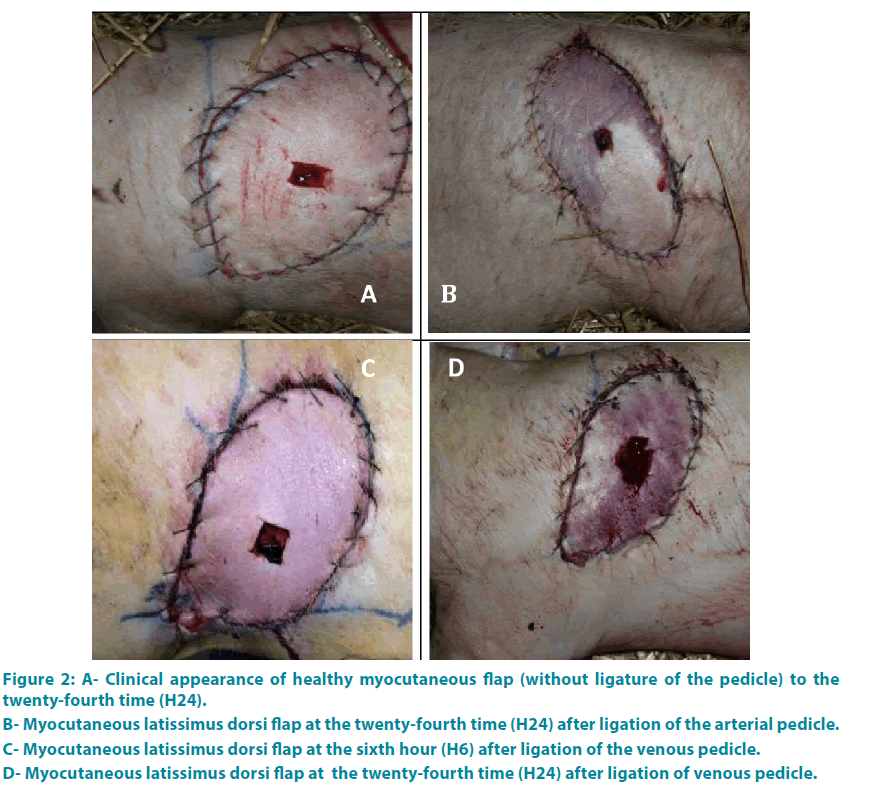
Group 1: Each flap has presented a healthy character until the end of the study (FIGURE 2A).
Group 2: The results are detailed in FIGURE 6. At the beginning (H0), clinical criteria were normal. At the end of the second hour (H2), the two flaps were white, cold, without refill or bleeding (FIGURE 2B).
Group 3: At H0 each flap showed a healthy character: arterial bleeding, normal appearance, with a time of refill equal to 3 seconds. Then the changes were noticeable between the third and fifth hours (average time of 3.8 hours) (FIGURE 2C-D).
Figure 2: A- Clinical appearance of healthy myocutaneous flap (without ligature of the pedicle) to the twenty-fourth time (H24).
B- Myocutaneous latissimus dorsi flap at the twenty-fourth time (H24) after ligation of the arterial pedicle.
C- Myocutaneous latissimus dorsi flap at the sixth hour (H6) after ligation of the venous pedicle.
D- Myocutaneous latissimus dorsi flap at the twenty-fourth time (H24) after ligation of venous pedicle.
Group 4: At H0, each flap showed a healthy character: arterial bleeding, normal appearance with a time of refill equal to 3 seconds. At the end of first hour (H1), each flap had an ischemic nature (white, capillary refill time equal to or greater than 4 seconds). At the end of the second hour (H2), all fragments were healthy.
Biological monitoring
A total of 25 measurements were performed for each flap.
Group 1: The measures of control group serve as a reference
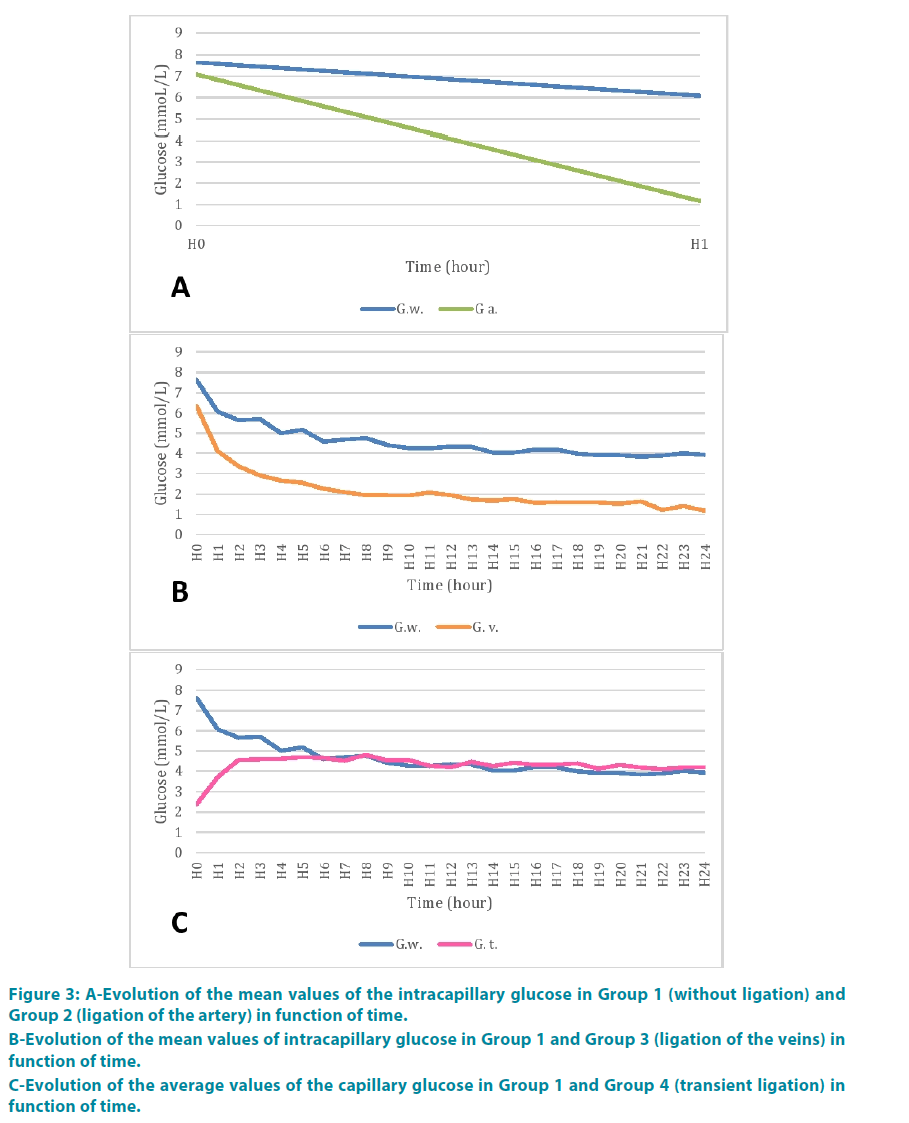
Group 2: Glucose rate was 1.17 mmol/l at the end of the second hour. FIGURE 3A shows the comparison of mean values of glucose with the control group. There appeared to be a greater decreasing kinetic comparing to the control group. But variance analysis showed no statistically significant difference neither between the groups (p=0.20) nor between period time (p=0.19) (TABLE 1).
Figure 3: A-Evolution of the mean values of the intracapillary glucose in Group 1 (without ligation) and Group 2 (ligation of the artery) in function of time.
B-Evolution of the mean values of intracapillary glucose in Group 1 and Group 3 (ligation of the veins) in function of time.
C-Evolution of the average values of the capillary glucose in Group 1 and Group 4 (transient ligation) in function of time.
| Source | Valuer test Fischer | p | |
|---|---|---|---|
| Glucose | Ligature arterial | 2.11 | 0.2057 |
| Hour | 2.25 | 0.1941 | |
| Lactate | Ligature arterial | 184.71 | 0.0002 |
| Hour | 45.27 | 0.0025 | |
| Ligature arterial* Hour | 51.73 | 0.0020 |
Table 1: Analysis of variance glucose and lactate between Group 1 and Group 2.
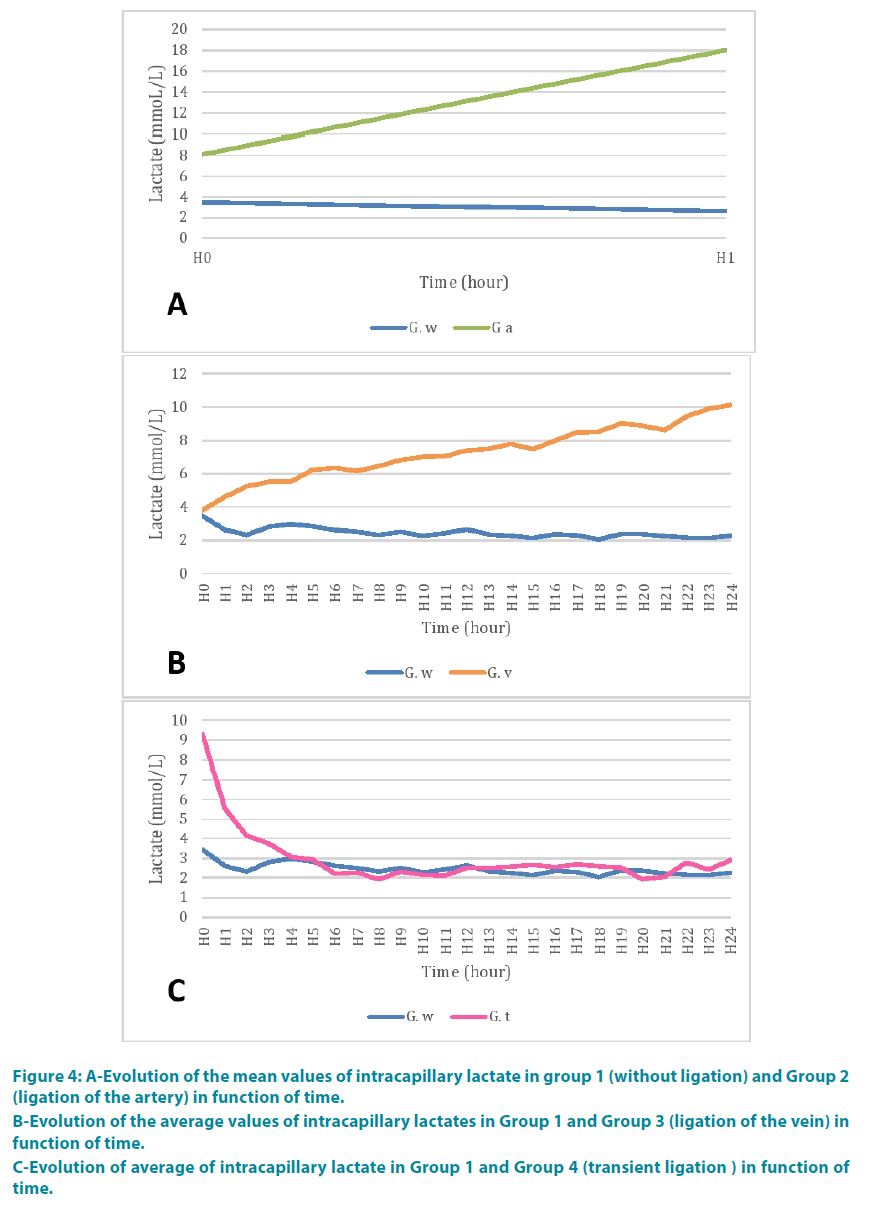
At the end of the second time (H1), the lactate was 18 mmol/l. FIGURE 4A shows the comparison of mean values of capillary lactate with the control group. There appeared to be a greater decreasing kinetic than in the control group. The lactate analysis of variance showed a statistically significant difference between the two groups (p=0.002) and between period time (p=0.002) (TABLE 1).
Figure 4: A-Evolution of the mean values of intracapillary lactate in group 1 (without ligation) and Group 2 (ligation of the artery) in function of time.
B-Evolution of the average values of intracapillary lactates in Group 1 and Group 3 (ligation of the vein) in function of time.
C-Evolution of average of intracapillary lactate in Group 1 and Group 4 (transient ligation ) in function of time.
Group 3: Glucose rate at the fourth hour (H4) was 2.5 mmol/l. FIGURE 3B represents the comparison of the mean values of glucose with the control group. These values were consistently lower than in the control group. But the difference was statistically significant between the groups (p=0.9985) and across period time (p=0.9985) (TABLE 2).
| Source | Valuer test Fischer | p | |
|---|---|---|---|
| Glucose | Venous ligaments | 485.23 | <0.0001 |
| Hour | 13.59 | <0.0001 | |
| Venous ligaments* Hour | 0.34 | 0.9985 | |
| Lactate | Venous ligaments | 1328.73 | <0.0001 |
| Hour | 4.64 | <0.0001 | |
| Venous ligaments* Hour | 8.15 | <0.0001 |
Table 2: Analysis of variance glucose and lactate between Group 1 and Group 3.
Lactate rate at the fourth hour (H4) was 5.52 mmol/l. FIGURE 4B shows the comparison of mean values of capillary lactate with the control group. The lactate levels were higher than in the control group. There was a statistically significant difference between the two groups (p<0.0001). Further evolution in time of this lactate was a function of the disease (p<0.0001) (TABLE 2).
Group 4: During the ligature clampage, signs of ischemia were noted. Glucose rate was 2.22 mmol/l at the end of the first hour (H1).
At the end of the second hour (H2) blood glucose was 4.56 mmol/l. FIGURE 3C shows the comparison of mean values of glucose with the control group. There was a statistically significant difference between the two groups (p<0.0001), between period time (p<0.0001) (TABLE 3).
| Source | Valuer test Fischer | p | |
|---|---|---|---|
| Glucose | Transitional clamping | 7.61 | 0.0065 |
| Hour | 1.84 | 0.0153 | |
| Transitional clamping* Hour | 4.95 | <0.0001 | |
| Lactate | Transitional clamping | 25.02 | <0.0001 |
| Hour | 11.43 | <0.0001 | |
| Transitional clamping* Hour | 6.59 | <0.0001 |
Table 3: Analysis of variance glucose and lactate between Group 1 and Group 4.
The lactate level was 9.2 mmol/l when the clamp release at the end of the first hour (H1).
One hour after unclamping (H2), lactate levels were 4.1 mmol/l. FIGURE 4C shows the comparison of average values lactate with the control group. There was a statistically significant difference between the two groups (p<0.0001), between period time (p<0.0001) (TABLE 3).
Histological monitoring
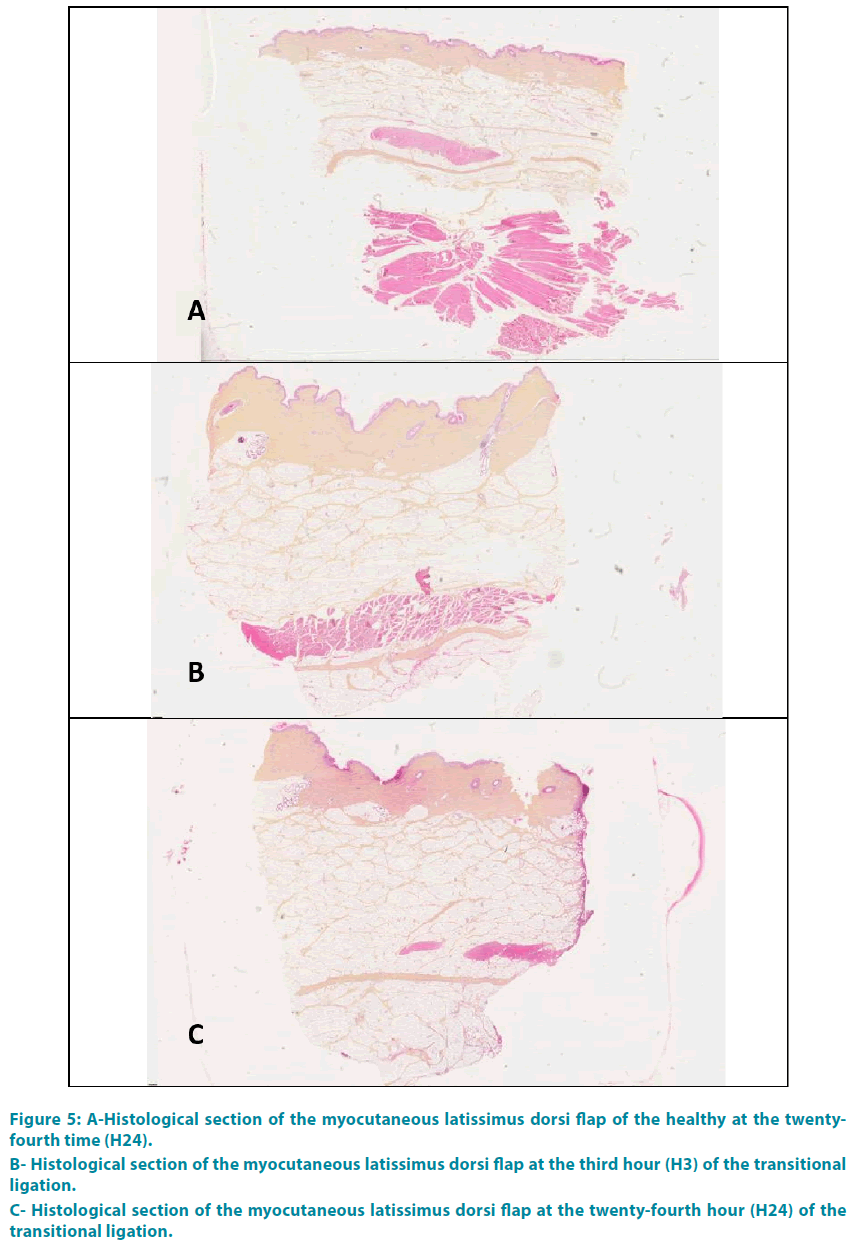
Group 1: FIGURE 5A shows a histological section taken from a healthy flap. The three layers of the skin (epidermis, dermis and hypodermis) were well distinguished. Red cells appeared stained red-orange light; the cell nuclei were blue-violet, in light pink cytoplasm. The collagen was colored yellow-orange with saffron. The white adipose lobules appeared separated by interlobular septa. Myofibroblasts were colored in pink.
Group 2: For technical reasons we have not been able to exploit the histological results of this group (bad conservation).
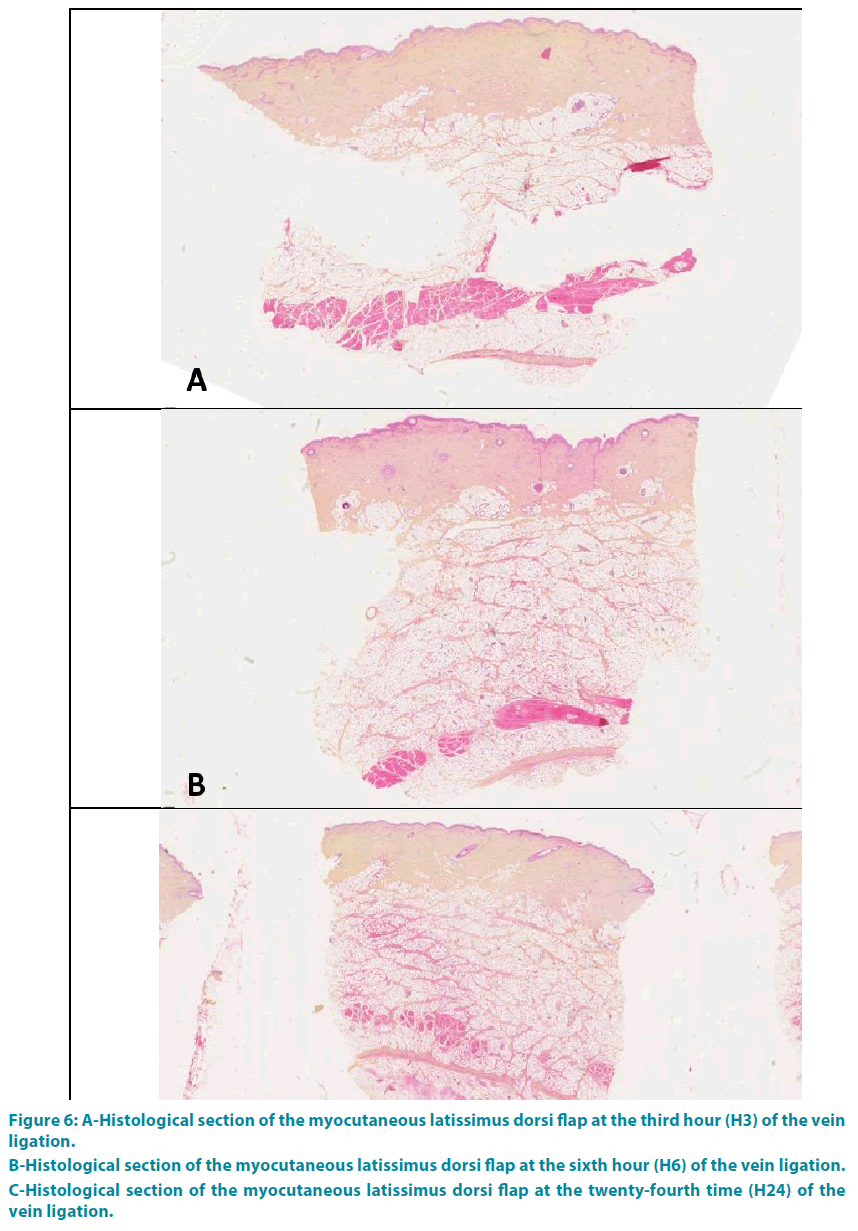
Group 3: The analysis at the end of the third hour (H3) showed a complete occlusion of the vessel lumen, with thickening of the interlobular septa of the hypodermis and collagen (type 1 to 80%). This collagen was edematous, thick, dense orange-yellow. These phenomena grew progressively with a climax at the end of the twenty-fourth time (H24) (FIGURE 6A-C).
Group 4: There was no abnormally at the end of the third hour (H3), or H6 nor H24 (FIGURE 5B-C).
Figure 5: A-Histological section of the myocutaneous latissimus dorsi flap of the healthy at the twentyfourth time (H24).
B- Histological section of the myocutaneous latissimus dorsi flap at the third hour (H3) of the transitional ligation.
C- Histological section of the myocutaneous latissimus dorsi flap at the twenty-fourth hour (H24) of the transitional ligation.
Figure 6: A-Histological section of the myocutaneous latissimus dorsi flap at the third hour (H3) of the vein ligation.
B-Histological section of the myocutaneous latissimus dorsi flap at the sixth hour (H6) of the vein ligation.
C-Histological section of the myocutaneous latissimus dorsi flap at the twenty-fourth time (H24) of the vein ligation.
Discussion
Experimentally, the rates of intracapillary lactate and glucose vary in case of thrombosis. These two parameters could be used to complete the postoperative clinical monitoring for free flaps. For our study the pig was chosen because of the anatomical and physiological similarities with the human body [16].
The groups were created to reproduce experimentally different clinical situations that may occur in microsurgery: Group 1 (without ligation of the vascular pedicle) corresponds to the situation without vascular complication. Groups 2 and 3 (final ligation of the artery or the two veins) correspond to thrombosis of microsurgery anastomosis due to arterial or venous thrombosis.
These complications often occur in the first twenty-four hours [1,5,12-14]. This acute period does not allow the creation of a microvascular network, unlike what happens in chronic occlusion. The surgical failure is certain if no salvage surgery is performed. This salvage treatment must be done as quickly as possible because the survival rate which varies between 0% and 100%) [4,15]. Group 4 (transient ligation of the vascular pedicle) corresponds to the period of ischemia between the cut of the vascular pedicle, the positioning and the time of the micro-vascular anastomosis. Our results show clinical, biological and histological reversibility after a reasonable period of vascular thrombosis.
In our study, clinical monitoring lags behind the biological manifestations. This delay is two hours for arterial thrombosis and about 4 hours for venous thrombosis. Other studies are in agreement with our results [5,6]. The value of intracapillary glucose and lactate and their respective kinetics allow early suspicion of arterial thrombosis. Indeed these values are very different from the values of the healthy flaps from the first hour (Group 1). The combination of the measurement of intra-capillary glucose and lactate of a microsurgical flap’s skin paddle would shorten the delay of the diagnosis of complication and increase the flap survival rates after salvage surgery.
These first results allow differentiating healthy flap of a flap with vascular complication. In combination with clinical signs, diagnosis can be refined: vascular or venous complications. But this distinction is theoretical since in practice the arterial and venous anastomoses are revised during the salvage surgery.
The cost of our paraclinical monitoring is low; about 30 euros per day while other methods like microdialysis costs about 1200 euros per day [17].
This technique should be combined with specific measures in diabetic patients. Indeed diabetic patients had postoperative dysfunction of glycaemia despite insulin therapy. The intracapillary blood sugar (hyper or hypoglycemia) of the flap should be compared to the patient’s systematic glycemia [18].
The causes of changes in lactate may be iatrogenic (Ringer lactate diffusion) or systemic. In These cases general clinical signs (septic shock) are associated. The rescue of the flap becomes a secondary emergency in these vital cases.
Our method could be improved through realtime monitoring such as patch installation measuring intra-capillar glycemia.
Conclusion
Clinical monitoring is delayed in vascular complications of flaps. This delay may be pejorative for the prognosis of the flap. The intra-capillary measures of lactate and glucose levels associated with clinical monitoring may shorten the delay in diagnosis. Ultimately this will save lives and achieve better functional and aesthetic results.
Conflict of interest
The scientific project received funding from “Fondation des Gueules Cassées” recognized as a public-interest organization by the decree of the 11 April 2001.
References
- Brown JS, Devine JC, Magennis P, et al. Factors that influence the outcome of salvage in free tissue transfer. Br J Oral MaxillofacSurg41(1),16-20 (2003).
- Disa JJ, Cordeiro PG, Hidalgo DA. Efficacy of conventional monitoring techniques in free tissue transfer: an 11-year experience in 750 consecutive cases. PlastReconstrSurg 104(1),97-101 (1999).
- Bianchi B, Copelli C, Ferrari S, et al. Free flaps: Outcomes and complications in head and neck reconstructions. J Cranio-MaxillofacSurg 37(8),438-442 (2009).
- Eckardt A, Meyer A, Laas U, Hausamen J-E. Reconstruction of defects in the head and neck with free flaps: 20 years experience. Br J Oral MaxillofacSurg45(1),11-15 (2007).
- Kroll SS, Schusterman MA, Reece GP, et al. Timing of pedicle thrombosis and flap loss after free-tissue transfer. PlastReconstrSurg 98(7),1230-1233 (1996).
- Salama AR, McClure SA, Ord RA, et al. Free-flap failures and complications in an American oral and maxillofacial surgery unit. Int J Oral MaxillofacSurg 38(10),1048-1051 (2009).
- Bozikov K, Arnez ZM. Factors predicting free flap complications in head and neck reconstruction. J PlastReconstrAesthetSurg 59(7),737-742 (2006).
- Cho BC, Shin DP, Byun JS, et al. Monitoring flap for buried free tissue transfer: its importance and reliability. PlastReconstrSurg 110(5),1249-1258 (2002).
- Khouri RK, Cooley BC, Kunselman AR, et al.A prospective study of microvascular free-flap surgery and outcome.PlastReconstrSurg 102(3), 711-721 (1998).
- Swartz WM, Izquierdo R, Miller MJ. Implantable venous Doppler microvascular monitoring: laboratory investigation and clinical results. PlastReconstrSurg 93(1),152-163 (1994).
- Um GT, Chang J, Louie O, et al. Implantable Cook-Swartz Doppler probe versus Synovis Flow Coupler for the post-operative monitoring of free flap breast reconstruction. J PlastReconstr Aesthetic Surg67(7),960-966 (2014).
- Ho MW, Brown JS, Magennis P, et al. Salvage outcomes of free tissue transfer in Liverpool: trends over 18 years (1992–2009). Br J Oral MaxillofacSurg 50(1),13-18 (2012).
- Winterton RIS, Pinder RM, Morritt AN, et al. Long term study into surgical re-exploration of the “free flap in difficulty.” J PlastReconstrAesthetSurg 63(7), 1080-1086 (2010).
- Miyasaka M, Ichikawa K, Nishimura M, et al. Salvage operations of free tissue transfer following internal jugular venous thrombosis: a review of 4 cases. Microsurgery 25(3),191-195 (2005).
- Keller A. Noninvasive Tissue Oximetry for Flap Monitoring: An Initial Study. J ReconstrMicrosurg 23(4),189–197 (2007).
- Cross BM, McWilliam AA, Olfert ED, et al. Manual on the care and use of experimental animals. Ottawa: Canadian Council on Animal Care(1993).
- Abdel-Galil K, Mitchell D. Postoperative monitoring of microsurgical free-tissue transfers for head and neck reconstruction: a systematic review of current techniques--part II. Invasive techniques. Br J Oral MaxillofacSurg 47(6),438-442 (2009).
- Henault B, Pluvy I, Pauchot J, et al. Capillary measurement of lactate and glucose for free flap monitoring. Ann ChirPlastEsthét, 59(1), 15-21 (2014).
