Research Article - Neuropsychiatry (2018) Volume 8, Issue 5
Motor Resonance Mechanisms during Action Imitation in Depression
Abstract
Objectives
Major depressive disorder has been associated with impairments in social cognition. However, studies exploring the processing of social information focused on facial discrimination. The aim of this study was to better characterize the sensorimotor mechanisms underlying motor resonance in depressed patients.
Method
Twenty-three right-handed patients meeting DSM-IV criteria for unipolar depression were compared to 14 matched healthy controls. In a simple imitation paradigm, the kinematic features of movements in natural condition were compared to those of motions performed after the observation of a moving dot. Reaction time and pointing velocity were considered to evaluate if the motor performance was contaminated by the observed stimulus.
Results
Patient’s velocity varied in agreement with dot velocity, proving that they were able to extract the correct information from the stimuli and use it to plan their responses. Depressed patients’ actions, as well as healthy controls, were influenced by the dot velocity, suggesting that motor resonance mechanisms are not prevented by depression. In contrast, only patients had anticipatory motor response and started moving before the end of the stimulus motion.
Conclusion
Our findings suggest that motor resonance mechanisms are not altered by the disease. However, depressed patients exhibit a specific deficit in motor inhibition in the selection of motor responses.
Keywords
Unipolar depression, Major depressive disorder, Psychomotor retardation, Motor resonance, Automatic imitation
Introduction
Major depressive disorder (MDD) is expected to become a leading cause of disability in the western world, producing the second largest disease burden by the year 2020 [1]. Episodes of depression, marked by core depressive emotional and physical symptoms, are also accompanied by difficulties in social functioning and interpersonal relationships. Impairments in social cognition constitute a substantial component of the personal, economic and social burden of the disease, reducing time to relapse and subsequently increasing suicide risk [2]. However, difficulties in conceptualizing and assessing social responsivity and empathic-related abilities have impeded progress towards successful targeted treatment and intervention strategies. Researches seeking to understand the nature of impairments in the processing of social information have used procedures focusing on facial discrimination or metacognitive capabilities. A general emotion recognition deficit in face perception have been consistently documented, along with a mood-congruent processing bias with hypo-activation towards happy facial expressions and hyper-activation towards sad or negative facial expressions [3,4]. Deficits are not restricted to the visual domain, as anomalies in recognition and identification of emotional prosody has been reported as well [5]. Additionally, weaknesses in theory of mind (ToM) and metacognition have been observed in ethological studies and emotion research [6,7]. Social functioning requires operations of increasing level of complexity dependent on the link between perception and action, from early perception to high-level self-reflection. If ToM and perspective taking represent higher-order facets of social skills, motor resonance [8] has been proposed as a basic neural substrate for social information processing, in addition to the concept of embodied cognition. Resonance phenomenon provides an implicit and prereflexive way to establish inter-individual interactions through the mirroring of actions, postures, gesture or other behaviors. Studies by Rizzolatti [8] and Fadiga [9] have shown that perception of a subject’s action automatically triggers the observer’s corresponding internal representations of that action [9,10]. This shared representation automatically activates motor areas of the brain leading to the preparation and execution of a motor response with features similar to the observed action. This state-matching reaction has been related to the simulation theory and the fronto-parietal network of the human mirroring system [11]. Imitations, and its inhibition during daily life activities, represent a specific case of action–perception coupling that plays a major adaptive role by facilitating the learning of new motor skills. Imitative behaviours manifest as the automatic tendency or the intention to reproduce the properties of the observed motion, and are thought to occur via direct lower-level visuomotor mapping [12]. From a clinical perspective, characterizing the sensorimotor mechanisms underlying resonance may potentially represent a promising and innovative manner to investigate perception– action coupling and empathy-related abilities in neuropsychiatric populations. Observable signs of resonance can be diminished in psychiatric disorders such as autism [13], schizophrenia and personality disorders such as psychopathy [14-18]. Assessing empathic abilities with resonance tasks can reveal spontaneous behavioral reactions reflecting daily-life social skills independently of participants’ intellectual abilities, since processing at this level is characterized by being fast, implicit and domain specific [19,20]. In the current study, we evaluated the sensorimotor mechanisms underlying motor resonance by employing a simple imitation paradigm. To reduce the impact that higher-order processes have on imitation we used a non-human agent model to control social attention. Our general aim was to examine whether the sensorimotor mechanisms underlying motor resonance are affected by MDD.
Materials and Method
▪ Participants
Twenty-three patients (MDD, 17 females, 6 males, mean 61.8 ± 16.3 years) meeting Diagnostic and Statistical Manual of Mental Disorders (DSM-IV) criteria for unipolar depression and 11healthy controls (HC, 9 females, 2 males, mean 57.6 ± 11.2 years), matched for age, sex and education, participated in this study. MDD were included into the study if their score was more than 25 on the Montgomery Asberg Depression Rating Scale (MADRS) [21]. Exclusion criteria were: bipolar depression, psychotic features, neurological disease, severe organic disease and intake of first-generation antipsychotics (FGA). Every patient received an antidepressant medication with escitalopram in a constant dosage (10-20 mg/day) over four weeks prior to the experiment. Concomitant medication with benzodiazepines was permitted. All participants gave written informed consent to participate in the study. Research protocol was approved by the Committee of Protection of Persons (CPP-Est-II), and was conducted in accordance with the principle laid down by the declaration of Helsinski.
▪ Psychiatric assessment
MDD patients completed the MADRS and the Salpetriere Retardation Rating Scale (SRRS) [22] to determine depression severity and the clinical severity of retardation. All patients were severely depressed (mean scores MADRS: 31,3 ±7,5) and showed a marked degree of retardation (27,95 ± 10,6).
▪ Cognitive assessment
A trained, licensed neuropsychologist conducted a complete neuropsychological test battery in the MDD group. This battery is designed to provide a broad assessment of functioning in five cognitive domains: (1) Global cognitive function: Mini Mental State Examination (MMSE) (2) Attention/Processing Speed: Trail Making Test- Part A (TMT A), Crossing Off Test (COT); (3) Executive functions: Trail Making Test-Part B (TMT B), Isaacs Set Test (IST) ; (4) Verbal Memory: Memory Impairment Screen (MIS) ; (5) Language: Picture naming test (DO 30).
▪ Movement tasks
The task is a modified version of that described in previous studies of our group [20,23,24]. All participants were seated in a darkened room in front of a large rear projection screen (170*230) placed 10 cm beyond the end of participants’ extended arm. The visual stimuli were backprojected onto the display screen with a videoprojector placed behind the screen and connected to a PC. The projected visual stimulation was generated using MatLab Pyschotoolbox ®. One passive infrared reflective marker (diameter=20 mm) was applied onto a fingertip of the participants’ right hand and arm movements were recorded using an optoelectronic system (SMART CAPTURE) with six cameras recording movements at a sampling frequency of 120 Hz. The device was calibrated for each participant at the beginning of the experimental sessions. Each participant performed a pointing movement experiment (PM) and a movement observation experiment (MO). These tasks were presented in two separate blocks, the PM experiment before the MO.
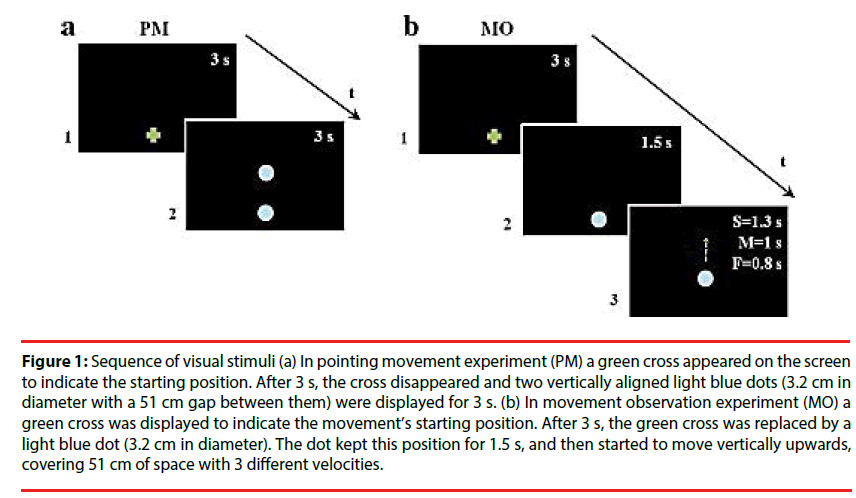
Pointing movement experiment (PM): this task was aimed at measuring participants’ natural pointing movements. The kinematic data served as a baseline to be compared with arm kinematics after motion observation. A green cross appeared on the screen to indicate the starting position. After 3 s, the cross disappeared and two vertically aligned light blue dots (3.2 cm in diameter with a 51 cm gap between them) were displayed for 3 s. One of the two dots replaced the green cross and the other one was the target for the movement (Figure 1a). Participants performed upwards movements with their right arm in an extended position from the given starting position to the target dot at spontaneous natural velocity. The pointing movement was repeated five times, and movement accuracy was not emphasized.
Figure 1: Sequence of visual stimuli (a) In pointing movement experiment (PM) a green cross appeared on the screen to indicate the starting position. After 3 s, the cross disappeared and two vertically aligned light blue dots (3.2 cm in diameter with a 51 cm gap between them) were displayed for 3 s. (b) In movement observation experiment (MO) a green cross was displayed to indicate the movement’s starting position. After 3 s, the green cross was replaced by a light blue dot (3.2 cm in diameter). The dot kept this position for 1.5 s, and then started to move vertically upwards, covering 51 cm of space with 3 different velocities.
Movement observation experiment: In this experiment, a green cross was displayed to indicate the movement’s starting position. After 3 s, the green cross was replaced by a light blue dot (3.2 cm in diameter). The dot kept this position for 1.5 s, and then started to move vertically upwards with a biological kinematic, covering 51 cm of space. Dot motions differed in mean velocity (Vp): slow (S=0.28 m/s), medium (M=0.43 m/s), and fast (F=0.52 m/s) (Figure 1b). Stimulus velocities were randomized. Participants accomplished two types of tasks, implicit (i) and explicit (e), which differed only for their instruction. In MOi, participants were asked to point the green cross, and then to watch the dot’s movement, wait until the dot reach it’s final, visible position, and finally point towards this position. In MOe, the instructions were similar but participants were requested to imitate the stimulus motion velocity. There were 6 replications in each dot motion velocity resulting a total of 18 trials. The implicit task preceded the explicit one to prevent contamination of the implicit movement by the explicit instruction. For both tasks, the beginning of the experiment was preceded by a training phase, which ended when the participant understood the task and correctly accomplished all the experiment at least twice. Moreover, each participant received verbal feedback from the experimenter during the testing procedure in order to eliminate any confusion about their aim.
▪ Data treatment
Data processing: Data was low-pass filtered at 5 Hz using a 2nd order Butterworth filter. To define the onset and offset of the movement, we chose a threshold corresponding to 10% of the maximum value of the movement velocity profile.
Data analysis: Analyses were performed using MatLab® software. In PM, data recorded were the reaction (RT, the time elapsed between the appearance of the two dots and arm’s movement onset), the duration (DUR) of the movements, the mean velocity (Vmean), the maximum velocity (Vmax), the normalized jerk (the rate of change in acceleration) and the time peak velocity (TPV, the ratio between the acceleration phase duration and the total movement duration).
In MO, the RT (i.e., the difference in time between the end of dot motion and the onset of participant’s pointing movement) and the Vmean were analysed.
▪ Statistical analysis
A Shapiro-Wilk test was performed to assess the normality of data. The equality of variance was controlled by a Fisher-Snedecor test. Categorical variables were compared using the chi-square test or the Fisher’s exact test (if the sample size was less than 5). The Greenhouse-Geisser correction was used when sphericity was not assumed.
In pointing movement experiment the kinematic variables obtained during the performances of the two groups (depressed vs. controls) were statistically compared by means of one-way ANOVAs.
In Movement observation experiment, two mixed-design ANOVAs with group (MDD vs. HC) as between subject factor and velocity (slow; medium; fast) as within subject factor were applied on reaction time and mean velocity obtained in MOi and MOe.
Concerning reaction time, in order to test the ability to inhibit the motor response, we computed how many responses were characterized by RT<0 for each stimulus velocity.
The slope of the linear fits was primarily used to evaluate the degree of influence of the stimuli motions onto the movement execution (slope=1 means perfect reproduction of the stimulus mean velocity). For this reason, in both MOi and MOe the slopes of the regression lines obtained for each participant in the two groups were statistically compared using a one-way ANOVA (Group, as between subject factor). In addition, each set of slope values was compared with a hypothetical non-contaminated behaviour (horizontal line, slope=0) using two paired t-tests.
To directly assess the effect of the instruction given by the experimenter, a mixed-design ANOVA with group (MDD vs HC) as between subject factor, velocity (slow; medium; fast) and instruction (implicit vs. explicit) as within subject factor was applied on RT and Vmean values. Further, MOi and MOe slope values for the two groups were compared by mean of an ANOVA with group (MDD vs. HC), as between subject factor, and instruction (implicit vs. explicit) as within subject factor.
Differences between both groups in the PM, MOi and MOe tasks were evaluated using ANCOVAs including group (depressed, healthy control) as a factor, and neuropsychological battery scores as covariates.
Correlational analyses were performed to examine the relationship between kinematical variables in all tasks and clinical scores of depression and psychomotor retardation. The significance alpha level was fixed to 0.05. Effect sizes were measured by partial Eta squared (η2p) with small, medium and large effects defined as 0.01, 0.06 and 0.14 respectively. All computations were performed using Stata Software release 10.1 (StataCorp, College Station, TX).
Results
▪ Pointing movements experiment
The PM performances are presented for both groups in Table 1. The RT was not increased in MDD patients in comparison with the HC group. MDD patients had lower Vmean and Vmax than HC. The DUR of arm movement was significantly higher for MDD patients compared to HC. The jerk was significantly higher for MDD patients compared to HC. There was no significant difference between the two groups for the TPV. A complete description of the statistical results is provided in Table 1.
| PM parameters | MDD (N=23) | HC (N=11) | F(1,32) | p | η2p |
|---|---|---|---|---|---|
| RT (s) | 0.46 ± 0.13 | 0.48 ± 0.14 | 0.13 | N.S. | <0.01 |
| DUR (s) | 0.82 ± 0.23 | 0.62 ± 0.14 | 7.44 | < 0.05 | 0.19 |
| Vmean (m/s) | 0.6 ± 0.15 | 0.8 ± 0.17 | 11.59 | < 0.01 | 0.26 |
| Vmax (m/s) | 1.18 ± 0.32 | 1.48 ± 0.29 | 6.93 | < 0.05 | 0.18 |
| Jerk | 28.01 ± 16.6 | 18.01 + 3.15 | 8.56 | < 0.01 | 0.21 |
| Tpv | 0.41 ± 0.09 | 0.40 ± 0.05 | 0.05 | N.S. | <0.01 |
Table 1: Kinematic parameters values of MDD and HC movements in pointing movement task.
▪ Movement observation experiment
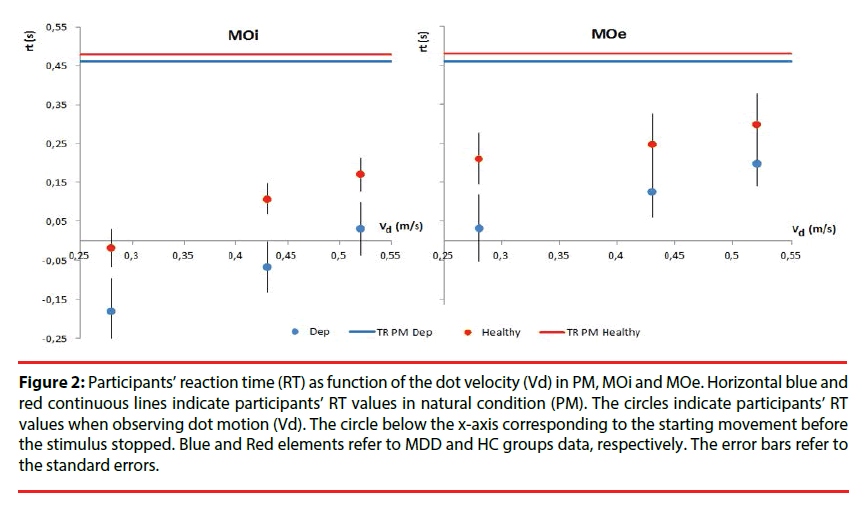
Reaction time: The MO performances are presented for both groups in Table 2. Mixeddesign ANOVA on RT in MOi task had not shown differences between the MDD and HC groups [F(1,32)=2.29, p=0.14, η2p=0.06 ], and not significant effect of the velocity factor [F(2,64)=0.15, p=0.86, η2p<0.05]. In order to identify anticipatory processes, the number of responses characterized by RT<0 was computed. MDD patients started before stimulus movement stopped only for slow Vd (t(44)= -2.11, < 0.05) (Figure 2). In MOe experiment, MDD patients and HC had a similar RT [F(1,32)=1.41, p=0.24, η2p<0.05 ] and there was no significant effect of the Vd [F(2,64)=1.53, p=0.22, η2p<0.05] (Figure 2).
Figure 2: Participants’ reaction time (RT) as function of the dot velocity (Vd) in PM, MOi and MOe. Horizontal blue and red continuous lines indicate participants’ RT values in natural condition (PM). The circles indicate participants’ RT values when observing dot motion (Vd). The circle below the x-axis corresponding to the starting movement before the stimulus stopped. Blue and Red elements refer to MDD and HC groups data, respectively. The error bars refer to the standard errors.
| MOi | MOe | |||||
|---|---|---|---|---|---|---|
| MDD (N=23) | HC (N=11) | p | MDD (N=23) | HC (N=11) | p | |
| RT (s) | ||||||
| Slow | -0.18 ± 0.4 | -0.02 ± 0.2 | N.S. | 0.03 ± 0.4 | 0.21 ± 0.2 | N.S. |
| Medium | -0.06 ± 0.3 | 0.11 ± 0.1 | N.S. | 0.12 ± 0.3 | 0.24 ± 0.2 | N.S. |
| Fast | 0.03 ± 0.3 | 0.17 ± 0.1 | N.S. | 0.21 ± 0.3 | 0.29 ± 0.2 | N.S. |
| Vmean (m/s) | ||||||
| Slow | 0.54 ± 0.1 | 0.73 ± 0.2 | N.S. | 0.41 ± 0.1 | 0.47 ± 0.1 | NS |
| Medium | 0.55 ± 0.1 | 0.81 ± 0.1 | <0.05 | 0.47 ± 0.1 | 0.56 ± 0.1 | NS |
| Fast | 0.59 ± 0.1 | 0.79 ± 0.1 | <0.05 | 0.54 ± 0.1 | 0.77 ± 0.1 | <0.01 |
Table 2: Kinematic parameters values of MDD and HC movements in implicit and explicit movement observation tasks.
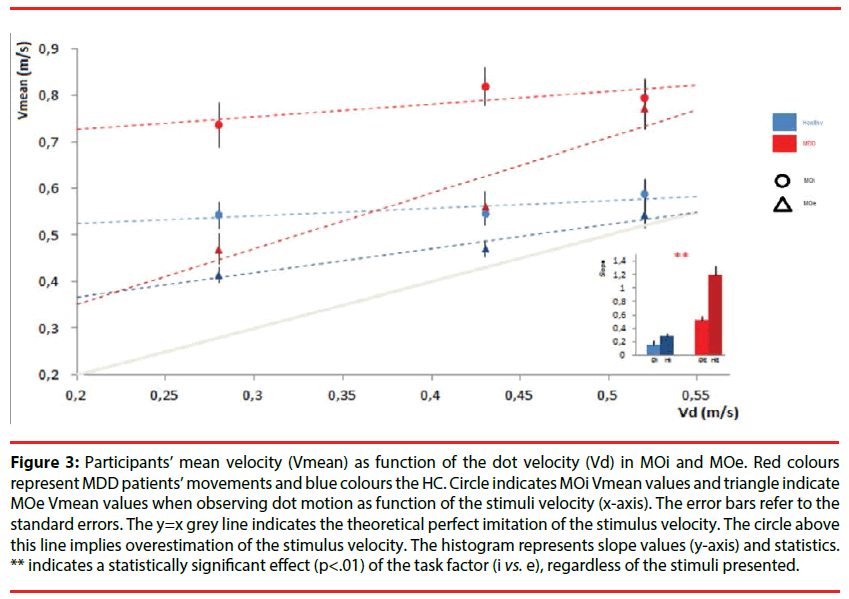
Mean velocity: The result of the mixed-design ANOVA on MOi task showed that MDD patients had significantly lower Vmean than HC [F (1,32)=21.44, p<0.001, η2p=0.4]. There was also a significant effect of the interaction between group and stimulus velocity [F (2,64)=6.18, p<0.01, η2p=0.16]. Post hoc comparisons showed that the difference between MDD patients and HC was significant for medium and fast velocities (always p<0.05) and was not significant for slow velocity (p>0.05).
The one-way ANOVA comparing the slopes values of the MDD patients (Mean=0.16, S.D=0.28) and HC (Mean=0.27, S.D=0.18) showed that performances were equally influenced by the observed motion [F (1,32)=1.36, p=0.25, η2p=0.04]. Moreover, the comparison with a hypothetical non-imitative behavior (horizontal line, slope=0) showed that MDD patients and HC differed significantly to this hypothetical line (respectively depressed: t(44)=2.81, p<0.01; controls : t(20)=4.90, p<0.001). Hence, MDD patients and HC were automatically influenced by the stimulus velocities (Figure 3).
Figure 3: Participants’ mean velocity (Vmean) as function of the dot velocity (Vd) in MOi and MOe. Red colours represent MDD patients’ movements and blue colours the HC. Circle indicates MOi Vmean values and triangle indicate MOe Vmean values when observing dot motion as function of the stimuli velocity (x-axis). The error bars refer to the standard errors. The y=x grey line indicates the theoretical perfect imitation of the stimulus velocity. The circle above this line implies overestimation of the stimulus velocity. The histogram represents slope values (y-axis) and statistics. ** indicates a statistically significant effect (p<.01) of the task factor (i vs. e), regardless of the stimuli presented.
In MOe task, the statistical analysis showed that HC had significantly lower Vmean than MDD [F(1,32)=12.61, p<0.01, η2p=0.28]. Further, there was a significant effect of the stimulus velocity [F(2.64)=20.63, p<0.001, η2p=0.39]. Post hoc values showed significant difference for fast velocity between the two groups (p<0.01) but not for slow (p>0.05) and medium (p>0.05) velocities.
A one-way ANOVA comparing the slopes values of the MDD patients (Mean=0.52, S.D=0.38) and HC (Mean=1.19, S.D=0.43) showed that the ability to imitate the observed motion were different and significantly increase in HC [F(1,32)=21.26, p<0.001, η2p=0.39] (Figure 3). Moreover, each set of slope values was compared with a hypothetical non-imitative behavior (horizontal line, slope=0) using two paired t-test and MDD patients or HC differed significantly of this hypothetical line (respectively depressed: t(44)=2.81, p<0.01; controls : t(20)=4.90, p<0.001).
▪ Implicit versus explicit movement observation experiment
Reaction time: MDD patients and HC had similar RT values [F(1,32)=2.94, p=0.09, η2p=0.08]. There was no significant effect of velocity [F(2,64)=0.25, p=0.77, η2p<0.01], instruction [F(1,32)=0.006, p=0.93, η2p <0.001], and no interaction between velocity and instruction [F(2,64)=0.14, p=0.86, η2p < 0.01].
Mean velocity: MDD patients had significantly lower Vp than HC [F (1,32)=21.47, p<0.001, η2p=0.4]. There was a significant effect of velocity [F(2,64)=14.03, p<0.001, η2p=0.3], instruction [F(1,32)=6.56, p<0.05, η2p=0.17], and an interaction between velocity and instruction [F(2,64)=14.92, p<0.001, η2p=0.32]. Post hoc showed significant effect of instruction on slow and medium velocities (respectively p<0.001; p<0.01) in MDD group. There was no significant effect for fast velocity (p>0.05). In HC, instruction had only significant effect for slow velocity (p<0.01) and no for medium (p>0.05) and fast (p>0.05) velocities.
At last, in order to evaluate if imitation was improved in MOe, the slope values of the linear regression models in MOi and MOe were statistically compared. The results of the mixeddesign ANOVA revealed that the imitative performances significantly improved in MOe in the two populations [F (1,32)=8.61, p<0.01, η2p=0.21].
▪ Relationships between kinematical variables and clinical factors
Correlational analyses were performed to examine the relationship between kinematical variables in all tasks and clinical scores of depression and psychomotor retardation. No significant correlations were found.
Discussion
The present study investigated for the first time the sensorimotor mechanisms underlying motor resonance in patients with severe unipolar major depression. Imitation and inhibition abilities were evaluated by means of the automatic (implicit) and voluntary (explicit) imitation paradigm during which participant performed an arm pointing movement. Our main findings revealed (1) a global slowness of movements in each experimental condition, (2) an intact ability to voluntarily imitate and to be implicitly influenced by the stimulus velocity in patients with MDD compared with a control group of healthy adults. These results suggest that lowlevel resonance process is not affected by unipolar depression. Differently, a motor inhibitory deficiency appeared in depressed patients.
▪ Kinematic features of the participants’ pointing movement in natural condition (PM)
In natural condition (i.e., subjects asked to point toward a spatial target), the mean RT of MDD patients and HC were similar. Longer RT values have been previously reported in serial choice task with a high attention demand [25] but not systematically with simple reaction time procedures. In line with these observations, it has been proposed that depressive retardation does not affect all the steps of central nervous system information treatment, but was limited to the components of response-selection and motor-adjustment [26]. Moreover, antidepressant treatments may have improved RT before the experiment, without impart a parallel reduction in the severity of depression. Beneficial effects of antidepressants on temporal measures of motor function such as RT have been reported previously with conventional tricyclic antidepressants or SSRI [27]. However, in the absence of longitudinal data, we cannot determine whether antidepressants have lead to a reduction in the severity of the motor impairment. MDD patients showed increased duration and showed more jerky arm movement (i.e. with higher peak accelerations being measured and less efficient movement paths) relative to healthy participants. We suggest that this finding reflects MDD patients’ necessity to continuously monitor the ongoing action, and their dependency to the sensory feedback information during performance execution. To explore the possibility of a peripheral motor deficiency, the use of control tasks that involves a balistic movement would be useful in future researches. These behavioural motor abnormalities observed in our depressed patients are similar to those reported in other pathological conditions such as Alzheimer’s disease and Parkinson disease. Concerning Alzheimer’s disease, previous studies showed that patients were not able to maintain the initial motor plan throughout its course, as indicated by the increased movements duration and jerk with respect to healthy aged-matched participants. Regarding Parkinson disease, previous studies have drawn similarities between bradyphrenia in depressed patients and bradykinesia in Parkinson disease, specifically in self-initiated movement in reliance to external or internal cues, or in programing the velocity of movement [28-30]. Irregular patterns of velocity in depressed patients may stem from functional dysfunction of a brain network including the basal ganglia, the sensorimotor cortices and the supplementary motor area, essential for movement sequencing [31]. Sophisticated studies, including brain imaging methods and using a motor paradigm, would be needed to confirm this hypothesis.
▪ Pointing movements of MDD patients were contaminated by the stimulus velocity as well as those of HC
In implicit task, HC pointing velocities varied as a consequence of the stimuli velocities, suggesting an intact ability to automatically match the perceived kinematics with brain action representation, as already shown in previous studies on both young and elderly healthy participants [20,24]. As expected, imitation performance was improved when HC was explicitly instructed to reproduce the stimulus velocity. Similarly, depressed patients’ behaviour was implicitly influenced by the display velocity, and their imitative performances were significantly improved in MOe during voluntary imitation. Thus, our findings indicated that depression did not alter automatic imitation and the associated mechanisms of implicit motion recognition. This result indicates that visual processing automatically induces related motor responses and provides evidence that the sensorimotor resonance mechanisms (i.e. perception–action matching) underlying automatic imitation are not affected by the pathology. Literature on motor imitation demonstrated that motion observation and imitation induce simultaneous activation of fronto-parietal mirror neuron system [12]. Fadiga [9] proposed that these brain areas would give rise to the resonance mechanism that directly and implicitly maps a kinematic description of the observed action onto an internal motor representation of the same action [9]. Therefore, the preservation of automatic imitation in MDD implies the functioning of a circuit which involves the mirror neuron system, the superior temporal sulcus [32] and the sensorimotor areas for movement production. However, evidence from functional magnetic resonance imaging (fMRI) and positron emission tomography (PET) identified the involvement of frontal and parietal regions in depression [33]. Another hypothesis could be the presence of mechanisms implying intact brain regions taking over the functions to compensate for functional alterations of cortical and subcortical motor regions [34].
▪ Uncontrolled initiation of depressed patients’ motor response while observing a moving stimulus
In MO, depressed patients’ tended to start before the stimulus reached his final position, in contrast to healthy subjects who were able to wait until the stimulus stopped before starting their movement. In fact, the mere presence of the stimulus was sufficient to trigger the action indicating the dependence on the visual stimulus. This uncontrolled motion initiation would indicate depressed patients’ deficiency to voluntarily inhibit response production and could be underpinned by inadequate functioning of the inhibitory mechanisms. Our observation corroborates and expands to the sensorimotor domain previously described deficits in response monitoring in MDD while processing neutral or emotional information [35,36].
Inhibition describes an active process that tempers unwanted stimuli (external or internal) that compete for processing resources in the context of a limited capacity system and represent a key mechanism in the regulation of emotion [37]. Direct behavioral evidence indicates that individuals with major depression have greater deficits than healthy subjects in inhibition task such as the Stroop test [38,39] the Stop Signal task [40] and the antisaccade tasks [41]. These studies suggest that psychomotor retardation cannot fully account for impaired performance on inhibition tasks and highlight the need to distinguish between basic motor slowing and more elaborated motor processes involved in specific inhibitory disorder [42]. A systematic distinction between these processes is critical to better characterize the kind of cognitive-motor processes that are altered in depression. From a clinical perspective, inhibition deficit could play a fundamental role in the clinic expression of MDD, leading to behavioral trouble such as suicidal behaviour, and may help to predicts adverse outcomes of depression [43,44]. Additionally, brain imaging data indicates that the anterior part of the frontal lobe may be critical for inhibiting automatic imitation [45]. Inhibition deficits in MDD could underlie alterations of the frontal network and its role behavioural regulation.
A possible limitation of this study, which is common to many experiments in the field, is related to the effect of psychotropic medication. Pharmacological treatments can contribute to improve psychomotor functioning, but may also have disruptive effects, causing sedation or impairment in psychomotor and cognitive function.
Conclusion
Motor imitation represents a powerful biological resource for cognitive development and social interaction. Notably, low-level sensory-motor matching mechanisms that work on movement planning represent the basis for higher levels of social interaction. Our patients’ performances suggest that the resonance mechanisms at the basis of social cognition are preserved during unipolar depression. Beyond movement retardation, depressed patients exhibited a specific deficit in motor inhibition in the selection of motor responses that may underlie the presence of altered social cognition abilities. Indeed, deficits in cognitive control are related to the use of maladaptive emotion regulation strategies and have been associated with social dysfunction responsible of social interaction skills degradation (i.e. problems in expressing themselves clearly to others, inappropriately and excessively self-disclosing information, especially if it is negatively toned) [46]. The alteration of this mechanism is a relevant finding for physical and cognitive interventions in depression. Future studies should examine the relationship shared between motor resonances, quality of life or social and interpersonal functioning in MDD. Additionally, research investigating the trait or state dependency of action monitoring in severely depressed patients would be highly relevant to help clarify the long-term clinical and functional outcomes of this population. . The combination of transcranial magnetic stimulation (TMS) with brain imaging studies represents a powerful method of analysis of neural underpinnings of action observation in this population.
This research did not receive any specific grant from funding agencies in the public, commercial, or not-for-profit sectors.
References
- Murray CJL, Vos T, Lozano R, et al. Disability-adjusted life years (DALYs) for 291 diseases and injuries in 21 regions, 1990-2010: a systematic analysis for the Global Burden of Disease Study 2010. Lancet 380 (9859), 2197-2223 (2012).
- May AM, Klonsky ED, Klein DN. Predicting future suicide attempts among depressed suicide ideators: a 10-year longitudinal study. J. Psychiatr. Res 46(7), 946-952 (2012).
- Münkler P, Rothkirch M, Dalati Y, et al. Biased recognition of facial affect in patients with major depressive disorder reflects clinical state. PLoSONE 10(1), e0129863 (2015).
- Schneider D, Regenbogen C, Kellermann T, et al. Empathic behavioral and physiological responses to dynamic stimuli in depression. Psychiatry. Res 200(2-3), 294-305 (2012).
- Schlipf S, Batra A, Walter G, et al. Judgment of emotional information expressed by prosody and semantics in patients with unipolar depression. Front. Psychol 4(1), 461 (2013).
- Ladegaard N, Larsen ER, Videbech P, et al. Higher-order social cognition in first-episode major depression. Psychiatry. Res 216(1), 37-43 (2014).
- Ladegaard N, Lysaker PH, Larsen ER, et al. A comparison of capacities for social cognition and metacognition in first episode and prolonged depression. Psychiatry. Res 220(3), 883–889 (2014).
- Rizzolatti G, Fadiga L, Fogassi L, Gallese V. Resonance behaviors and mirror neurons. Arch. Ital. Biol 137(2-3), 85-100 (1999).
- Fadiga L, Fogassi L, Pavesi G, et al. Motor facilitation during action observation: a magnetic stimulation study. J. Neurophysiol 73(6), 2608-2611 (1995).
- Rizzolatti G, Fogassi L, Gallese V. Neurophysiological mechanisms underlying the understanding and imitation of action. Nat. Rev. Neurosci 2(1), 661-670 (2001).
- Jeannerod M. Neural simulation of action: a unifying mechanism for motor cognition. Neuroimage 14(1-2), 103-109 (2001).
- Iacoboni M. Imitation, empathy, and mirror neurons. Annu Rev Psychol 60(2), 653-670 (2009).
- Dapretto M, Davies MS, Pfeifer JH, et al. Understanding emotions in others: mirror neuron dysfunction in children with autism spectrum disorders. Nat. Neurosci 9(1), 28-30 (2006).
- Hagenmuller F, Rössler W, Endrass J, et al. Impaired resonance in offenders with psychopathic traits. Neuropsychiatr 26(2), 65-71 (2012).
- Haker H, Rössler W. Empathy in schizophrenia: impaired resonance. Eur. Arch. Psychiatry. Clin. Neurosci 259(6), 352-361 (2009).
- Helt MS, Eigsti IM, Snyder PJ, et al. contagious yawning in autistic and typical development. Child. Dev 81(5), 1620-1631 (2010).
- Lhermitte F. [Imitation and utilization behavior in major depressive states]. Bull. Acad. Natl. Med 177(6), 883-890-892 (1993).
- Lhermitte F, Pillon B, Serdaru M. Human autonomy and the frontal lobes. Part I: Imitation and utilization behavior: a neuropsychological study of 75 patients. Ann. Neurol 19(4), 326-334 (1986).
- Adolphs R. Conceptual challenges and directions for social neuroscience. Neuron 65(6), 752-767 (2010).
- Bisio A, Casteran M, Ballay Y, et al. Motor resonance mechanisms are preserved in Alzheimer’s disease patients. Neuroscience 222(1), 58-68 (2012).
- Montgomery SA, Asberg M. A new depression scale designed to be sensitive to change. Br. J. Psychiatry 134(4), 382-389 (1979).
- Jouvent R, Frechette D, Binoux F, et al. [Retardation in depressive states : elaboration of a quantitative rating scale (author’s transl)]. Encephale 6(1), 41-58 (1980).
- Bisio A, Casteran M, Ballay Y, et al. Voluntary Imitation in Alzheimer’s disease Patients. Front. Aging. Neurosci 8(1), 48 (2016).
- Bisio A, Stucchi N, Jacono M, et al. Automatic versus voluntary motor imitation: effect of visual context and stimulus velocity. PLoSONE 5(1), e13506 (2010).
- Bennabi D, Vandel P, Papaxanthis C, et al. Psychomotor retardation in depression: a systematic review of diagnostic, pathophysiologic, and therapeutic implications. Biomed. Res. Int 2013(1), 158746 (2013).
- Bonin-Guillaume S, Hasbroucq T, Blin O. [Psychomotor retardation associated to depression differs from that of normal aging]. Psychol. Neuropsychiatr. Vieil 6(2), 137-144 (2008).
- Taylor BP, Bruder GE, Stewart JW, et al. psychomotor slowing as a predictor of fluoxetine nonresponse in depressed outpatients. Am. J. Psychiatry 163(1), 73-78 (2006).
- Caligiuri MP, Ellwanger J. Motor and cognitive aspects of motor retardation in depression. J. Affect. Disord 57(1-3), 83-93 (2000).
- Rogers D, Lees AJ, Smith E, et al. Bradyphrenia in Parkinson’s disease and psychomotor retardation in depressive illness. An experimental study. Brain 110(Pt 3), 761-776 (1987).
- Rogers MA, Bradshaw JL, Phillips JG, et al. Parkinsonian motor characteristics in unipolar major depression. J. Clin. Exp. Neuropsychol 22(2), 232-244 (2000).
- Walther S, Höfle O, Federspiel A, et al. Neural correlates of disbalanced motor control in major depression. J. Affect. Disord 136(1-2), 124–133 (2012).
- Iacoboni M, Woods RP, Brass M, et al. Cortical mechanisms of human imitation. Science 286(5449), 2526-2528 (1999).
- Shen T, Li C, Wang B, et al. Increased Cognition Connectivity Network in Major Depression Disorder: A fMRI Study. Psychiatry Investig 12(2), 227-234 (2015).
- Bracht T, Federspiel A, Schnell S, et al. Cortico-Cortical White Matter Motor Pathway Microstructure Is Related to Psychomotor Retardation in Major Depressive Disorder. PlosONE 7(7), e52238 (2012).
- Leppänen JM, Milders M, Bell JS, et al. Depression biases the recognition of emotionally neutral faces. Psychiatry Res 128(2), 123-133 (2004).
- Suslow T, Junghanns K, Arolt V. Detection of facial expressions of emotions in depression. Percept. Mot. Skills 92(3), 857-868 (2001). https://doi.org/10.2466/pms.2001.92.3.857
- Hasher L, Stoltzfus ER, Zacks RT, et al. Age and inhibition. J. Exp. Psychol. Learn. Mem. Cogn 17(1), 163-169 (1991).
- Koss E, Ober BA, Delis DC, et al. The Stroop color-word test: indicator of dementia severity. Int. J. Neurosci 24(1), 53-61 (1984).
- Sass SM, Heller W, Fisher JE, et al. Electrophysiological evidence of the time course of attentional bias in non-patients reporting symptoms of depression with and without co-occurring anxiety. Front. Psychol 5(1), 301 (2014).
- Amieva H, Lafont S, Auriacombe S, et al. Inhibitory breakdown and dementia of the Alzheimer type: a general phenomenon?. J. Clin. Exp. Neuropsychol 24(4), 503-516 (2002).
- Carvalho N, Laurent E, Noiret N, et al. Eye Movement in Unipolar and Bipolar Depression: A Systematic Review of the Literature. Front. Psychol 6(1), 1809 (2015).
- Snyder HR, Banich MT, Munakata Y. All competition is not alike: neural mechanisms for resolving underdetermined and prepotent competition. J. Cogn. Neurosci 26(11), 2608-2623 (2014).
- Alexopoulos GS, Kiosses DN, Heo M, et al. Executive dysfunction and the course of geriatric depression. Biol. Psychiatry 58(3), 204–210 (2005).
- Potter GG, Kittinger JD, Wagner HR, et al. Prefrontal neuropsychological predictors of treatment remission in late-life depression. Neuropsychopharmacology 29(1), 2266-2271 (2004).
- Cai W, Ryali S, Chen T, et al. Dissociable roles of right inferior frontal cortex and anterior insula in inhibitory control: evidence from intrinsic and task-related functional parcellation, connectivity, and response profile analyses across multiple datasets. J. Neurosci 34(44), 14652–14667 (2014).
- Tse WS, Bond AJ. The Impact of Depression on Social Skills: A Review. J. Nerv. Ment. Dis 192(4), 260 (2004).
