Research Article - Clinical Practice (2021) Volume 18, Issue 1
Perfusion lung scan after pulmonary artery endarterectomy in patients with chronic thromboembolic pulmonary hypertension
- Corresponding Author:
- Ahmed Fathala Department of Radiology, Nuclear Medicine and Cardiovascular Imaging, King Faisal Specialist Hospital & Research Center, Saudi Arabia E-mail: ahm35799@hotmail.com
Abstract
Background: The gold standard screening test for Chronic Thromboembolic Pulmonary Hypertension (CTEPH) is the Ventilation/Perfusion Lung (VQ) scan. Pulmonary Artery Endarterectomy (PEA) is the treatment of choice for CTEPH. The appearance of VQ scan post-PEA is unknown Objective: The main aim of this study was to investigate the rule of the VQ scan and its correlation with other clinical parameters before and after PEA. Methods: In total, 42 consecutive patients aged over 18 years with definitive CTEPH with and high-probability VQ scan and mean pulmonary artery pressure of more than 25 mm HG who underwent PEA. Results: The mean age was 40 ± 10 years, and mean of total perfusion defects before and after PEA was 40 ± 9% and 17 ± 14% (p=0.0001), respectively. Patients with NYHA class 1 were considered respondents, but patient with NYHA class 2 and higher were considered non-respondents. There was no significant correlation between VQ perfusion between respondents and non-respondents (p=0.2414) after PEA. Patients with a 50% or greater improvement in the 6MWD after PEA were considered respondents, but patients with a less than 50% improvement in the 6MWD after PEA were considered non-respondents, and there was a significant correlation between respondents and non-respondents (p=0.0004). Conclusions: PEA for patients with CTEPH results in a significant improvement in lung perfusion abnormalities, the 6MWD, and NYHA functional class. There was a strong correlation between postoperative improvements of the lung perfusion abnormalities and the 6MWD, but no correlation with NYHA functional class.
Keywords
chronic thromboembolic pulmonary hypertension, ventilation/perfusion lung scan, pulmonary artery endarterectomy, New York Heart Association functional class, Six-minute walks distance
Introduction
The gold standard screening test for Chronic Thromboembolic Pulmonary Hypertension (CTEPH) is the Ventilation/Perfusion Lung (VQ) scan, with a sensitivity of more than 96% compared with only 51% for Computed Tomography Pulmonary Angiography (CTPA) [1]. The VQ scan in CTEPH reveals multiple wedge-shaped perfusion defects with normal ventilation. A normal or low-probability VQ scan effectively excludes CTEPH with a sensitivity of 90%-100% and a specificity of 94%-100% [2]. A normal VQ scan or small peripheral unmatched or non-segmental defect is commonly seen in Pulmonary Arterial Hypertension (PAH) [3], and it has been observed that a relatively normal VQ san excludes the diagnosis of surgically accessible CTEPH [4]. Caution must be exercised in interpreting VQ scan, because there are several other diseases that can mimic CTEPH in VQ scan. For example, patients with small vessels or pulmonary vascular disease, a perfusion scan was either normal or demonstrated a mottled appearance characterized by nonsegmental defects [5]. Exceptions include cases of pulmonary veno-occlusive disease or capillary hemangiomatosis, in which multiple larger mismatched defects have been reported [6,7]. Despite the higher sensitivity of the VQ scan in detecting CTEPH, it is underutilized and it should be used more frequently in pulmonary hypertension patients. An analysis of the Pulmonary Hypertension (PH) registry revealed that 43% of patients diagnosed with PAH never received a VQ scan [8]. Pulmonary Artery Endarterectomy (PEA) is the treatment of choice for CTEPH [9]. The surgery can be curative in a large number of patients, with a resolution of PH [10]. PEA leads to major clinical improvements due to improved hemodynamic parameters and reduced dead space ventilation [11]. Currently, little is unknown VQ scan and it is unknown whether the VQ scan post-PEA completely normalized or partially improved with residual perfusion abnormalities after PEA. Therefore, the aim of this retrospective study is to investigate the rule of the VQ scan before and after PEA and to compare the VQ scan before and after PEA and its correlation with other clinical parameters, such as the New York Heart Classification (NYHA) functional class and 6-Minute Walk Distance (6MWD).
Materials and Methods
■ Patients
This study was a single-center retrospective observational study, it was conducted in a tertiary care center, and it was approved by the hospital ethics committee. Between January 2013 and June 2016, 42 consecutive patients aged over 18 years with documented CTEPH by high probability VQ scan and mean pulmonary artery pressure more than 25 mm HG upon Right Heart Catheterization (RHC) who underwent Pulmonary Artery Endarterectomy (PEA).
■V/Q scintigraphy
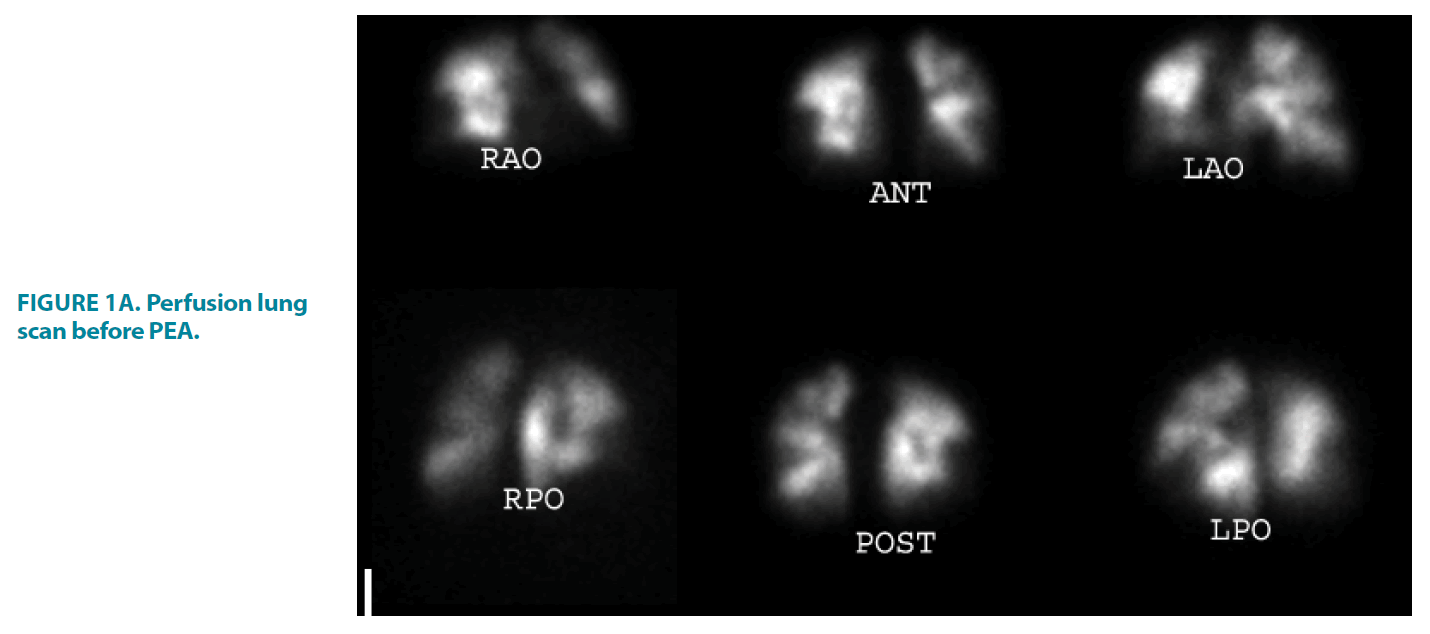
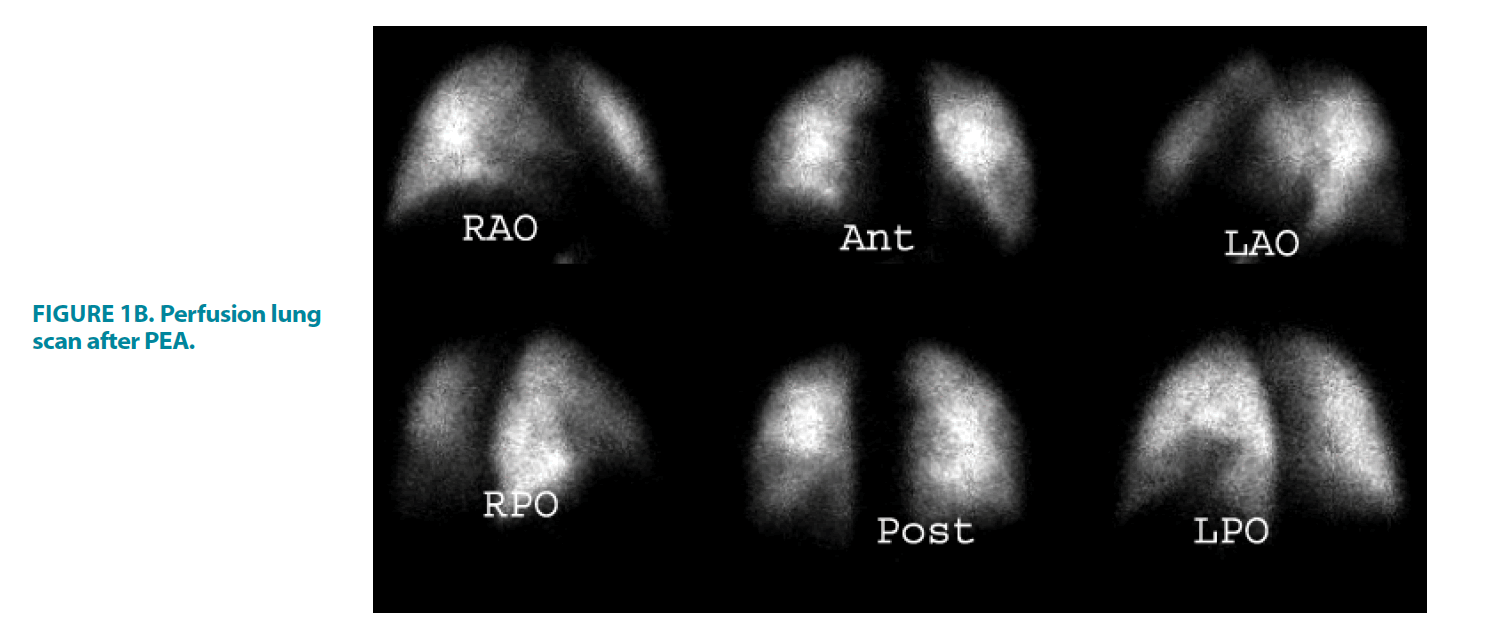
The VQ scan was performed using Tc-labeled macroaggregated albumin (99mTc-MAA) and 81 Kr gas; images were acquired using Symbia E dual head camera (Siemens Medical Solution, USA, inc.). The perfusion images were acquired after administration of 100 MBq of Tc-MAA with the patient in supine position. The images were reviewed in standard 4 projections (anterior, posterior, right posterior oblique, left posterior oblique). The ventilation images with 81 Kr were acquired in the same standards view as perfusion images, Kr was inhaled via mouthpiece, and the Images were interpreted according to the modified PIOPED criteria by experienced nuclear medicine physicians [12]. The extent and percentage of perfusion abnormalities were calculated as previously described by Ryan et al. with modifications; the right lung consisted of 10 segments and the left lung of 8 segments [13]. Each segment was assigned a score based on the severity and the extent of the perfusion abnormalities, a score of 2 for the total absence of perfusions in the entire segment, a score of 1 for partial or mild to moderate decreased perfusion, and a score of 0 for normal perfusion. The maximum abnormal perfusion score of the right lung is 20 and 16 for the left lung, and the percentage of the total lung perfusion defect was obtained by dividing the total score of the perfusion abnormalities in both lungs by 36 and multiplying that by 100 FIGURE 1A AND FIGURE 1B [13].
FIGURE 1A. Perfusion lung scan before PEA.
FIGURE 1B. Perfusion lung scan after PEA.
23-year-old female with extensive bilateral perfusion defects, ventilation images were normal, the findings consistent with CTEPH, the calculated perfusion score before PEA was 47% that improved to 11% post PEA, the score was calculated as follow:
The Right Lung: Right upper lobe; apical segment 1, Right Medial Lobe 2; Right lower lobe; posterior basal 2, lateral basal 2, anterior basal 2, Total score of the right lung perfusion defects=9.
The Left lung: Left upper lobe; apical posterior 1, apical anterior 1, inferior lingual 2, Left lower lobe; anteromedial basal2, lateral basal 2, Total score of the left lung perfusion defects=8.
Total % of the both lungs defects before PEA is 17/36 × 100=47%
Right Lung: Right medial lobe; right lateral 1; Right lower lobe, right anterior basal 1, Total score of the right lung perfusion defects=2.
The left Lung: left lower lobe, anteromedial basal 1, lateral basal 1, Total score of the left lung perfusion defects=2
Total % of the both lungs defects post PEA is 4/36 × 100=11%
■New York Heart Association
Each patient was functionally classified according to the NYHA classification of the World Heart Organization before and after PEA [14].
■ Six-Minute Walk Test
The 6MWD was performed in all patients according to the guidelines of the American Thoracic Society [15]. All tests were supervised by a respiratory function technologist encouraging subjects with standard phrases, as stated in the American Thoracic Society protocol.
■Pulmonary Endarterectomy
The surgical procedure of PEA was performed, as it has been previously well established and described [10,16].
■Right Heart Catheterization
RHC was performed in all patients before PEA as previously described [17]. During RHC, hemodynamic parameters, such as PAP, right atrial pressure, pulmonary capillary wedge pressure, and right ventricular pressure were obtained.
■Statistical Analysis
Descriptive statistics were reported as means ± standard deviations. In addition, a paired samples t-test was used to evaluate the significance of the change in means for the before-after design, and the significance of the association between categorical variables was tested using Pearson’s Chi-square test. The type I error rate was set at 5%, and the SPSS-IBM commercial program was used in the statistical analyses of our data.
Results
The total study population was 42 patients (26 women and 16 men). The mean age was 40 ± 10 years, and the mean body weight was 79 ± 20 kg. The mean time interval of VQ from PEA was 10 ± 8 months. The mean percentage of perfusion defects before PEA was 40% ± 9. TABLE 1 demonstrates the demographic data of the study population and other clinical parameters. The VQ scan results, NYHA class, and 6MWD before and after PEA are shown in TABLE 2. The mean of perfusion defects before and after PEA was 40% ± 9 and 17% ± 14, respectively, with a p value of 0.0001. The mean NYHA class before and after PEA was 2.9 ± 8 and 1.4 ± 0.7, respectively (p=0.0001). The mean 6MWD before and after PEA was 257 m ± 146 and 403 m ± 107, respectively, with a p value of 0.0001.
| Factors | Total Number % |
|---|---|
| Gender | |
| Female | 26 (62%) |
| Male | 16 (38%) |
| Age, years | 40 +/- 10 |
| Body weight, Kg | 79 +/- 20 |
| Time of VQ from PEA, months | 10 ± 8 |
| Perfusion defects, % VQ scan | 40 ± 9 |
| NYHA Class | 2.9 ± 0.8 |
| II | 2 (5%) |
| II | 9 (21%) |
| III | 21 (50%) |
| IV | 10 (24) |
| 6-MWD (m) | 257 ± 146 |
| m PAP (mm hg) | 54 ± 2 |
| PVR (dyn.s.cm) | 718 ± 112 |
| Cardiac Index (L.min.m) | 2.0 ± 1.1 |
| VQ: ventilation perfusion lung scan; PEA: Pulmonary Endarterectomy; NYHA: New York Heart Association Functional Class, PVR: Pulmonary Vascular Resistance; 6-MWD: 6 Minute Walk Distance, mPAP: Mean Pulmonary Artery Pressure. Values expressed as mean with standard deviation. | |
TABLE 1. Patient characteristics before PEA, Total study Population (N) 42.
| Before PEA | After PEA | p-Value | |
|---|---|---|---|
| Mean perfusion defects % | 40 ± 9 | 17 ± 14 | 0.0001 |
| NYHA class | 2.9 ± 0.8 | 1.4 ± 0.7 | 0.0001 |
| NYHA 1 | 2 | 29 | |
| NYHA 2 | 9 | 9 | |
| NYHA 3 | 21 | 4 | |
| NYHA 4 | 10 | 0 | |
| 6MWD,m | 257 ± 146 | 403 ± 107 | 0.0001 |
| VQ: Ventilation Perfusion Lung Scan; m: meter; PEA: Pulmonary Endarterectomy; NYHA: New York Heart Association Functional Class; 6-MWD: 6 Minute Walk Distance. Values expressed as mean with standard deviation | |||
TABLE 2. Comparison between VQ scan, 6MWD, and NYHA class before and after PEA, N=42.
■The relationship between NYHA class and the 6MWD before and after PEA with perfusion defects
Patients with NYHA class 1 were considered respondents, but patients with NYHA class 2 and higher were considered non-respondents. There were 29 respondents versus 13 non-respondents, where the mean improvement in perfusion defects among respondent was 18.4 ± 15.6 and non-respondents was 12.8 ± 9.2, respectively, with no statistically significant difference (p=0.2414). All patients with a 50% or more improvement in the 6MWD after PEA were considered respondents, while patients with a less than 50% improvement in the 6MWD after PEA were considered non-respondents. There were 22 respondents versus 20 nonrespondents. The percentage of improvement in lung perfusion defects among respondents and non-respondents was 25% ± 16% versus 9.4% ± 7%, respectively (p=0.0004; TABLE 3).
| Mean Improvement of perfusion defect % after PEA | p-Value | |
|---|---|---|
| NYHA class after PEA | 0.2414 | |
| Respondents (group 1) ,N=29 | 18.4 ± 15.6 | |
| Non-respondents (group 2 and more ), N=13 | 12.8 ± 9.2 | |
| 6MWD after PEA | 0.0004 | |
| >50% improvement, N=22 | 25 ± 16 | |
| <50% improvement=20 | 9.4=+/-7 | |
| VQ: Ventilation Perfusion Lung Scan; PEA: Pulmonary Endarterectomy; NYHA: New York Heart Association Functional Class; 6-MWD: 6 Minute Walk Distance.Values expressed as mean with standard deviation. | ||
Discussion
Our study results demonstrate an improvement in lung perfusion abnormalities after PEA in patients with CTEPH and improvement of both NYHA functional class and the 6-MWD after PEA. This is the first study to investigate the appearance of the VQ scan before and after PEA in patients with CTEPH. Our data showed a significant improvement in lung perfusion defects after PEA, where the mean of perfusion abnormalities before PEA was 49% ± 9%, which improved to 17% ± 14% (p=0.0001). In the prospective international CTEPH registry, 99.4% of patients had evidence of perfusion abnormalities with a VQ scan [18]. Although there was a significant improvement in lung perfusion abnormalities after PEA, the mean percentage of lung perfusion abnormalities after PEA was 17% ± 14, indicating residual perfusion abnormalities and most likely persistent pulmonary hypertension after PEA in patients with an improved 6MWD and a downward shift in NYHA class. Although PEA is the gold standard treatment for CTEPH, the disease process is complex, and several patients present with residual or persistent PH after PEA [19,20]. This can be explained by the two-compartment model proposed by Moser and Braunwald in 1973 [21]. In this model, patients with operable CTEPH may develop a distal, secondary, small vessel arteriopathy in the non-obstructed vascular bed [22]. Furthermore, prior studies have demonstrated that, postoperatively, CTEPH patients commonly develop new perfusion scan defects due to the “vascular steal” phenomenon that occurs almost exclusively in lung segments that preoperatively were normally perfused by lung scans, were served by normal segmental arteries by pulmonary angiography, and, at surgery, and were uninvolved with thrombi by direct inspection [23]. Jujo et al. reported that a vascular alteration in the muscular arterioles could closely relate to an evaluation of mean PAP, and PVR after PEA in CTEPH patients with severe pulmonary arteriopathy might be related to residual pulmonary hypertension after PEA [24]. The presence of the vascular remodeling of the pulmonary arteries and severe pulmonary arteriopathy might explain the residual perfusion abnormalities post-PEA. Although most patients with CTEPH enjoy a significantly improved hemodynamic state and improved functional class, residual pulmonary hypertension (PVR, dynes.s-1 Cm-5) after surgery causes early postoperative mortality and morbidity. In the international CETEPH registry, residual PH affected 16.7% of patients and was associated with a higher mortality [18]. Additionally, a correlation of VQ scan findings with PAP and PVR patients who underwent PEA is unknown, but it is well known that based on UK national cohort data, higher mPAP, right atrial pressure, and PVR values and a lower cardiac index were significantly correlated with long-term survival in multivariate analyses [25].
■Post-operative 6-MWD, NYHA functional class, and ventilationperfusion scan
Our study confirmed that PEA results in a significant increase in the 6MWD after surgery, where the preoperative 6MWD increased from 257 ± 146 m to 403 ± 107 m (p=0.0001). Similarly, there was a significant improvement in NYHA class from 2.9 ± 8 to 1.4 ± 7 (p= 0.0001). This result is in agreement with prior studies. Reesink et al. reported one year after PEA that the 6MWD increased from 417 ± 9 m to 517 ± 16 m (p=0.0001) and the change in NYHA functional class correlated significantly with the change in the 6MWD (p=0.02) [26]. Similarly, Madani et al. reported that a PEA for patients with CTEPH results in a significant hemodynamic improvement, with favorable outcomes achievable even in patients with distal segmental thromboembolic disease [10]. In a recent meta-analysis, 11 studies reported improvements in the 6MWD after PEA in patients with CTEPH, and six studies reported a significant reduction in the number of patients with NYHA class 3 and 4 after PEA [27]. There was a strong correlation between the postoperative 6MWD and the perfusion lung scan in patients with a 50% or greater improvement in the 6MWD post-PEA.
■ Ventilation perfusion lung scan in CETPH
The VQ scan is the preferred and recommended screening test for CTEPH in patients with PH. CTPA screening may lead to a potential misdiagnosis of pulmonary arterial hypertension and underdiagnoses of CTEPH, including in patients with distal disease [28], based on the prior studies. The overall agreement between pulmonary angiography and VQ perfusion defects was excellent, although when embolic event involvement was extensive (greater than 50% angiographic obstruction), the perfusion scan moderately underestimated (4%) the defect seen angiographically. However, it was concluded that the VQ scan is a reliable method of assessing pulmonary vascular obstruction in patients with CTEPH [29]. In contrast, Ryan et al. repeated that perfusion scan defects are consistently underestimated, often markedly, as well as the degree of vascular obstruction defined by pulmonary angiography [13]. We believe that the disparity between perfusion defects and pulmonary angiography is because all prior studies comparing the VQ scan with pulmonary angiography were performed with planar VQ. On planar imaging, the detection of a segmental defect is highly dependent on the camera position and the anatomical location of the defect that can be potentially masked if superimposed over lung regions with normal perfusion. SPECT VQ may overcome these limitations, and Solar and colleagues compared planar and SPECT VQ scans in patients with CTEPH. SPECT VQ had a significantly higher sensitivity for detecting vascular defects than planar VQ, without changes in SPECT specificity [30].
■Study limitations
The limitations of this study are in its retrospective observational single-center design with small number of patients. A correlation with postoperative lung scans and postoperative hemodynamics was not identified because most patients did not undergo a hemodynamic evaluation. The perfusion lung scan was performed with the planar VQ scan, but compared to the planar VQ scan; VQ SPECT would allow a more accurate diagnosis of CTEPH while differentiating other lung diseases, such as chronic obstructive lung disease, interstitial lung disease, and venoocclusive disease.
Conclusion
Taken together, PEA for patients with CTEPH results in a significant improvement in lung perfusion abnormalities, the 6MWD, and NYHA functional class. There is a strong correlation between a postoperative improvement in lung perfusion abnormalities and the 6MWD, but no correlation between lung perfusion abnormalities and NYHA functional class. Further prospective studies are highly recommended to investigate the optimal role of VQ scan after PEA, the role of VQ scan as a predictor for short and long term survival, and correlation of VQ scan with other clinical and hemodynamic parameters after PEA.
References
- Laser Hair Removal. [Available from: https://www.cntaaclinic.ca/laser-hair-removal]
- Laser Hair Removal. [Available from: https://www.webmd.com/beauty/laser-hair-removal#1]
- Haedersdal M, Wulf HC. Evidence‐based review of hair removal using lasers and light sources. J Eur Acad Dermatol Venereol. 20: 9-20 (2006).
- Liew SH. Laser Hair Removal. Am J Clin Dermatol. 3: 107-115 (2002).
- Different hair removal lasers part. [Available at: https://www.skinneymedspa.com/different-hair-removal-lasers-part-i/]
- Chandrashekar BS, Shenoy C, Madura C. Complications of laser and light-based devices therapy in patients with skin of color. Indian J Dermatol Venereol Leprol. 85: 24-31 (2019).
- What are the rare risks, side effects, complications of laser hair removal. [Available from: http://oksociety.in/2019/07/what-are-the-rare-risks-side-effects-complications-of-laser-hair-removal/]
- Lapidoth M, Shafirstein G, Amitai DB, et al. Reticulate erythema following diode laser-assisted hair removal: a new side effect of a common procedure. J Am Acad Dermatol. 51: 774-777 (2004).
- Aleem S, Majid I. Unconventional uses of laser hair removal: A review. J Cutan Aesthet Surg. 12: 8-16 (2019).
- Gabriel CV, Cristiana V, Elena B, et al. Complications of laser hair removal‐How we could reduce them?. Dermatol Ther. 33: e13518 (2020).
- Desai S, Mahmoud B, Bhatia A, et al. Paradoxical hypertrichosis after laser therapy: A review. Dermatol Surg. 36: 291-298 (2010).
- Elisa RT, Caterina F, Angela BM, et al. Axillary fox-fordyce disease induced by laser hair removal. J Dermatol Res Ther. 5: 071 (2019).
- Vasconcelos R, Sanches JA. Axillary hyperhidrosis and bromhidrosis: The dermatologist’s point of view. Hyperhidrosis. 89-94 (2018).
- Laser hair removal: Strategies, types and uses. [Available from: https://nursinganswers.net/essays/laser-hair-removal-strategies-types-7161.php].
- Laser hair removal pre and post treatment care. [Available at: https://www.simplicitylaser.com/pages/laser-hair-removal-pre-post-treatment-care].
- Anderson RR, Parrish JA. Selective photothermolysis: Precise microsurgery by selective absorption of pulsed radiation. Science. 220: 524-527 (1983).
- Boulnois JL. Photophysical processes in recent medical laser developments: A review. Med Sci. 1: 47-66 (1986).
- Vano-Galvan S, Jaen P. Complications of nonphysician-supervised laser hair removal: case report and literature review. Can Fam Physician. 55: 50-52 (2009).
- Nelson JS, Majaron B, Kelly KM. Active skin cooling in conjunction with laser dermatologic surgery. Semin Cutan Med Surg. 19: 253-266 (2000).
- Adamic M, Troilius A, Adatto M, et al. Vascular lasers and IPLS: Guidelines for care from the European Society for Laser Dermatology (ESLD). J Cosmet Laser Ther. 9: 113-124 (2007).
- Zenzie HH, Altshuler GB, Smirnov MZ, et al. Evaluation of cooling methods for laser dermatology. Lasers Surg Med. 26: 130-144 (2000).
- Goldman MP. Lasers and Energy Devices for the Skin. 2nd Ed. Boca Raton: CRC Press. 100 (2013).
- Srinivas CR, Kumaresan M. Lasers for vascular lesions: Standard guidelines of care. Indian J Dermatol Venereol Leprol. 77: 3490-3468 (2011).
- Raulin C, Greve B, Hammes S. Cold air in laser therapy: First experiences with a new cooling system. Lasers Surg Med. 27: 404-410 (2000).
- Manuskiatti W, Eimpunth S, Wanitphakdeedecha R. Effect of cold air cooling on the incidence of postinflammatory hyperpigmentation after Q-switched Nd: YAG laser treatment of acquired bilateral nevus of Ota like macules. Arch Dermatol. 143: 1139-1143 (2007).
Journal Metrics:
| Impact Factor: | 12.24 |
| Journal Citescore: | 10.62 |
| h-index: | 29 |
| PubMed NLM ID: | 101579384 |
| Journal Acceptance Rate: | 40% |
| Article processing time : | 30-45 Days |
Google Scholar citation report
Citations : 3847
Clinical Practice received 3847 citations as per Google Scholar report
Clinical Practice peer review process verified at publons
Indexed In
