Review Article - Imaging in Medicine (2010) Volume 2, Issue 5
Radiologic manifestation of hepatic pseudolesions and pseudotumors in the third inflow area
Satoshi Kobayashi†1, Toshifumi Gabata1 & Osamu Matsui11Department of Radiology, Kanazawa University School of Medicine, 13-1, Takara-machi, Kanazawa 920-8641, Japan
- Corresponding Author:
- Satoshi Kobayashi
Department of Radiology
Kanazawa University School of Medicine
13-1, Takara-machi, Kanazawa 920-8641, Japan
Tel: +81 762 652 323
Fax: +81 762 344 256
E-mail: satoshik@staff.kanazawa-u.ac.jp
Abstract
Hepatic pseudolesions and pseudotumors of the third inflow area are sometimes encountered on imaging. Generally, differentiating these lesions of true hepatic neoplasm on radiological examinations is easy with the knowledge of common sites in the liver and characteristic indications of these lesions. However, they occasionally mimic hepatocellular carcinoma in various imaging modalities. In this article, we provide current knowledge regarding pseudolesions and pseudotumors in the third inflow area on imaging. Knowledge regarding pseudolesions and pseudotumors in the third inflow area can aid correct diagnosis and avoid unnecessary treatment.
Keywords
aberrant gastric venous drainage ▪ CT during arterial portography ▪ CT during hepatic arteriography ▪ focal fatty liver ▪ focal hyperplastic change ▪ focal sparing of fatty liver ▪ parabiliary venous system ▪ pseudolesion ▪ pseudotumor ▪ third inflow
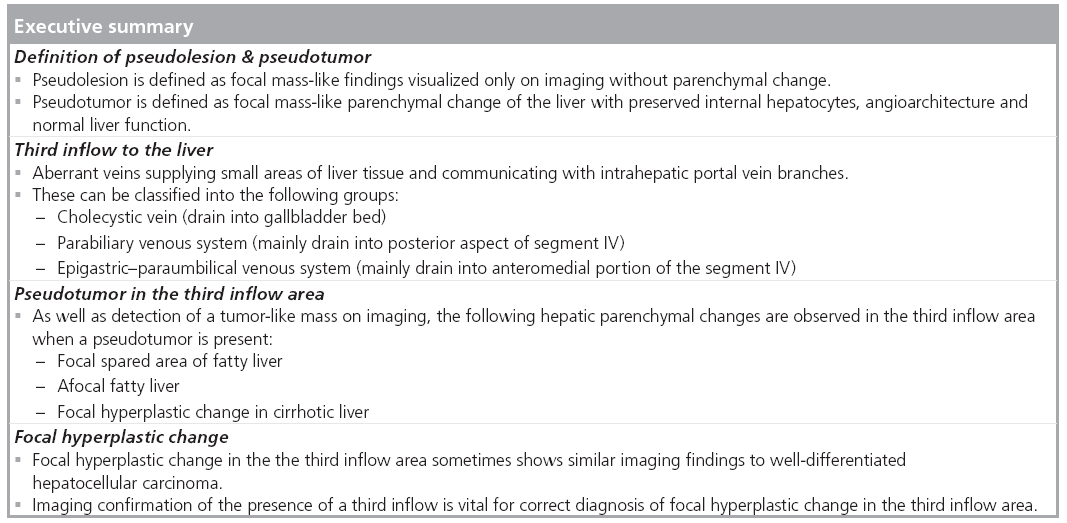
Various types of pseudolesions (focal mass-like findings seen only on imaging) or pseudotumors (focal mass-like parenchymal change) are observed in the liver. In order to accurately diagnose true mass lesions based upon imaging, it is necessary to exclude these entities. Pseudolesions or pseudotumors observed in the third inflow area occasionally mimic hepatocellular carcinoma (HCC) in various imaging modalities. In this article, we review the etiology and characteristic findings of hepatic pseudolesions and pseudotumors in the third inflow area.
Overview of liver hemodynamics
The liver has a dual blood supply consisting of the hepatic artery and portal vein. Approximately 75% of the hepatic blood supply comes from the portal vein and 25% from the hepatic artery. Portal venous flow primarily supplies hepatic sinusoids, while terminal hepatic arterial branches form peribiliary vascular plexuses, which supply the bile ducts that then drain into hepatic sinusoids. Both vascular systems have several communications between them, including transsinusoidal, transvasal and transplexal routes [1]. These communications allow reciprocal and complementary supporting mechanisms of blood supply between portal venous flow and hepatic arterial flow. The transplexal route is believed to be the dominant pathway in the setting of portal vein obstruction, occlusion or increased sinusoidal pressure. Owing to its dual blood supply, liver infarction is uncommon under physiological conditions.
Angiography-assisted CT for analysis of hepatic hemodynamics
Matsui et al. first introduced CT with arterial portography (CTAP) for the whole liver for the precise detection of hepatic neoplasms [2].
CT with arterial portography is considered the most sensitive modality for detection of small hepatic lesions, particularly small hepatic tumors, such as HCC and metastatic tumors. CT during hepatic arteriography (CTHA) can demonstrate both hyper- and hypo-vascular tumors, and can estimate the grade of malignancy of nodular hepatocellular lesions in cirrhotic livers [3–5].
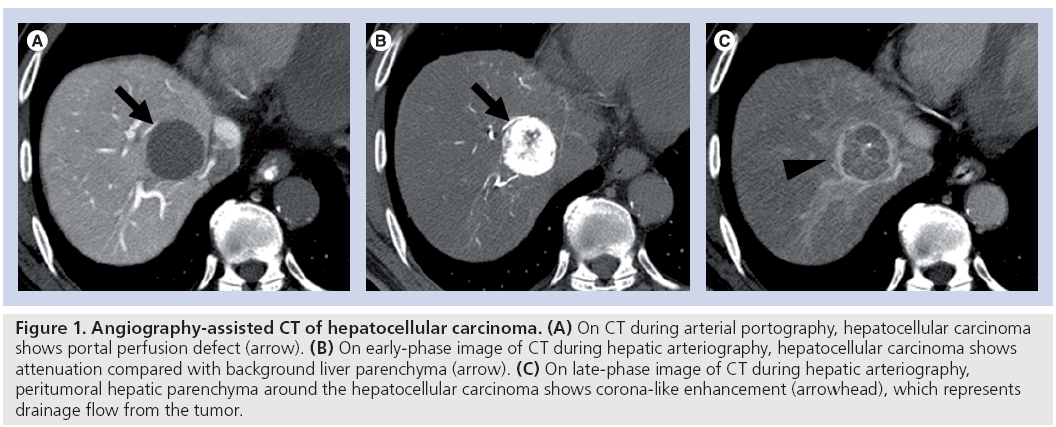
These techniques are based on the different characteristics of the blood supply to the liver parenchyma and hepatic neoplasm. That is, hepatic parenchyma is mainly supplied by portal venous flow, while most hepatic lesions (e.g., HCC and metastatic liver tumors) are supplied by hepatic arterial flow. Therefore, on CTAP images, most hepatic lesions show a portal perfusion defect and appear as a hypodense lesion within opacified normal hepatic parenchyma. In addition, using CTHA, most metastatic liver tumors and HCC show some degree of hyperdensity within the relatively hypodense hepatic parenchyma. Furthermore, some precancerous lesions and well-differentiated HCCs in cirrhotic livers are depicted as a hypodense mass compared with the hepatic parenchyma (Figure 1).
Figure 1: Angiography-assisted CT of hepatocellular carcinoma. (A) On CT during arterial portography, hepatocellular carcinoma shows portal perfusion defect (arrow). (B) On early-phase image of CT during hepatic arteriography, hepatocellular carcinoma shows attenuation compared with background liver parenchyma (arrow). (C) On late-phase image of CT during hepatic arteriography, peritumoral hepatic parenchyma around the hepatocellular carcinoma shows corona-like enhancement (arrowhead), which represents drainage flow from the tumor.
Details of CTAP and CTHA procedures are as follows. From the femoral artery, 4-F catheters are inserted into the superior mesenteric artery for CTAP, and into the common, proper or replaced right hepatic artery for CTHA.
CT with arterial portography scans were obtained in sections of 5–7-mm thickness and 5–7-mm collimation to cover the entire liver in a single patient breath. To increase blood flow and decrease laminar flow in the portal vein, 5 μg of prostaglandin E1 (Palux; Taisho, Tokyo, Japan) was injected into the superior mesenteric artery prior to contrast material infusion. A total of 50–70 ml of iohexol (320–350 mg/ml iodine) (Omnipaque; Daiichi, Tokyo, Japan) was infused at a rate of 1.8 ml/s with a power injector. Helical scanning began 25 s after infusion.
CT during hepatic arteriography scans were obtained in sections of 3–5-mm thickness and 3–5-mm collimation. Helical scanning was started 7 s after the beginning of an iohexol infusion (320–350 mg/ml iodine) into the common, proper or replaced hepatic artery at a rate of 1.8 ml/s. Contrast infusion was continued until 5 s after early-phase CTHA scanning was completed. Scanning time varied according to the individual liver size (~20–25 s). The total amount of contrast medium varied according to the following equation:
(early-phase scanning time +12s)× injection rate
Around 30 s after contrast material infusion finished (~62–67 s after the infusion began), late-phase scanning started.
Owing to the fact that CTAP is very sensitive at detecting areas of decreased regional intrahepatic portal flow, various types of pseudolesions mimicking true space-occupying lesions in the liver have also been reported [6]. Owing to the invasiveness of the procedure and the relatively high incidence of pseudolesions, the use of this technique in western countries is limited. In other words, CTAP is not a commonly performed procedure in the USA nor in many other countries. However, in Japan, CTAP and CTHA are still performed for closer examination of HCCs and related nodular lesions such as dysplastic nodules, as it enables us to estimate the grade of malignancy of nodular hepatocellular lesions in cirrhotic livers [3–5].
Pseudolesion of the liver
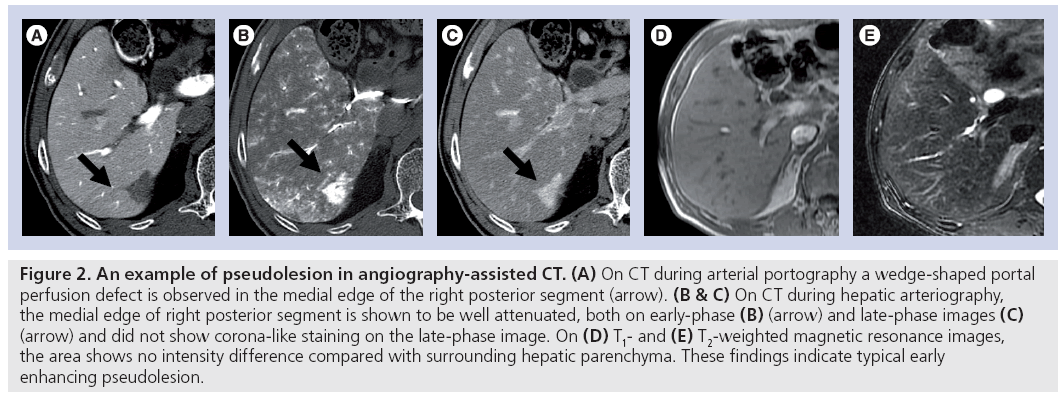
Pseudolesion is defined as a focal mass-like finding seen only on imaging studies without real parenchymal change. The pseudolesions seen at CTAP are usually caused by obstruction of the intrahepatic portal veins by tumors or other pathologic processes, arterioportal shunting from a variety of causes and laminar blood flow causing insufficient mixing of opacified and nonopacified portal blood (Figure 2) [6]. In the liver, these pseudolesions have been seen most frequently surrounding the gallbladder fossa, and at the posterior aspect of the medial segment, immediately anterior to the right portal vein.
Figure 2: An example of pseudolesion in angiography-assisted CT. (A) On CT during arterial portography a wedge-shaped portal perfusion defect is observed in the medial edge of the right posterior segment (arrow). (B & C) On CT during hepatic arteriography, the medial edge of right posterior segment is shown to be well attenuated, both on early-phase (B) (arrow) and late-phase images (C) (arrow) and did not show corona-like staining on the late-phase image. On (D) T1- and (E) T2-weighted magnetic resonance images, the area shows no intensity difference compared with surrounding hepatic parenchyma. These findings indicate typical early
Matsui et al. reported that drainage of cystic veins into the intrahepatic portal veins surrounding the gallbladder fossa may be the main cause of these pseudolesions. Areas in the liver drained by cystic veins occasionally appear as hypoattenuating areas on CTAP because the contrast medium in the portal blood from the superior mesenteric vein is diluted by blood from cystic veins, which does not contain contrast medium [7].
Peterson et al. reported that there are two characteristic locations of pseudolesions in the left lobe of the liver [8]. One is in the antero–medial aspect of the medial segment, which is a commonly recognized location of focal fatty change. The other is the posterior aspect of the medial segment, immediately anterior to the porta hepatis. Fernandez et al. reported that pseudolesions in the posterior aspect of the medial segment of the liver were found in 14% of CTAP examinations [9]. This region of the medial segment of the liver is known to be focally spared from fatty change [10]. These regions of the medial segment of the liver may receive collateral circulation and show portal perfusion defect on CTAP [8,9].
Classification of third inflow vessels & imaging findings of pseudolesion of the liver in the third inflow area
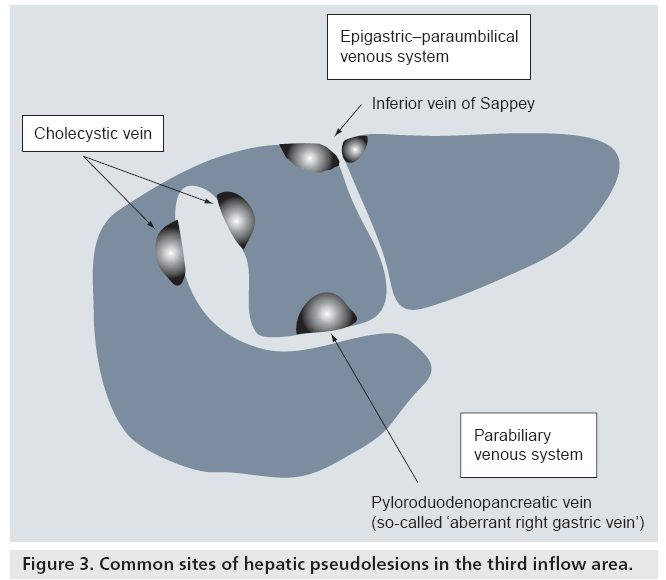
Usually, splanchnic venous flow, such as the drainage from the spleen and intestines, joins up with the portal vein and flows into the liver at the hepatic hilum. However, some of the venous flow does not join the portal vein in the extrahepatic portion, it directly enters the liver independently and then flows into the hepatic sinusoids. These are called ‘third inflow’ vessels to the liver (Figure 3). Dahnert defined the third inflow to the liver as follows: aberrant veins supplying small areas of liver tissue and communicating with intrahepatic portal vein branches [11].
There are two kinds of veins that supply venous blood to the liver: veins originating from a digestive organ, such as the cholecystic vein and parabiliary venous system, and systemic veins, such as the epigastric–paraumbilical venous system and capsular veins [12].
Pseudolesion in the drainage area of the parabiliary venous system
Matsui et al. summarized the previous descriptions regarding the parabiliary venous system as follows; in 1859, Sappey described a case in which the right gastric vein ascended parallel to the main portal vein and drained into the left lobe of the liver [6]. Because the right gastric vein branched out within the liver in the same manner as the portal vein, he regarded it as an accessory portal vein [13]. Michels also described the same type of large, aberrant right gastric vein draining into segment IV [14]. Couinaud described a venous network ascending along the arterial and biliary components of the main portal vein that was supplied by vessels originating from the pyloroduodenopancreatic veins. This was frequently seen in the hilum of the liver, which was called the parabiliary venous system [15].
Yoshimitsu et al. noted that, from an embryologic standpoint, the development of bile ducts, the parabiliary venous system, the hepatic artery, and segment I and IV of the liver occurs later than the major portion of the liver and the portal venous system [16]. This difference may account for why aberrant drainage of the parabiliary venous system occasionally occurs in segments I and IV.
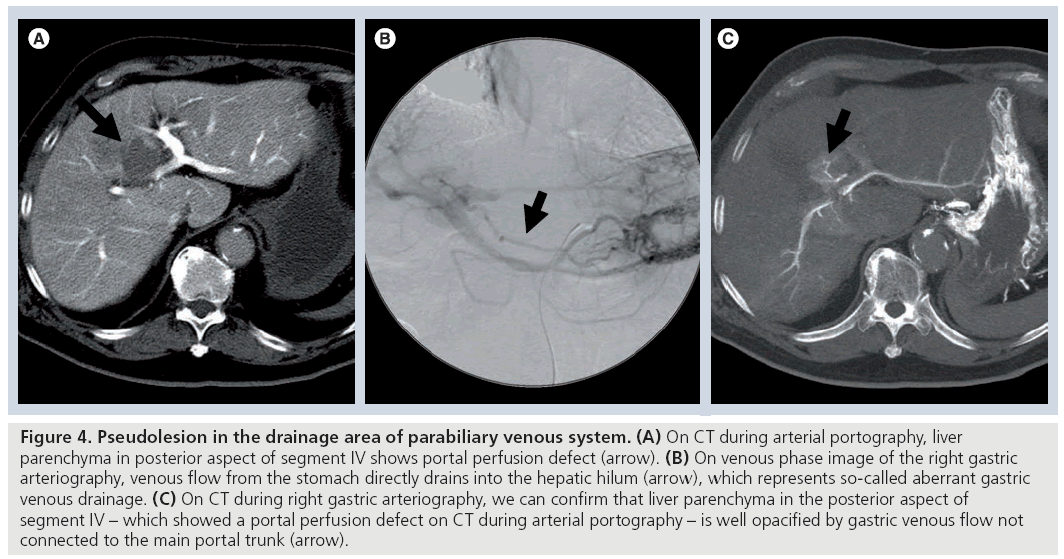
Although pseudolesions in the posterior aspect of segment IV of the liver on CTAP [8,9] have been reported, the drainage vessel flow into this area had not been revealed. In 1994, Matsui et al. first reported that the pyloroduodenopancreatic vein (so-called ‘aberrant right gastric vein’) drains directly into the posterior aspect of segment IV and causes a portal perfusion defect in this area on CTAP (Figure 4) [6]. Matsui et al. reported that the frequency of aberrant right gastric venous drainage into the posterior aspect of segment IV detected at imaging diagnosis is approximately 6–14% [6,9]. Pseudolesions from aberrant right gastric venous drainage are observed not only in the posterior aspect of segment IV, but also in segments II and III of the liver [17,18].
Figure 4: Pseudolesion in the drainage area of parabiliary venous system. (A) On CT during arterial portography, liver parenchyma in posterior aspect of segment IV shows portal perfusion defect (arrow). (B) On venous phase image of the right gastric arteriography, venous flow from the stomach directly drains into the hepatic hilum (arrow), which represents so-called aberrant gastric venous drainage. (C) On CT during right gastric arteriography, we can confirm that liver parenchyma in the posterior aspect of segment IV – which showed a portal perfusion defect on CT during arterial portography – is well opacified by gastric venous flow not connected to the main portal trunk (arrow).
In most cases, pseudolesions in the drainage area of the parabiliary venous system exhibit hypodensity on CTAP. However, Yoshikawa et al. reported a case of high-density pseudolesion in the posterior aspect of segment IV on CTAP [19]. This pseudolesion appeared as a high density area on CTAP because contrast media flowed into the pancreatic head via the dorsal pancreatic artery, arising from the superior mesenteric artery. Dense contrast material from the head of the pancreas flowed directly into the liver parenchyma via the pyloroduodenopancreatic veins, so the posterior aspect of segment IV appeared to be a higher density compared with the surrounding hepatic parenchyma. Although it is rare, pseudolesions of the liver in the third inflow area may appear hyperdense on CTAP.
Pseudolesion in the drainage area of the epigastric–paraumbilical venous system
This venous system consists of small veins around the falciform ligament that drain the anterior part of the abdominal wall directly into the liver. These small veins are divided into the following groups: superior vein of Sappey, inferior vein of Sappey and vein of Burow [20]. The superior vein of Sappey drains the upper portion of the falciform ligament and the medial part of the diaphragm. It enters the peripheral left portal vein branches and communicates with the superior epigastric and internal thoracic veins. The inferior vein of Sappey drains the lower portion of the falciform ligament. It enters the peripheral left portal vein branches and communicates with branches of the inferior epigastric vein around the umbilicus. The vein of Burow terminates in the middle portion of the collapsed umbilical vein, and communicates with branches of the inferior epigastric vein around the umbilicus. The inferior vein of Sappey and vein of Burow also have interconnecting veins.
Genchellac et al. described that hepatic pseudolesions around the falciform ligament are frequently encountered on portal-dominant phase multidetector-CT images, and the prevalence of pseudolesions around the falciform ligament was 20% (Figure 5) [21]. The presence of an inferior vein of Sappey supplying these pseudolesions was found to be 27%. Fatty infiltration was found in 29%.
Figure 5: Pseudolesion in the drainage area of the inferior vein of Sappey. (A) Precontrast, (B) portal-phase and (C) equilibriumphase contrast-enhanced CT. On multiphasic contrast-enhanced CT, liver parenchyma in the anteromedial portion of segment IV adjacent to the falciform ligament shows hypodense on portal phase image (B) (arrow) and equilibrium phase image (C) (arrow). However, on precontrast-enhanced CT, the area shows no attenuation difference compared with the surrounding hepatic parenchyma.
Ohashi et al. described that pseudolesions were seen on 64 of 472 (14%) helical CT scans, and 96% correlated with portal perfusion defects on CTAP [22]. The pseudolesions were not more enhanced than the surrounding liver parenchyma on CT arteriography with hepatic artery injection, but were enhanced in two patients on CT arteriography with internal thoracic artery injection.
The prevalence of pseudolesions around the falciform ligament (segment IV and/or III) is approximately 13–20% on biphasic contrastenhanced CT [23] and gadolinium (Gd)-enhanced MRI [24]. Irie et al. compared the prevalence of pseudolesions in cirrhotic and noncirrhotic livers on CTAP, and found that pseudolesions seen around the falciform ligament are significantly low in cirrhotic livers, but pseudolesions around the gallbladder and the posterior aspect of segment IV showed no difference between the two groups [25]. This suggests that in cirrhotic livers, since the parabiliary venous system (inferior vein of Sappey) acts as a collateral pathway for portal hypertension and shows hepatofugal flow, contrast material in the sinusoids around the falciform ligament are not diluted by the third inflow.
Pseudolesion in the drainage area of the cholecystic vein through the liver bed
Some parts of the small cholecystic venous branches enter the liver directly through the liver bed (segment IV and V), drain the liver parenchyma around the body and fundus of the gallbladder, and communicate with peripheral intrahepatic portal branches. They dilute the portal perfusion at these sites, resulting in the appearance of pseudolesions [16].
In 1987, Matsui et al. reported that the increased cystic venous drainage to the intrahepatic portal vein causes staining in the nondiseased gallbladder bed on hepatic arteriography [7]. Yamashita et al. also reported that transient focal increased attenuation of the liver may occur on CT scans in patients with acute cholecystitis [26]. This increased attenuation associated with acute cholecystitis has a typical location and pattern, and is probably attributed to hepatic arterial hyperemia and early venous drainage from the adjacent inf lamed gallbladder. This finding should be differentiated from hypervascular hepatic tumors (Figure 6). Ito et al. reported that, in gallbladder disease, the incidence of transiently increased attenuation around the gallbladder fossa and segments IV and V of the liver during arterial-phase helical or incremental CT is significantly increased compared with patients without gallbladder disease [27]. Moreover, on hepatic angiography, ten of the 22 patients showed early depiction of the dilated cystic vein (eight patients) and direct communication with the portal branches (two patients). Such increased cystic venous drainage to the gallbladder bed causes a portal perfusion defect on CTAP.
Figure 6: Pseudolesion in the drainage area of cholecystic vein. (A) Precontrast, (B) arterial-phase and (C) equilibrium-phase contrast-enhanced CT. On multiphasic contrast-enhanced CT, liver parenchyma in segment IV adjacent to the gallbladder shows early enhancement on arterial phase image (B) (arrow). However, on precontrast and equilibrium phase contrast-enhanced CT, the area shows no attenuation difference compared with the surrounding hepatic parenchyma. Coronal reconstruction of arterial phase-enhanced CT shows inflow of cystic vein into the hepatic parenchyma in segment IV adjacent to the gallbladder (D) (arrow).
Parenchymal changes caused by liver hemodynamic alteration (pseudotumor)
Pseudotumor is defined as a focal mass-like parenchymal change of the liver without timorous change, such as focal spared area, focal fatty change and focal hyperplastic change in cirrhotic liver.
Focal spared area
Various types of focal areas of decreased fatty infiltration in fatty liver (focal spared area) are well visualized by sonography and CT. One of the most common sites is the posterior edge of segment IV, just anterior to the right side of the hepatic hilum (Figure 7) [28,29]. Matsui et al. found a strong correlation between an aberrant right gastric venous drainage and the spared area at the posterior aspect of segment IV occasionally seen in fatty livers [30]. Focally decreased blood flow from the main portal vein, associated with aberrant right gastric venous drainage, is a likely cause of the focal spared area.
Figure 7: Focal spared area of fatty liver in third inflow area. (A) On ultrasound, the posterior aspect of the segment IV of the liver shows hypo-echo compared with surrounding liver parenchyma. (B) On precontrast-enhanced CT, posterior aspect of the segment IV of the liver appears hyperdense compared with surrounding liver parenchyma. On T1-weighted MRI, liver parenchyma, including posterior aspect of the segment IV, shows uniform intensity on in-phase image (C), and liver parenchyma except the posterior aspect of the segment IV appears hypointense on opposed-phase image (D). These images indicate focal sparing of fatty liver in posterior aspect of the segment IV. Venous flow from the stomach (arrow) directly drains into the posterior aspect of segment IV of the liver on coronal reconstruction of portal phase contrast-enhanced CT (E).
Focal fatty change
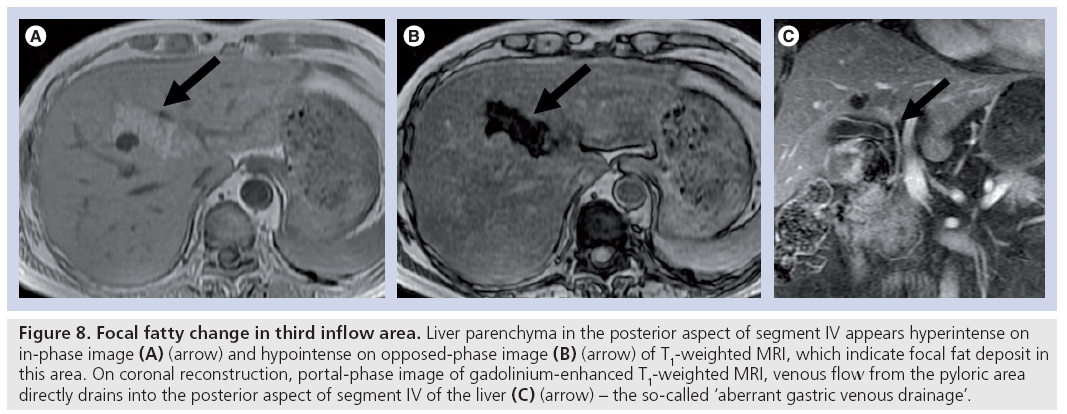
Fatty infiltration of the liver is a well-recognized entity in both diffuse and focal forms. In the focal form, various types of fatty infiltration have been described, and the anteromedial portion of segment IV, adjacent to the falciform ligament, is one of the most commonly involved locations [31]. The posterior aspect of segment IV is commonly spared from diffuse fatty infiltration, and is rarely involved with focal fatty infiltration (Figure 8).
Figure 8: Focal fatty change in third inflow area. Liver parenchyma in the posterior aspect of segment IV appears hyperintense on in-phase image (A) (arrow) and hypointense on opposed-phase image (B) (arrow) of T1-weighted MRI, which indicate focal fat deposit in this area. On coronal reconstruction, portal-phase image of gadolinium-enhanced T1-weighted MRI, venous flow from the pyloric area directly drains into the posterior aspect of segment IV of the liver (C) (arrow) – the so-called ‘aberrant gastric venous drainage’.
Kawamori et al. and Fukukura et al. reported that focal fatty infiltration at the posterior aspect of segment IV is also related to the presence of aberrant right gastric venous drainage [32,33]. However, the reason why similar variations in blood supply of the posterior aspect of segment IV cause focal fatty infiltration in some patients and focal spared area in others is unknown. Kawamori et al. suspected that differences in the ways various hormones, nutritional elements and other factors act on the aberrant right gastric venous drainage and the main portal vein may influence metabolism or nutrition in the posterior edge of segment IV [32]. These variations may lead to different results among individual cases.
Hyperplastic change in cirrhosis
Matsui et al. reported that aberrant gastric venous drainage in cirrhotic livers sometimes appears as hypoechoic on ultrasound, hypoattenuated on enhanced CT and hyperintense on T1-weighted or hypointense on T2-weighted magnetic resonance images [34]. On dynamic CT and dynamic MRI, these areas showed early enhancement, which is thought to be caused by early venous return compared with that of the surrounding liver parenchyma (Figure 9). Histopathologically, these lesions showed hyperplastic changes. The imaging findings, with the exception of early enhancement, were very similar to those of a dysplastic nodule or well-differentiated HCC.
Figure 9: Hyperplastic change in cystic venous inflow area in cirrhotic liver. Hepatic parenchyma in segment IV adjacent to the gallbladder shows hyperintensity on T1-weighted MRI (A) (arrow) and hypointensity on T2-weighted MRI (B) (arrow). On hepatobiliary phase of gadolinium ethoxybenzyl diethylenetriamine pentaacetic acid-enhanced T1 MRI, the lesion shows more hyperintensity compared with background liver parenchyma (C) (arrow). On CT with arterial portography, the lesion shows portal perfusion defect (D) (arrow). Coronal reconstruction of early-phase CT during hepatic arteriography image shows inflow of cystic vein into the hepatic parenchyma in segment IV adjacent to the gallbladder (E) (arrow).
Similar hyperplastic changes are occasionally seen around the gallbladder fossa, which is the drainage area of cholecystic veins. It is not known why hyperplastic change relative to the surrounding regenerative nodules was seen at the focal areas with aberrant right gastric venous drainage and cystic venous drainage. Matsui et al. suspected that these changes are probably due to differences in various kinds of hormones, nutritional elements and factors, such as hepatotrophic factors, among others, between the blood from the main portal vein and that from the gastric or cystic vein [34].
Gabata et al. reported a giant hyperplastic change of the caudate lobe in a patient with liver cirrhosis, and they suspected that caudate hyperplastic change may be correlated to an anomalous caudate portal vein branch [35]. They speculated that according to the laminar flow, the caudate branch receives less blood flow from the superior mesenteric vein than from another segment of the liver, and more blood flow from the splenic and gastric veins. The differences in hormones, nutritional elements and hepatotrophic factors in the portal blood flow between the caudate lobe and the segment of the liver may correlate with the hyperplastic change of the caudate lobe. Insulin and glucagon have been proposed as hepatotrophic hormones, which would be present in the splenic vein [36].
Since the flow direction of the inferior vein of Sappey is hepatofugal in a cirrhotic liver, focal hyperplastic changes are not observed in the anteromedial portion of segment IV around the falciform ligament. Hepatobiliary phase images of Gd ethoxybenzyl diethylenetriaminepentaacetic acid (Gd-EOB-DTPA)-enhanced T1-weighted MRI is a useful tool for detection of hepatic tumors. In focal fatty change and focal spared lesion cases, the lesions do not usually show attenuation difference in the hepatobiliary phase of Gd-EOB-DTPA-enhanced MRI compared with surrounding hepatic parenchyma, and we can easily diagnose them as pseudolesions. However, on focal hyperplastic change in cirrhotic liver, the ‘hyperplastic’ area sometimes shows increased uptake of Gd-EOB-DTPA similar to other causes of hyperplasia on hepatobiliary phase image and this could confuse diagnosis.
Imaging confirmation of the third inflow
Usually, diagnosing pseudolesions and pseudotumors in the third inflow area is not difficult if attention is paid to the typical occurrence site of the liver (e.g., the posterior aspect of segment IV, the anteromedial portion of segment IV around falciform ligament and gallbladder fossa) and typical findings such as focal fatty infiltration or focal sparing of the fatty liver. However, in some cases, especially in cirrhotic livers, focal hyperplastic change in the third inflow area sometimes shows findings similar to those of hypervascular HCC or hypovascular well-differentiated HCC in some modalities [34]. In such cases, the presence of a third inflow to the hepatic area should be confirmed for correct diagnosis.
In some cases, it may be possible to obtain direct confirmation of aberrant right gastric venous drainage to the posterior aspect of segment IV, or cystic venous drainage to the gallbladder fossa in venous phase images of celiac, right gastric arterial or cystic arterial angiography. For confirmation of drainage of the inferior vein of Sappey, it seems difficult to opacify the venous drainage of inferior vein of Sappey on venous phase images of arteriography.
Since it is easy to recognize the drainage area in the liver on CT obtained during selective arteriography, in order to obtain imaging confirmation of a third inflow to the liver, CT during selective right gastric artery [34,37], CT during internal thoracic artery [38] and CT during cystic arteriography [39] are performed. However, angiography and CT during selective angiography are invasive and not routinely performed.
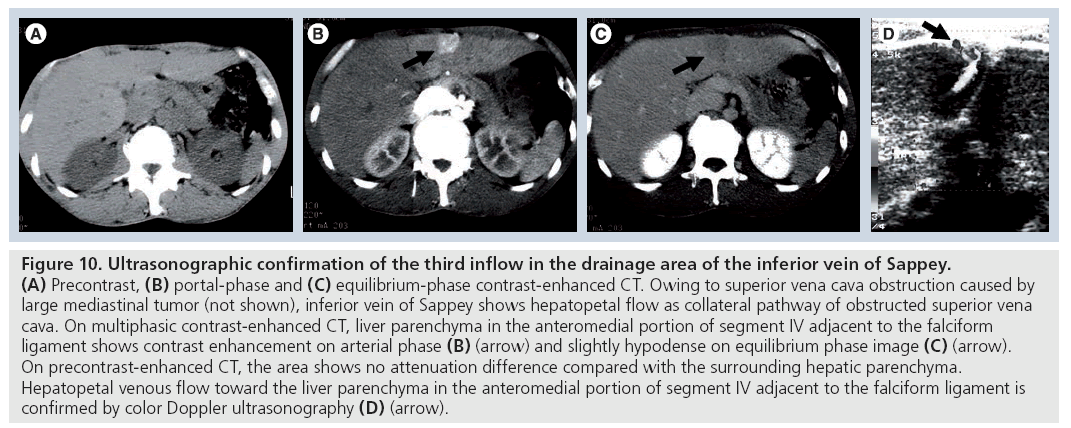
Recent advances in multidetector-row CT enable the demonstration of hepatic collateral vessels clearly using CT angiographic techniques [40], so we can depict third inflow vessels draining into the specific liver area, such as the posterior aspect of segment IV, the anteromedial portion of segment IV around falciform ligament and gallbladder fossa with CT angiographic, multiplanar reconstruction or 3D reconstruction techniques. In addition, the presence of a third inflow to the liver can be confirmed using a color- and power-Doppler ultrasound technique (Figure 10) [41–43].
Figure 10: Ultrasonographic confirmation of the third inflow in the drainage area of the inferior vein of Sappey. (A) Precontrast, (B) portal-phase and (C) equilibrium-phase contrast-enhanced CT. Owing to superior vena cava obstruction caused by large mediastinal tumor (not shown), inferior vein of Sappey shows hepatopetal flow as collateral pathway of obstructed superior vena cava. On multiphasic contrast-enhanced CT, liver parenchyma in the anteromedial portion of segment IV adjacent to the falciform ligament shows contrast enhancement on arterial phase (B) (arrow) and slightly hypodense on equilibrium phase image (C) (arrow). On precontrast-enhanced CT, the area shows no attenuation difference compared with the surrounding hepatic parenchyma. Hepatopetal venous flow toward the liver parenchyma in the anteromedial portion of segment IV adjacent to the falciform ligament is confirmed by color Doppler ultrasonography (D) (arrow).
Future perspective
Pseudolesions and pseudotumors in the third inflow area are important not only in differential diagnosis of HCC, but also in the consideration of the cause of benign nodular hepatocellular lesions. There are many kinds of benign regenerative and/or hyperplastic lesions, such as focal nodular hyperplasia, nodular regenerative hyperplasia and focal hyperplastic changes in cirrhotic liver observed in the third inflow area.
Precise etiology of such benign regenerative and/or hyperplastic lesions is unknown. However, recently, from a histopathologist’s point of view, Kondo introduced the following hypothesis [44]:
▪ Congenital vascular anomaly is the origin of some kinds of benign hepatocellular hyperplastic nodules
▪ Changes in the blood supply can cause hyperplastic nodules
Physiologically, vascular anomaly in the focal hepatic area might cause imbalance of hepatic parenchymal portal venous and hepatic arterial flow, both in the vascular anomaly area and the surrounding normal vascular area. This results in differences in various hormones, nutritional elements and factors such as hepatotrophic factors, which are perfuse in these areas. This is the same situation as with pseudotumors in the third inflow area. Thus, elucidation of the etiology of the hepatic parenchymal change observed in the third inflow area might hold potential clues for resolving the etiology of some kinds of benign regenerative and/or hyperplastic lesions such as focal nodular hyperplasia and nodular regenerative hyperplasia.
Conclusion
We reviewed hepatic pseudolesions and pseudotumors of the third inf low area on imaging. It should be noted that some pseudotumors in cirrhotic livers may have findings similar to those of HCC or dysplastic nodules and confuse diagnosis. Knowledge of pseudolesions and pseudotumors in the third inflow area can aid in correct diagnosis and avoid unnecessary treatment.
Financial & competing interests disclosure
The authors have no relevant affiliations or financial involvement with any organization or entity with a financial interest in or financial conflict with the subject matter or materials discussed in the manuscript. This includes employment, consultancies, honoraria, stock ownership or options, expert testimony, grants or patents received or pending, or royalties.
No writing assistance was utilized in the production of this manuscript.
References
Papers of special note have been highlighted as:
• • of considerable interest
- Itai Y, Matsui O: Blood flow and liver imaging. Radiology 202(2), 306–314 (1997).
- Matsui O, Kadoya M, Suzuki M et al.: Work in progress: dynamic sequential computed tomography during arterial portography in the detection of hepatic neoplasms. Radiology 146(3), 721–727 (1983).
- Kim HC, Kim TK, Sung KB et al.: CT during hepatic arteriography and portography: an illustrative review. Radiographics 22(5), 1041–1051 (2002).
- Matsui O, Kadoya M, Kameyama T et al.: Benign and malignant nodules in cirrhotic livers: distinction based on blood supply. Radiology 178(2), 493–497 (1991).
- Hayashi M, Matsui O, Ueda K et al.: Correlation between the blood supply and grade of malignancy of hepatocellular nodules associated with liver cirrhosis: evaluation by CT during intraarterial injection of contrast medium. Am. J. Roentgenol. 172(4), 969–976 (1999).
- Matsui O, Takahashi S, Kadoya M et al.: Pseudolesion in segment IV of the liver at CT during arterial portography: correlation with aberrant gastric venous drainage. Radiology 93(1), 31–35 (1994).
- Matsui O, Takashima T, Kadoya M et al.: Staining in the liver surrounding gallbladder fossa on hepatic arteriography caused by increased cystic venous drainage. Gastrointest. Radiol. 12(4), 307–312 (1987).
- Peterson MS, Baron RL, Dodd GD 3rd et al.: Hepatic parenchymal perfusion defects detected with CTAP: imaging–pathologic correlation. Radiology 185(1), 149–155 (1992).
- Fernandez MP, Bernardino ME: Hepatic pseudolesion: appearance of focal low attenuation in the medial segment of the left lobe at CT arterial portography. Radiology 181(3), 809–812 (1991).
- Arai K, Matsui O, Takashima T, Ida M, Nishida Y: Focal spared areas in fatty liver caused by regional decreased portal flow. Am. J. Roentgenol. 151(2), 300–302 (1988).
- Dahnert W: Third inflow to liver. In: Radiology Review Manual (5th Edition). Dahnert W (Ed.). Lippincott Williams & Wilkins, PA, USA, 675 (2003).
- Itai Y, Matsui O: “Nonportal” splanchnic venous supply to the liver: abnormal findings on CT, US and MRI. Eur. Radiol. 9(2), 237–243 (1999).
- Sappey C: Recherches sur quelques veinses portes accessories. Comptes Rendus Seances Mem. Soc. Biol. 11, 3–13 (1859).
- Michels NA: Blood Supply of the Upper Abdominal Organs with the Descriptive Atlas. Lippincott, PA, USA (1955).
- Couinaud C: The parabiliary venous system. Surg. Radiol. Anat. 10(4), 311–316 (1988).
- Yoshimitsu K, Honda H, Kuroiwa T et al.: Unusual hemodynamics and pseudolesions of the noncirrhotic liver at CT. Radiographics 21, S81–S96 (2001).
- Yoon KH, Matsui O, Kadoya M et al.: Pseudolesion in segments II and III of the liver on CT during arterial portography caused by aberrant right gastric venous drainage. J. Comput. Assist. Tomogr. 23(2), 306–309 (1999).
- Hiwatashi A, Yoshimitsu K, Honda H et al.: Pseudolesion in segment II of the liver observed on CT during arterial portography caused by the aberrant left gastric venous drainage. Abdom. Imaging 24(4), 357–359 (1999).
- Yoshikawa J, Matsui O, Kadoya M et al.: High density pseudolesion at the posterior edge of segment IV on CT during arterial portography caused by parabiliary vein. J. Comput. Assist. Tomogr. 23(1), 96–98 (1999).
- Martin BF, Tudor RG: The umbilical and paraumbilical veins of man. J. Anat. 130(Pt 2), 305–322 (1980).
- Genchellac H, Yilmaz S, Ucar A et al.: Hepatic pseudolesion around the falciform ligament: prevalence, aberrant venous supply, and fatty infiltration evaluated by multidetector computed tomography and magnetic resonance imaging. J. Comput. Assist. Tomogr. 31(4), 526–533 (2007).
- Ohashi I, Ina H, Gomi N et al.: Hepatic pseudolesion in the left lobe around the falciform ligament at helical CT. Radiology 196(1), 245–249 (1995).
- Koseoglu K, Ozsunar Y, Taskin F, Karaman C: Pseudolesions of left liver lobe during helical CT examinations: prevalence and comparison between unenhanced and biphasic CT findings. Eur. J. Radiol. 54(3), 388–392 (2005).
- Spelle L, Soyer P, Rondeau Y et al.: Nontumorous hepatic pseudolesion around the falciform ligament: prevalence on gadolinium chelate-enhanced MR examination. Am. J. Roentgenol. 169(3), 795–799 (1997).
- Irie T, Tsushima Y, Terahata S, Hatsuse K, Kusano S: Influence of liver cirrhosis on pseudolesions in liver at CT during arterial portography. J. Comput. Assist. Tomogr. 20(6), 914–918 (1996).
- Yamashita K, Jin MJ, Hirose Y et al.: CT finding of transient focal increased attenuation of the liver adjacent to the gallbladder in acute cholecystitis. Am. J. Roentgenol. 164(2), 343–346 (1995).
- Ito K, Awaya H, Mitchell DG et al.: Gallbladder disease: appearance of associated transient increased attenuation in the liver at biphasic, contrast-enhanced dynamic CT. Radiology 204(3), 723–728 (1997).
- Gore RM: Diffuse liver disease. In: Gastrointestinal Radiology. Gore RM, Levine MS, Laufer I (Eds). Saunders, PA, USA, 1968–2017 (1994).
- Marchal G, Tshibwabwa-Tumba E, Verbeken E et al.: “Skip-areas” in hepatic steatosis: a sonographic-angiographic study. Gastrointestinal Radiol. 11(2), 151–157 (1986).
- Matsui O, Kadoya M, Takahashi S et al.: Focal sparing of segment IV in fatty livers shown by sonography and CT: correlation with aberrant gastric venous drainage. Am. J. Roentgenol. 164(5), 1137–1140 (1995).
- Yoshikawa J, Matsui O, Takashima T et al.: Focal fatty change of the liver adjacent to the falciform ligament: CT and sonographic findings in five surgically confirmed cases. Am. J. Roentogenol. 149(3), 491–494 (1987).
- Kawamori Y, Matsui O, Takahashi S et al.: Focal hepatic fatty infiltration in the posterior edge of the medial segment associated with aberrant gastric venous drainage: CT, US, and MR findings. J. Comput. Assist. Tomogr. 20(3), 356–359 (1996).
- Fukukura Y, Fujiyoshi F, Inoue H et al.: Focal fatty infiltration in the posterior aspect of hepatic segment IV: relationship to pancreaticoduodenal venous drainage. Am. J. Gastroenterol. 95(12), 3590–3595 (2000).
- Matsui O, Kadoya M, Yoshikawa J et al.: Aberrant gastric venous drainage in cirrhotic livers: imaging findings in focal areas of liver parenchyma. Radiology 197(2), 345–349 (1995).
- Gabata T, Matsui O, Kadoya M et al.: Giant hyperplasia of the caudate lobe of the cirrhotic liver: correlation with an anomaly of the caudate portal branch. Abdom. Imaging 24(2), 153–156 (1999).
- Starzl TE, Halgrimson CG, Francavilla FR et al.: The origin, hormonal nature and action of hepatotrophic substancein portal venous blood. Surg. Gynecol. Obstet. 137(2), 179–199 (1973).
- Yamagami T, Nakamura T, Iida S, Kato T, Nishimura T: Nontumorous perfusion abnormalities of liver parenchyma adjacent to the falciform ligament as revealed by angiographic helical CT and angiography. Acta Radiol. 42(4), 398–402 (2001).
- Kobayashi S, Matsui O, Kadoya M et al.: CT arteriographic confirmation of focal hepatic fatty infiltration adjacent to the falciform ligament associated with drainage of inferior vein of Sappey: a case report. Radiat. Med. 19(1), 51–54 (2001).
- Yoshimitsu K, Honda H, Kaneko K et al.: Anatomy and clinical importance of cholecystic venous drainage: helical CT observations during injection of contrast medium into the cholecystic artery. Am. J. Roentogenol. 169(2), 505–510 (1997).
- Temizoz O, Genchellac H, Yekeler E et al.: CT-angiographic demonstration of hepatic collateral pathways due to superior vena cava obstruction in Behçet disease. Diagn. Interv. Radiol. DOI: 10.4261/1305–3825.DIR.2174– 08.2 (2009) (Epub ahead of print).
- Gabata T, Matsui O, Kadoya M et al.: Aberrant gastric venous drainage into the medial segment: demonstration by color Doppler sonography. Abdom. Imaging 22(5), 502–505 (1997).
- Gabata T, Matsui O, Kadoya M et al.: Aberrant gastric venous drainage in a focal spared area of segment IV in fatty liver: demonstration with color Doppler sonography. Radiology 203(2), 461–463 (1997).
- Kobayashi S, Matsui O, Gabata T: Pseudolesion in segment IV of the liver adjacent to the falciform ligament caused by drainage of the paraumbilical vein: demonstration by power Doppler ultrasound. Br. J. Radiol. 74(879), 273–276 (2001).
- Kondo F: Benign nodular hepatocellular lesions caused by abnormal hepatic circulation: etiological analysis and introduction of a new concept. J. Gastroenterol. Hepatol. 16(12), 1319–1328 (2001).
• • First report regarding CT with arterial portography of the whole liver for the precise detection of hepatic neoplasms.
• • Describes the etiologies of abnormal imaging findings due to nonportal splanchnic venous supply to the liver and how to distinguish them from true mass lesions.
• • Describes CT findings of pseudolesions in noncirrhotic liver.
• • First report regarding focal hyperplastic change in the third inflow area in cirrhotic liver.
