Review Article - Imaging in Medicine (2011) Volume 3, Issue 2
Recent developments in cardiac CT
Noortje van der Bijl1, Jacob Geleijns1, Raoul MS Joemai1, Jeroen J Bax2, Joanne D Schuijf2, Albert de Roos1 and Lucia JM Kroft†1
1 Department of Radiology, Leiden University Medical Center, Albinusdreef 2, 2333 ZA Leiden, The Netherlands
2 Department of Cardiology, Leiden University Medical Center, Albinusdreef 2, 2333 ZA Leiden, The Netherlands
- *Corresponding Author:
- Lucia JM Kroft
Department of Radiology
Leiden University Medical Center Albinusdreef 2
2333 ZA Leiden ,The Netherlands
Tel.: +31 715 262 993
Fax: +31 715 248 256
E-mail: l.j.m.kroft@lumc.nl
Abstract
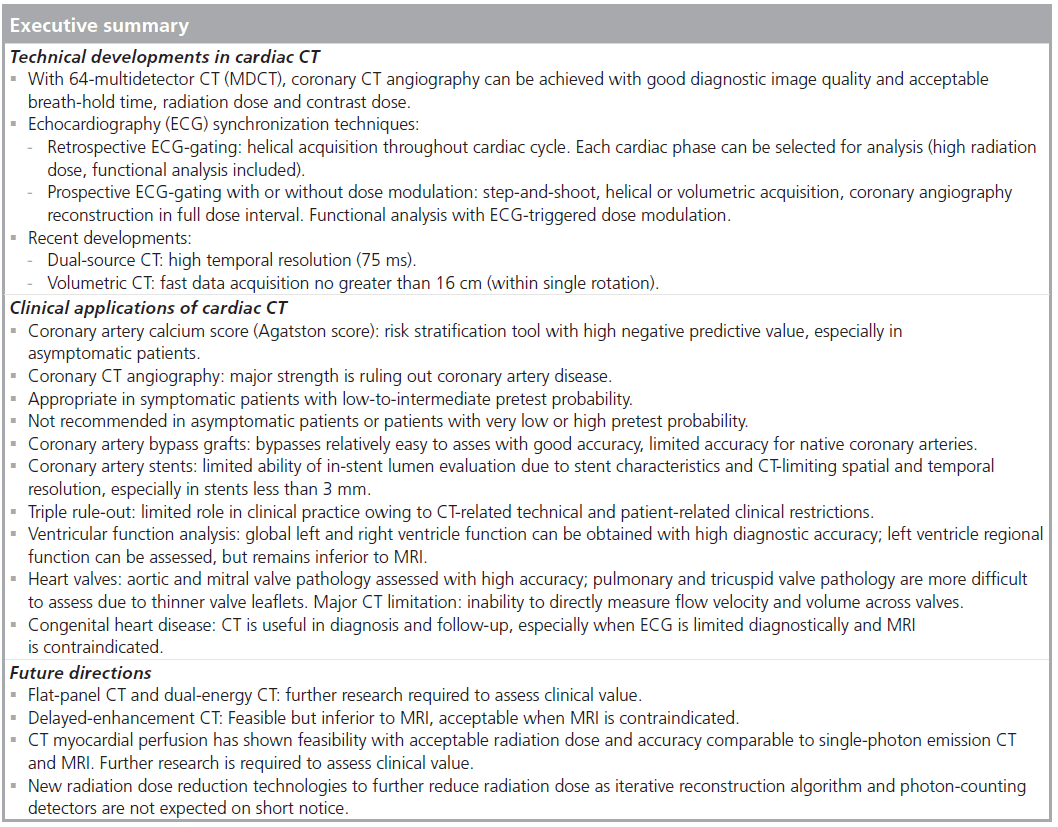
With the introduction of 64-multidetector row CT, coronary CT angiography has become a clinical tool, owing to improved image quality and reduced breath-hold time, and contrast and radiation dose. Nowadays, cardiac CT is widely used in clinical practice for various indications and patient groups. In this article, recent technical developments are presented. Current clinical applications of cardiac CT are reviewed (e.g., calcium score, evaluation of coronary arteries, coronary artery bypass grafts and stents, triple rule-out protocols, cardiac function, valve imaging and imaging congenital heart disease). For these topics, status, future directions and recommendations are specifically addressed. Future perspectives of cardiac CT are also discussed.
Keywords
cardiac; computed tomography
Technical developments
Background
Routine clinical imaging of the coronary arteries started in the 1980s after the introduction of electron beam CT (EBCT). The main application of EBCT was imaging and quantification of calcifications in the coronary arteries for risk stratification. Noninvasive evaluation of suspected coronary artery disease with helical multidetector row CT (MDCT) started in 1999 with four-detector row CT scanning [1]. The performance of the four-detector row scanners for visualizing the coronary arteries was limited, owing to the long scan time (the required breath hold often exceeded 30 s), the thick reconstructed slice thickness (~1–2 mm) [1,2], and the long rotation time and its associated limited temporal resolution of 250 ms, which was not sufficient for motionfree coronary imaging [2,3]. The coverage of the x-ray beam for four-detector row scanners was approximately 8 mm (four detector rows, each of 2-mm thickness).
Clinical performance improved considerably with the introduction of 16- and 64-detector row CT. With these scanners, it was realized that a helical acquisition of the coronary arteries could be performed within one breath hold (less than 10 s). The reconstructed slice thickness could be reduced down to 0.5 mm, and temporal resolution improved considerably.
Nowadays, 64-MDCT has become widely available, and the good performance of these scanners made coronary CT angiography appropriate as a diagnostic test in patients with suspected coronary artery disease with a lowto- intermediate pretest probability for coronary artery disease [3].
Data acquisition & electrocardiogram synchronization
Several consecutive cardiac cycles are scanned during helical coronary CT angiography, and the electrocardiogram (ECG) signal is recorded simultaneously by the scanner. What distinguishes a helical cardiac CT scan from regular helical scanning is the very low table speed (or very low pitch), and the recording of the ECG. A very low pitch is needed to scan the heart at each level during at least one complete cardiac cycle. During the reconstruction, the recorded ECG signal is used to select, or ‘gate’, only the scan data that correspond to the cardiac rest phase; that is, the phase interval with the least motion blurring. This technique is termed retrospective ECG-gated reconstruction. Retrospective ECG-gated reconstruction allows not only the cardiac rest phase, but any cardiac phase to be reconstructed; thus, the phase with the least motion can be selected retrospectively and, when necessary, additional phases can be reconstructed to obtain optimized diagnostic image quality for each coronary artery independently. In addition, reconstructions at the end-systolic and end-diastolic phases can be made so that ventricular function can be obtained from these helical scans of the heart, which results in repeated x-ray exposure of the same location. Dose reduction can be achieved for helical coronary CT angiography by modulation of the tube current during the scan, particularly when the acquisition is performed at low heart rates. Tube current modulation is triggered by the ECG signal, and with this modulation the tube current is unchanged during the cardiac phases that are of interest for coronary CT angiography, but the tube current is reduced during the rest of the cardiac cycle. Thus, good image quality is maintained for the coronary CT angiography reconstruction in the rest phase. Lower, but adequate, image quality may be achieved for the remaining part of the cardiac cycle, which is mainly of interest for assessment of cardiac function.
The coverage of the x-ray beam increased with the increasing number of detector rows and became approximately 30–40 mm for 64-MDCT. The wider beam coverage allowed for the introduction of axial step-and-shoot or ‘sequential’ prospective triggering acquisitions of the heart. In step-and-shoot, ‘shoot’ stands for performing an axial acquisition, and ‘step’ stands for the table movement after an axial acquisition. With 64-MDCT, coverage of the entire heart can be achieved in three to five shots. During step-and-shoot acquisitions, the ECG signal is used to trigger the axial acquisition at exactly the desired cardiac rest phase. The technique is also referred to as a sequential prospective ECG-triggered acquisition and is very efficient to reduce radiation exposure [4]. Decrease in radiation exposure of more than 80% is reported for prospective triggered step-and-shoot acquisitions [5]. With the step-and-shoot technique, data are only acquired during a specific, predefined cardiac rest phase. This rest phase has to be selected with special care. In patients with a low and stable heart rate, the mid-diastolic phase is usually optimal for coronary artery evaluation (at 75% of the cardiac RR interval), whereas in patients with higher heart rates (>65 beats per min), the phase with least coronary motion is often end systolic (40% of the RR interval).
Recent technical advances
Further technological advances have led to the introduction of CT scanners that perform even better in cardiac applications. First, dual-source CT was introduced. Dual-source scanners are equipped with two x-ray tubes (and two detectors) at 90° to each other. Therefore, it is possible to combine information from both detectors to reconstruct an image with a temporal resolution corresponding to only a quarter of the rotation of both detectors if necessary. With dual-source CT with a gantry rotation time of 330 ms, temporal resolution thus improves to 330/4 = 83 ms, and with the second-generation dual-source CT scanners, a temporal resolution of 75 ms has been achieved [6]. However, dual-source CT still relies on a helical acquisition. Another innovation has been the development of volume CT with 320 detector rows [7]. The volumetric CT scanner covers 160 mm and, thus, allows the entire heart to be scanned in one single, axial acquisition that takes only a fraction of a second [7]. Volumetric axial CT allows dose reduction to be achieved, short scan time and use of smaller volumes of contrast material [7]. Furthermore, it is more robust with regard to avoiding artifacts, especially artifacts related to arrhythmias [8].
Quantification of coronary artery calcium
Background
Coronary artery calcification is a direct sign of atherosclerotic coronary artery disease [9,10] and has been demonstrated to be a strong predictor for the risk of myocardial infarction and sudden cardiac death [11–13]. A method to quantify the amount of coronary artery calcium was introduced in 1990 by Agatston et al. [14]. The Agatston score was initially developed by using EBCT with ECG synchronization, and has the advantage of a high temporal resolution of 100 ms [14]. EBCT uses an axial prospective ECG-triggered step-and-shoot acquisition protocol with 3.0-mm thick, contiguous slices and a tube current of 130 kV. At present, MDCT is generally used for calcium scoring and has shown to correlate well with EBCT [15–19]. With MDCT, an acquisition protocol with a prospective ECG-triggering technique at 120 kV is generally used. Half-scan reconstruction enables a temporal resolution that varies between 100 and 200 ms, dependent on the scanner [20].
Agatston score
The Agatston score is based on the area of a calcified lesion in mm2 (defined as an area of at least 1 mm2 with an attenuation threshold value of more than 130 Hounsfield units [HU]) multiplied by a scaling factor based on the peak attenuation of that lesion (1 = 130–199 HU; 2 = 200–299 HU; 3 = 300–399 HU; 4 = ≥400 HU). The total score is the sum of the weighted scores for all coronary artery calcifications per slice level [14]. Figure 1 shows an example of coronary artery calcium quantification and Agatston score calculation. One disadvantage of the weighing factor for calculating the Agatston score is a relatively moderate interscan reproducibility. Therefore, alternative quantification methods have been developed, such as the volume score [21] or calcium mass [22]. Although these methods have shown improved reproducibility, large clinical outcome studies are still based on the Agatston score [11,12,23]. Therefore, in clinical practice, the Agatston score is generally advised, and is used for the identification and risk stratification of patients with suspected coronary artery disease [24–26].

Figure 1.Calcium score for a 70-year-old male patient with diabetes and known diffuse atherosclerotic disease. Images showing calcifications in LAD and CX. (A) Calcifications exceeding the attenuation threshold of more than 130 HU are automatically colored pink with calcium score analysis software. (B) Calcified lesions larger than 1 mm2 are marked and colored red. Lesions had Agatston scores of 161 (LAD) and 34 (CX) at this slice level. (C) Agatston and volume scores calculated for each coronary artery region. Total Agatston score accumulating all slices was 1465. (D) According to Hoff et al. [10], this Agatston score was in the 90th percentile. CX: Circumflex artery; HU: Hounsfield unit; LAD: Left anterior descending artery; LM: Left main artery; PDA: Posterior descending artery; RCA: Right coronary artery.
Clinical applications
In asymptomatic patients, a negative coronary artery calcium score predicts a low risk of cardiovascular events in short to intermediate follow-up (1–5 years) [23,27–29]. In asymptomatic patients with calcium score greater than zero, the presence and extent of coronary calcium has been associated with increased risk for cardiovascular events, including cardiac death [23,25,30–32]. Therefore, patients have been categorized into different risk groups based on the Agatston score, where a score of zero represents no identifiable disease, 1–99 represents mild disease, 101–400 moderate disease, and more than 400 represents severe disease [24,33]. In symptomatic patients, a negative calcium score may be unreliable in excluding the presence of significant coronary artery disease, especially in young and female patients [34–36]. Moreover, symptomatic patients with low calcium scores (1–10) should also be considered as a distinct risk group; with such a score, increased risk for cardiovascular events has been reported compared with patients with a score of zero [23,27].
There is large interindividual variation in calcium scores. Generally, coronary calcium increases with age and is higher in men than in women [10,37]. For men, median calcium scores (with interquartile range in parenthesis) were 1 (0–9) at age 40–44 years, 113 (13–410) at age 60–64 years, and 473 (166–1071) at age over 74 years. For women, median calcium scores were 0 (0–1) for age 40–44 years, 3 (0–57) for age 60–64 years, and 75 (9–241) for age over 74 years [10]. This is similar to more recent EBCT [38] and EBCT/MDCT [39] studies with smaller patient groups [38,39]. Furthermore, substantial differences have been found in calcium distribution by race/ethnicity [39].
When added to Framingham Risk Score or to traditional cardiovascular risk factors, calcium score has shown to improve risk stratification [40,41]. Based on calcium score, individuals may change to a higher risk group, for which medical intervention is indicated, or may shift to a lower risk group, where medical intervention is no longer needed [41,42]. This is especially valuable and may be indicated in individuals with intermediate pretest probability for having coronary artery disease [41–43].
Future directions
To improve reproducibility for calculating Agatston score, thin-slice or overlapping image reconstructions have been suggested that facilitate detection of small and low attenuation calcifications [44–49]. This may be helpful in improving accuracy in ruling out coronary artery disease. Interestingly, coronary calcium can be identified, and calcium scores may be derived from contrastenhanced coronary CT angiography examinations, since CT angiography allows visualization of coronary artery lumen as well as the vessel wall, including calcified atherosclerotic plaque [50–52]. However, clinical applicability is still limited, since technical limitations lead to under- or overestimation of CT angiography-derived calcium scores [50,52,53]. Several studies have shown the prognostic value of coronary CT angiography that may also be used for risk stratification [54,55]. With the development of low-dose coronary CT angiography techniques, it is conceivable that contrastenhanced coronary CT angiography may finally replace CT calcium scoring. Coronary CT angiography may provide total plaque scores, including calcified, noncalcified and mixed plaques together with information regarding luminal obstruction that cannot be obtained by noncontrast-enhanced CT calcium score alone.
In addition, it has been suggested that calcium score can be used to assess progression of coronary calcium. However, the high interscan variability and lack of data evaluating the effect of repeated measures of coronary calcium on clinical outcome suggest that there is no current role for the repeated measurement of coronary artery calcium [56,57]. Moreover, there is no evidence that risk stratification with calcium scoring reduces mortality and morbidity. Large prospective studies are required in order to demonstrate that risk assessment with calcium scoring actually affects outcome [56].
Recommendations
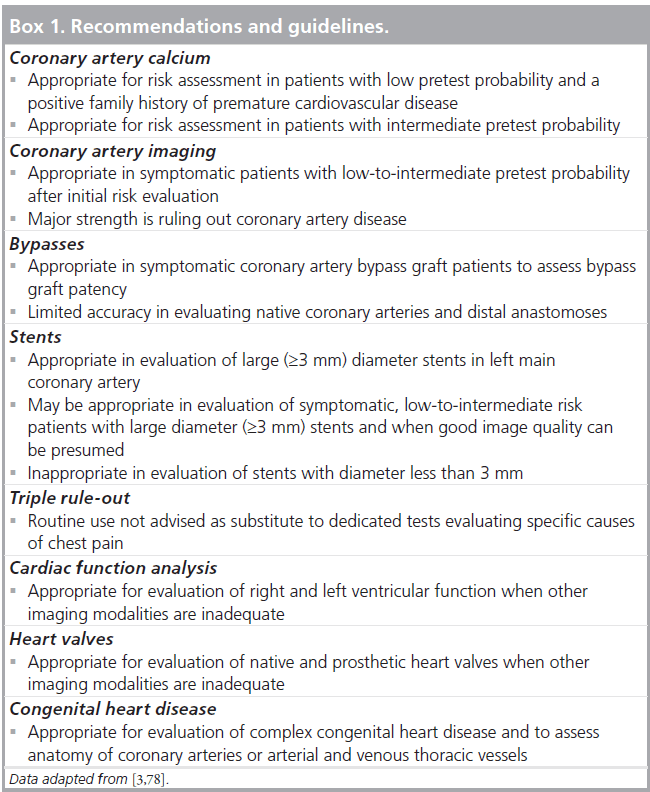
It has been stated that coronary artery calcium quantification is a reasonable approach for risk assessment in patients with low risk and a positive family history of premature cardiovascular disease and in patients with intermediate pretest probability for coronary artery disease (without prior calcium score <5 years) (Box 1) [3].
Coronary CT angiography
Background
Coronary CT angiography has developed into a clinical tool for the noninvasive evaluation of coronary artery lumen and vessel walls, including atherosclerotic plaque. At present, the major challenges in coronary CT angiography are the presence of coronary calcium and limited temporal resolution, both with associated artifacts. The coronary arteries move substantially during the cardiac cycle, and acquisition during the rest phase is needed to allow reconstruction of the coronary arteries without motion artifacts. Preparing patients with b-blockers is often required to slow down the heart rate below 65 beats per min to achieve an adequate cardiac rest phase at mid-diastole. b-blockers reduce the heart rate effectively in most patients, and improve image quality [58,59]. Preparing patients with b-blockers is also required with the most recent single heartbeat and dual-source imaging techniques [6,60]. Sublingual nitroglycerin administration prior to scanning is recommended, if no contraindications are present, to improve coronary artery visualization by increasing luminal diameter [61,62]. Further technical details regarding coronary CT angiography are discussed in the ‘Technical developments’ section.
Clinical applications & recommendations
Meta-analysis of single-center studies have shown that, with 64-MDCT, significant coronary artery disease can be detected or excluded with high patient-based sensitivity and specificity (sensitivity: 97–99%; specificity: 88–91%) [63–65]. Owing to the excellent sensitivity and good specificity, the major strength of coronary CT angiography is ruling out coronary artery disease (Figure 2). According to appropriateness criteria, coronary CT angiography is regarded appropriate in symptomatic patients with a low-to-intermediate pretest probability for coronary artery disease after initial risk evaluation [3]. In patients with a low pretest probability, positive predictive values decrease owing to a tendency to overestimate luminal obstruction. In patients with a high pretest probability of coronary artery disease, the negative predictive value is likely to be lower, in the case of the presence of calcified plaque that limits diagnostic accuracy [66]. Moreover, disease prevalence influences positive and negative predictive values. In patients with a high pretest probability of coronary artery disease, the number of true-positive and false-negative examinations increases, whereas the number of true-negative examinations is generally lower, leading to a decrease in negative-predictive value. For patients with a very low risk for obstructive coronary artery disease, the opposite is true; the number of true-positive and false-negative examinations decreases and the number of true-negative examinations increases, leading to a decrease in positive predictive value. Therefore, CT angiography can not be recommended in asymptomatic patients or in patients with a very low or high likelihood of obstructive coronary artery disease (Box 1) [3,67,68].
Future directions
Although coronary CT angiography is often advised and used in clinical practice, several limitations still exist. Diagnostic performance in detecting significant stenosis decreases in patients with high calcium scores (i.e., Agatston scores >400) as coronary vessel lumen may be obscured owing to blooming artifacts that can hamper the estimation of stenosis grade [66,69]. Furthermore, although shorter rotation times and better reconstruction algorithms have improved temporal resolution, image quality with high or irregular heart rates is still limited with helical CT and remains a relative contraindication. With new developments, such as dual-source CT, diagnostic image quality can be obtained with high heart rates, and with wide-detector volumetric CT, even in patients with arrhythmia [70,71]. However, it should be noted that imaging in patients with arrhythmia should be reserved for specific indications and with experienced operators only.
Coronary artery bypass grafts
Background
Patients with coronary artery bypass grafts (CABGs) may present with recurrent chest pain, where graft stenosis or occlusion, or progression of native coronary artery disease, may be suspected. Within 10 years after bypass surgery, graft occlusion occurs in 43% of venous grafts and 10% of arterial grafts [72]. It has been shown that CT angiography allows detection of CABG occlusion or stenosis with high accuracy [64,73]. Coronary bypasses, especially saphenous venous grafts, are relatively easy to assess with CT, due to the larger size, the relative immobility and few calcifications, compared with native coronary arteries. Imaging arterial grafts is more challenging due to the smaller size and presence of metallic clips. Figure 3 shows an example of arterial bypass graft evaluation.

Figure 2.Coronary CT angiography for a 56-year-old female patient with atypical chest pain and inconclusive stress-test. Prospective ECG-triggered 320-multidetector CT coronary angiography. (A) Curved multiplanar reconstruction images of the right coronary artery, (B) left anterior descending artery and (C) circumflex artery. (A–C) Normal coronary arteries. Major side branches were also shown normal. Coronary artery stenosis was excluded.
Clinical applications
Meta-analyses have reported high diagnostic accuracy of CT angiography in evaluating CABG stenosis or occlusion (sensitivity: 98%; specificity of 97%; positive and negative predictive values: 93 and 99%, respectively) [64,73]. However, 7–8% of the bypass grafts (including distal anastomosis) that were not assessable have been excluded in analyses, as well as native coronary arteries and bypass runoff beyond the distal anastomoses [64,73]. Follow-up in symptomatic CABG patients should include evaluation of CABG runoff and native coronary arteries as possible causes of recurrent chest pain. The distal anastomoses with runoff to the native coronary arteries in CABG patients are generally more difficult to evaluate than coronary arteries in patients without bypasses, owing to the small caliber native vessels and the presence of motion and/or metallic clip artifacts in CABG patients. Furthermore, native coronary arteries in CABG patients are usually of poor quality with severe wall irregularities, and are often heavily calcified. These factors limit diagnostic accuracy in CABG patients [70,74]. Studies that have investigated accuracy for evaluating native vessels in CABG patients found sensitivities and specificities in the range of 86–97% and 76–88%, respectively (i.e., somewhat lower than for evaluating the bypass grafts and their distal anastomoses itself) [70,74,75].
Current status
Some technical aspects and limitations need attention. First, a larger scan range is required to include bypasses, especially when internal mammary artery grafts are present. This leads to increased breath hold, higher radiation exposure and a greater amount of contrast is required. Moreover, bypass segments or anastomoses may be obscured owing to metallic clip artifacts. Internal mammary artery bypass grafts especially may have metallic clips alongside the graft that can obscure the lumen and hamper diagnosis. Furthermore, due to the smaller size, arterial grafts (1–3 mm) may be more difficult to evaluate than the larger venous grafts (3–4 mm) [76,77].
Low-dose techniques, such as prospective triggering, may reduce patient exposure to radiation (Figure 3). Faster CT angiography scan techniques that require shorter breath holds and decrease the amount of contrast agent are advantageous in evaluating CABG patients.

Figure 3.Coronary artery bypass graft evaluation for a 74-year-old female patient with coronary artery bypass grafts and recurrent chest pain. The right internal mammary artery (RIMA) is anastomosed to the left anterior descending artery (LAD). The left internal mammary artery (LIMA) is anastomosed as jump graft to obtuse marginal circumflex side branches (OM1 and OM2). (A) Scout view for determining scan range. (B) Scan range includes subclavian arteries to cover the full range of the LIMA and RIMA; volume acquired was 26 cm. (C) 64-detector-row helical CT with prospective ECG triggering at 75% of the RR interval. Imaging in 12 heartbeats, 13.9-s acquisition time with heart rate of 50–51 beats per min, patient dose was 5.7 mSv. (D) RIMA-LAD. RIMA is open, although image quality of the proximal part is suboptimal due to contrast material arrival in the right subclavian vein. Distal anastomosis is open with good runoff (circle and arrows). (E) LIMA-OM1-OM2. The distal anastomosis to the OM1 is visualized and open with good runoff (circle and arrows). However, the jump to the OM2 branch is not visualized and is probably occluded, this may be the cause for recurrent chest pain.
Recommendations
According to the Appropriateness criteria, CT angiography is regarded appropriate in the evaluation of bypass graft patency in symptomatic CABG patients [3]. The American Heart Association (AHA) consensus document reports that accuracy of evaluating the bypass grafts themselves is very high, while overall diagnostic accuracy of CT angiography in CABG patients is limited due to difficulties in evaluating the native coronary arteries (Box 1) [78].
Coronary artery stents
Background
Stents may be present in patients with known coronary artery disease referred for coronary CT angiography. The technical success rate of coronary artery stenting exceeds 95%. In-stent restenosis, mainly caused by intima hyperplasia, occurs in 8–12% of cases and may cause recurrent chest pain [79]. Coronary CT angiography stent imaging aims at confirming or excluding in-stent restenosis.
Current status
Imaging coronary artery stents with coronary CT angiography is challenging. Phantom studies and patient studies have shown that, generally, 27–39% of the stent lumen cannot be assessed reliably due to artificial lumen narrowing [80–82]. This is caused by a high density of metallic stent components, causing blooming artifacts that obscure part of the stent lumen. Other stent characteristics, such as stent diameter, strut thickness and high metallic component, also influence visualization of stent lumen [81,83,84]. Gold or gold-coated stents and tantalum stents generate more artifacts than stainless steel and cobalt stents [85]. Moreover, general artifacts, such as motion and partial volume averaging, may also influence stent lumen visualization with CT [78].
Clinical applications
Several studies have evaluated the diagnostic performance of CT in identifying in-stent restenosis. Meta-analyses reported high sensitivities (84–91%) and specificities (91% for all) [86–88]. However, unassessable stents were excluded in most studies, which comprised 9–13% of stents [86–88]. A small stent diameter (<3 mm) was found to be the most important factor limiting diagnostic performance related to limited spatial and temporal CT resolution [86–88]. Limited spatial resolution leads to partial-volume averaging, where the average HU value of two adjacent structures present in one voxel is averaged for that specific voxel [8]. Limited temporal resolution related to coronary size and motion results in blurring artifacts, which also degrade contrast and spatial resolution [8]. A sharp reconstruction filter may be beneficial for the imaging of coronary stents (Figure 4) [80].
Future directions
With newer scanner types, the ability of CT angiography to detect in-stent restenosis may improve with further increase in spatial and temporal resolution. Furthermore, the development of new stent types, such as biodegradable stents, are promising [89], and may help in CT evaluation of patients regarding restenosis. Nevertheless, CT angiography currently has a limited role in the evaluation of patients with coronary stents.
Recommendations
According to the Appropriateness criteria, CT angiography is regarded appropriate in the evaluation of a large diameter stent (≥3 mm) in the left main coronary artery. Furthermore, CT angiography may be a reasonable approach in the evaluation of symptomatic patients with coronary stents of at least 3 mm. Moreover, for coronary stents smaller than 3 mm, CT angiography is regarded inappropriate [3]. In addition, the AHA Expert Consensus suggests that 64-slice CT angiography may be used to rule out in-stent restenosis in a highly selected patient group. Major selection criteria are patients with low-to-intermediate pretest probability, large diameter stents (>3 mm), and presumed good image quality (Box 1) [78].

Figure 4.Coronary artery stent imaging of a 68-year-old female with stent in the right coronary artery presenting with instable angina. Multiplanar reconstruction images of the right coronary artery with stent located in the proximal part. Images reconstructed with (A) a medium-soft convolution kernel and (B) a sharp convolution kernel. Although noise increases with sharp kernel reconstruction, stent lumen can be better delineated. Significant stenosis is present at the distal stent-edge.
Triple rule-out
Background
Acute chest pain evaluation mainly focuses on confirming or excluding the three major lifethreatening causes of chest pain: acute coronary syndrome, acute aortic syndrome and pulmonary embolism. In patients at high risk for one of these diagnoses, dedicated tests aiming at evaluating the suspected diagnosis are appropriate. However, in patients without specific symptoms or signs, it may be difficult to distinguish between suspected causes based on clinical presentation alone. CT angiography has been shown to be accurate in diagnosing coronary artery disease [65] and is the diagnostic study of choice for patients with suspected pulmonary embolism [90] or acute aortic syndrome [91]. A noninvasive CT angiography ‘triple rule-out’ approach for evaluating these three life-threatening conditions in a single investigation may be advantageous in patients presenting with acute chest pain of indeterminate cause as to prevent inappropriate discharges, as well as unnecessary admissions [92].
Scan protocol
Several differences exist between triple rule-out protocols and the specific disease-targeted CT protocols used for diagnosing coronary heart disease, acute aortic syndrome or pulmonary embolism. For coronary artery imaging, a small field-of-view is reconstructed for increased spatial resolution [8]. Large field-of-view is required for triple rule-out protocols to include the entire chest width. In addition, a longer scan range (~20 cm) is needed to visualize the pulmonary arteries and the thoracic aorta [93–96]. This causes longer scan time and breath-hold duration (~15 s with 64-slice scanners) [93,95,97]. With triple rule-out protocols, larger volumes of contrast agent are required (95–160 ml) for homogeneous contrast enhancement and for simultaneous enhancement of pulmonary arteries, aorta and coronary arteries [93–99]. To provide optimal contrast enhancement of the right and left circulation, with minimized right heart streak artifacts, biphasic [93,97,98] or triphasic contrast protocols [94] have been advised, although singlephase contrast injection has also been shown to be sufficient [95,96].
Radiation exposure for triple rule-out CT protocols is of concern. With retrospective ECG-gating techniques, doses varying between 18 and 32 mSv have been reported [93–95]. With dose-saving prospective ECG-triggering techniques, the dose for triple rule-out CT is still in the range of 6 to 9 mSv [93–95], which is generally more than is expected with current prospective ECG-triggered coronary CT angiography (e.g., 2–4 mSv [78]), pulmonary CT angiography (e.g., 2–5 mSv [100–102]) or prospectively ECG-triggered aortic CT angiography (e.g., 2–4 mSv [103,104]) protocols.
Current status
Only a few studies (with different end points) have evaluated triple rule-out CT angiography protocols. One study reported a significant reduction of costs and length of in-hospital stay [96]. Another study, including 197 patients, found clinically important diagnosis with triple rule-out in 22% of the patients (coronary artery disease in 11%, pulmonary embolism in 1.5% and aortic dissection in 0.5%; other clinically important diagnosis: 9%). The remaining patients could be discharged safely and no adverse outcome within 30 days was reported [93]. Two studies reported on overall diagnostic accuracy of triple rule-out CT with sensitivities of 87–93% and specificities of 78–96%, respectively [95,105]. The moderate sensitivity could be explained by failure of CT in identifying significant coronary artery stenosis [105].
Future directions
ECG-triggered aorta protocols facilitate diagnosis of dissection, and these protocols can be used in clinical practice with acceptable patient dose [103,104]. However, do we need triple rule-out CT protocols? In clinical practice, there is often little doubt between suspicions of the three major vascular life-threatening conditions, but more often between two of those (e.g., suspicion for pulmonary embolism or acute aortic syndrome). In these cases, the protocol may be focused on dual rule-out, including technical simplifications as compared with triple rule-out. In addition, some triple rule-out studies did not include noncontrast-enhanced CT [93–95]. Noncontrastenhanced CT is additionally required for diagnosing aortic intramural hematoma, a condition that occurs in approximately 15% of patients among acute aortic syndromes, and the condition is clinically comparable to acute aortic dissection [106]. Adding noncontrast-enhanced CT is therefore recommended in patients with suspected acute aortic syndrome [107]. Another important limitation specifically related to coronary artery evaluation is heart rate control. Due to CT-limited temporal resolution, patients are usually given b-blockers to slow down the heart rate (<65 beats per min) to obtain good quality coronary CT angiography images. However, in (hemodynamically stable) patients with pulmonary embolism, heart rate is typically high (±87 beats per min) [108]. Little is known regarding safety of using b-blockers in stable or unstable acute pulmonary embolism patients should this be required for triple rule-out reasons.
Recommendations
Appropriateness criteria have classified atypical chest pain as an ‘uncertain’ indication for CT angiography [3]. Furthermore, the European Society of Cardiac Radiology and the North American Society for Cardiovascular Imaging have concluded that large, blinded randomized trials are needed to evaluate accuracy of triple rule-out CT angiography [109]. Moreover, the AHA consensus states that routine use is not advised as a substitute for dedicated clinical tests evaluating specific causes of acute chest pain [78].
The paucity of actual clinical study publications regarding triple rule-out protocols and the relative abundance of opinion papers suggest that the triple rule-out idea is interesting, but that CT-related technical restrictions and patientrelated clinical restrictions limit wide introduction in general practice. Therefore, triple rule-out CT angiography currently has a limited role and may only be appropriate in the evaluation of a highly selected patient group with acute chest pain of uncertain cause (Box 1).
Left & right ventricular function
Background
Left ventricular (LV) and right ventricular (RV) dysfunction have been shown to be predictive for mortality in patients after myocardial infarction [110,111], in patients with heart failure [112–114], valvular heart disease and pulmonary embolism [115–117]. Furthermore, ventricular function analysis has been shown to be useful in depicting toxic cardiomyopathy in patients with a history of malignancy who received treatment with chemotherapeutic agents [118,119]. Echocardiography [120], SPECT [121] and MRI [122,123] are well-established, noninvasive imaging techniques for evaluation of ventricular function. Compared with echocardiography, CT does not suffer from acoustic window limitations, observer dependency and the limited ability to visualize the RV. As compared with MRI, CT acquisition time is short, and CT may be an alternative for claustrophobic patients or patients with intracardiac devices. Compared with SPECT, CT has superior spatial resolution, leading to better estimation of ejection fraction [124]. With CT, LV and RV function can be assessed with high diagnostic accuracy and reproducibility compared with the standard of reference MRI [124–128]. Although agreement with MRI has shown to be excellent, several studies reported overestimation of LV end-diastolic and end-systolic volumes with CT, as well as lower ejection fractions [129–132]. This may be caused by the frequent administration of b-blockers prior to the CT examination that decrease heart rate, and thereby influences LV function [124,131,132].
Global LV & RV function
Accuracy of CT-derived global LV functional parameters has been shown to be superior to measurements obtained with echocardiography or SPECT [124,133]. With CT, LV volumes and ejection fraction are assessed with excellent agreement compared with MRI [127,128], although a slight overestimation has been reported for CT-measured end-systolic and/or end-diastolic volumes. This resulted in a nonsignificant but systematic overestimation [128] or underestimation [127,129–132] of LV ejection fraction. The overestimation of volumetric measurements is related to moderate temporal resolution of CT [128,132]. Global RV function can be assessed with high reproducibility with CT, compared with MRI [125,126]. Also for RV function, an overestimation of volumetric measurements has been reported, leading to underestimation [126] or overestimation of RV ejection fractions [125]. Global RV and LV function assessment is illustrated in Figure 5.
Regional LV function
Regional LV function can be evaluated with CT by assessing regional wall motion and/or by measuring end-systolic and end-diastolic wall thickness and mass [128,134]. Good agreement has been found between CT and MR in the evaluation of regional LV function [124,128,131,134]. Owing to CT temporal resolution limitations, assessment of regional function is still inferior compared with MRI [124,128].
Determination of ventricular function
To obtain ventricular function, imaging is performed throughout the cardiac cycle. Images are reconstructed at every 5 [131–133] or 10% [129,135,136] of the RR interval. For ventricular volumetric analysis with manual contour depiction, reconstruction thickness of 5 mm has been shown to be sufficient [132,137]. Short-axis images are typically prepared with 5–8 mm thickness. The use of a segmental reconstruction algorithm is preferable to that of half reconstruction, since this improves temporal resolution and limits motion artifacts [133]. However, this may be less important with improved temporal resolution of dual-source CT.
For function analysis, images are preferably viewed in cine loop. To obtain volumetric measurements, endocardial contours are drawn manually or (semi-) automatically, usually in short-axis view or axial orientation. In the case of manual contour drawing, the phases with the largest and smallest ventricular volumes are selected that represent the end-diastolic and end-systolic phases, respectively. From these end-diastolic and end-systolic volumetric measurements, RV and LV stroke volume and ejection fraction are calculated for global function (Figure 5). For regional LV function, cine loop movies can also be used to visually identify areas of impaired motion. Moreover, by endocardial and epicardial contour drawing, end-systolic and end-diastolic wall thickening and ventricular mass can be calculated [128,131,134].
Current status
Coronary CT angiography performed with helical imaging with retrospective ECG-gating can be used to obtain cardiac function ‘for free’ without the need for additional scanning or contrast administration. However, radiation dose associated with this technique is high (in the range of 12 to 21 mSv) [138–142]. Tube-current modulation with prospective ECG-triggering techniques can be used to save radiation dose. A full dose during a short period in the cardiac RR cycle is required for coronary artery reconstruction, whereas the rest of the cardiac RR cycle is scanned with low dose (e.g., 25%) that is still sufficient for analyzing ventricular function. A dose with prospective ECG-modulated triggering techniques is in the range of 4 to 9 mSv [140,143,144]. Alternatively, ventricular function can also be obtained by retrospective ECG-gating techniques and low dose throughout the full cardiac RR cycle (e.g., in cases where the coronary arteries are not the topic of interest). The radiation dose for such protocol is approximately 3–4 mSv [108]. Another advantage of that protocol is the small amount (30–40 ml) of contrast agent needed for obtaining ventricular function [108]
With second-generation dual-source CT or volumetric CT, functional analysis can be obtained with prospective ECG-triggering [129,143].
Recommendations

Figure 5.Ventricular function analysis for a 56-year-old female patient (patient 1, A–E) and 76-year-old male patient (patient 2, F–I). CT images were reconstructed for every 5% of the RR interval and analyzed with dedicated software (MASS V2009-EXP, Leiden University Medical Center, Leiden, The Netherlands). (A) End-diastolic and end-systolic phases were selected and (B–I) contours were drawn for each 4 mm to obtain end-diastolic and end-systolic volumes. Manually traced endocardial contours of RV and LV in patient 1 (B & C) and patient 2 (F & G). RV and LV enddiastolic volumes (D & H) and end-systolic volumes (E & I) were derived from the contours. (F & G) Patient 2 showed severe RV artifacts due to the presence of an intracardiac device. (H & I) However, RV and LV end-diastolic and end-systolic volumes could be obtained. Patient 1 had severe RV dysfunction; ejection fraction was 18.3% and LV dysfunction with ejection fraction of 32.7%. Patient 2 had severe LV dysfunction, ejection fraction was 24.3%, RV ejection fraction was 44.9%. LV: Left ventricle; RV: Right ventricle.
Ventricular functional analysis can be adequately assessed with CT and has been shown to have incremental prognostic value over coronary CT angiography alone [145,146]. According to the Appropriateness criteria, CT angiography for obtaining LV function is considered appropriate in patients after myocardial infarction or with heart failure, when other imaging modalities are inadequate [3]. Moreover, CT angiography is considered a reasonable approach for the assessment of RV morphology, or when arrhythmogenic RV dysplasia is suspected [3].
The AHA consensus does not include advice regarding functional analysis [78]. With the availability of accurate techniques that can obtain cardiac function without radiation exposure and contrast administration, such as echocardiography and MRI, CT currently has a limited role in the evaluation of ventricular function. However, CT function may be used as an alternative in patients where echocardiography or MRI are not diagnostic or contraindicated (e.g., for evaluating ventricular function in patients with congenital heart disease who have a pacemaker) (Box 1).

Figure 6.Preoperative cardiac evaluation of a 34-year-old male with known bicuspid aortic valve with severe aortic insufficiency and moderate left ventricle function. Work-up before aortic root replacement, where CT indication was to evaluate possible coronary artery disease and possible presence of aortic coarctation. (A) Double oblique transverse orientation showing bicuspid aortic valve. (B) Coronary arteries were normal. (C) The left ventricle is dilated due to severe aortic valve insufficiency. (D) No aortic coarctation.
Heart valves
Background
Although echocardiography and MRI are currently the preferred imaging techniques for evaluating patients with valvular heart disease, CT has potential advantages for imaging heart valves. CT has excellent image quality with short acquisition times and has the ability to provide detailed information of other cardiac structures including the coronary arteries. CT has been used for various valvular disease indications and for all heart valves.
Aortic valve
CT can provide detailed information of the aortic valve, such as the morphology and number of valve leaflets, shape and size of the aortic annulus, leaflet thickness, presence of calcifications, opening and closing of native or prosthetic valve leaflets and distance of aortic valve to coronary artery ostia [147–152]. Furthermore, with CT, aortic stenosis severity can be assessed with high diagnostic accuracy by measuring the maximum aortic valve area in native aortic valves [152–156] or in aortic bioprostheses [149]. In the evaluation of mechanical aortic valves, size and function can be accurately evaluated with CT [150]. Furthermore, aortic regurgitation severity can also be evaluated with high diagnostic accuracy. First, the phase with smallest regurgitant orifice area diameter is selected. By reconstructing images in the plane perpendicular to the aortic valve, parallel to the regurgitant orifice, the inner contour of the orifice area can be outlined, enabling calculation of the regurgitant orifice area in square millimeters [157]. Although the evaluation of aortic stenosis and regurgitation is feasible, it is still an experimental method and validation would be required for the acceptance of CT as a standard tool. Moreover, with CT, the presence and extent of aortic valve or annulus calcifications can be visualized and quantified [152,154,155].
The presence and extent of aortic calcification is of importance in patients with aortic stenosis since it is a strong predictor for outcome and may therefore be used to select patients who might benefit from early aortic valve replacement [158,159]. Furthermore, the severity of calcifications is assessed in patients prior to aortic valve replacement since calcifications may indicate the necessity of reimplantation of the coronary arteries or aortic root replacement [160]. Transcatheter aortic valve replacement is a growing application. Calcifications may complicate valve-containing stentgraft placement during transcatheter aortic valve replacement since this may lead to occlusion of the coronary arteries [147,161]. Therefore, detailed information of anatomy and the presence of calcification is required. Moreover, the amount of thoracic aortic calcium has been associated with increased mortality rates [162]. Figure 6 shows an example of CT evaluation of aortic valve, aortic arch and coronary arteries as part of the preoperative work-up prior to aortic root replacement.
Mitral valve
For mitral valve evaluation, detailed morphology as well as functional information can be obtained with CT (e.g., leaflet thickness or presence of mitral annular calcifications) [163,164]. CT is highly diagnostic for the evaluation of mitral valve prolapse (i.e., billowing or displacement of both leaflets at least 2 mm beyond mitral annulus plane during systole) [165,166]. Furthermore, compared with echocardiography and MRI, CT allows estimation of mitral valve regurgitation severity in the absence of substantial tricuspid regurgitation with high accuracy by generating the difference between the total stroke volumes of the RV and LV [167]. In addition, regurgitant fraction measurements can be made (i.e., proportion of regurgitant volume relative to the total stroke volume of the left ventricle) [167,168]. Mitral valve regurgitation severity or severity of mitral valve stenosis may also be estimated by measuring regurgitant orifice area [163,169].
Pulmonary valve
Pulmonary or tricuspid valve disease is less common than aortic or mitral valve disease and is more difficult to evaluate with CT, owing to thinner valve leaflets [164,170]. Direct signs of pulmonary or tricuspid valve pathology that can be visualized with CT are decreased leaflet excursion, inadequate end-diastolic apposition of leaflets or leaflet thickening [164,170]. Indirect signs for pulmonary stenosis are enlargement of main pulmonary artery, RV hypertrophy and interventricular septum deviation towards the left. For pulmonary insufficiency, dilatation of pulmonary annulus and pulmonary artery can be seen, as well as RV dilatation and hypertrophy [164,170].
Tricuspid valve
Tricuspid valve stenosis can be characterized by shortened or fused chordae tendinae as a direct sign, and right atrial dilatation as an indirect sign [164,170]. For tricuspid valve insufficiency, direct signs at CT angiography can be inadequate end-diastolic apposition of leaflets. Indirect signs seen on CT can be right atrial and RV dilatation, and displacement of the RV with interventricular septum deviation towards the left. Moreover, indirect signs that can be present in both tricuspid valve stenosis or regurgitation are distension of superior and inferior vena cava and/or hepatic vein congestion [164,170].
An adjusted CT scan protocol may be used that allows improved opacification of the right heart.
Current status
Although CT has potential advantages in the evaluation of valvular heart disease, a major disadvantage is the inability to directly measure flow velocity and volumes across valves as can be assessed noninvasively with MRI and echocardiography. Another disadvantage of CT is exposure to radiation. For the evaluation of cardiac valve function, data are acquired during the entire RR interval to visualize the thin leaflet structures. CT dose for evaluating valvular function is similar to that of CT dose for ventricular functional analysis and is in the range of 12–21 mSv for coronary CT angiography with retrospective ECG gating [138–142,171]. Further disadvantage of CT, compared with echocardiography and MRI is administration of iodinated contrast agent. Therefore, the role of CT in the evaluation of valvular heart disease is currently limited.
One of the limitations is the relatively large volume of contrast and saline that are rapidly injected, possibly affecting valvular lesions and hemodynamics.
Recommendations
Characterization of native and prosthetic heart valves with CT angiography has been valued as an appropriate indication by the Appropriateness criteria working group when other noninvasive imaging modalities are inadequate and valvular dysfunction is suspected [3]. Moreover, in selected patient groups, CT assessment of valvular function may be useful, such as the combined evaluation of coronary arteries and heart valves for preoperative evaluation and follow-up of patients with valvular heart disease (Box 1) [147,161].
Congenital heart disease
Background
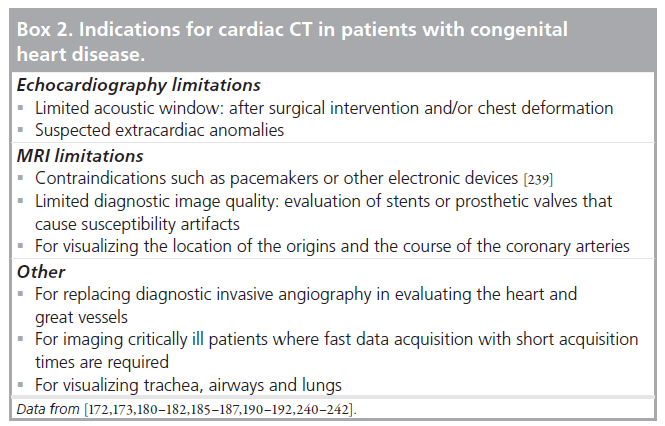
Transthoracic echocardiography, invasive angiography and MRI are established imaging techniques in the evaluation of patients with congenital heart disease. More recently, CT has been shown to be useful in these patients as well. With CT, 3D volumes of the heart and surrounding structures are acquired with short acquisition times. Images can be reconstructed in any plane with high spatial resolution. There are many indications where cardiac CT can be useful in patients with congenital heart disease (Box 2). Several technical differences exist between cardiac CT compared with ECG, invasive angiography and MRI, which are rewarding for CT. Compared with ECG, cardiac CT is not hampered by acoustic window limitations and is less operator dependent. CT provides superior visualization of cardiac structures in relation to the surrounding (vascular) structures in the mediastinum and in relation to the lung parenchyma, airways and trachea with excellent visualization of (peripheral) pulmonary vessels as compared with echocardiography or MRI [172,173]. A great advantage of CT compared with MRI is the short image-acquisition time. With CT, imaging is performed in only a few seconds with the current 64-slice scanners and anesthesia is usually not needed [174,175]. With the latest type wide-detector CT scanner, imaging is even faster with covering of a 16-cm volume in only a fraction of a second (0.35 s) [60,176]. Such fast volume imaging can be especially valuable in imaging neonates and small children [177]. To compare, anatomic imaging by MRI has an approximate 50-min acquisition time [178] and general anesthesia is usually required in children below the age of 6 years [179]. Moreover, CT is a 3D imaging technique not hampered by overprojection of adjacent cardiovascular structures, which can be the case in 2D invasive angiography. Furthermore, compared with invasive angiography, CT can visualize systemic and pulmonary vascular systems simultaneously with a single contrast injection. Moreover, CT is a noninvasive technique and has a low complication rate, requires smaller volumes of iodinated contrast agent, and there is less need for general anesthesia [175]. An example of CT images in a patient with congenital heart disease is shown in Figure 7.
Clinical applications
CT has been shown to be accurate in diagnosing cardiovascular abnormalities in neonates or small children and can replace diagnostic invasive angiography in most cases [180–182]. Abnormalities of aortic arch [136], pulmonary arteries [183,184], coronary arteries [185–187] or pulmonary veins [188] can be adequately assessed with CT. With the improved survival rate of patients with congenital heart diseases, evaluation as part of long-term follow-up is a growing application [189]. CT can be used in postoperative evaluation of altered anatomic structures and when complications are suspected. In addition, the patency of shunt, conduits or stents can be accurately assessed with CT and diameter measurements can be made [190–192]. However, the need for repetitive scanning may result in significant radiation exposure.
Ventricular function can be assessed with CT by using retrospective gating techniques [193] or with prospective triggering techniques with ECG dose modulation that saves radiation dose [129,143]. Global LV and RV function (i.e., assessing ventricular volumes and ejection fraction) can be visualized and evaluated with high accuracy by CT as compared with MRI [124,125].
Scan protocol
In contrast to coronary CT angiography, where contrast timing focuses on enhancing the coronary arteries, contrast timing in congenital heart disease requires enhancement of both ventricles, including the large vessels, and may further depend on the specific clinical question that has to be answered. As a result, some larger amounts of contrast agent are needed with longer injection times that simultaneously enhance the systemic and pulmonary circulation (e.g., in adults: ~100–120 ml for simultaneous enhancement of the aorta and pulmonary arteries compared with 50–80 ml for coronary CT angiography alone). Care should be taken for adequate contrast timing in cases where shunts are present, such as after Fontan repair or presence of other caval vein-to-pulmonary shunts. For pediatric CT, the volume of contrast agent needed depends on patient weight, and contrast doses of 1.0–3.0 ml/kg have been advised [174,194]. Although power injection is generally advised, manual injection of contrast agent can also be applied, especially in neonates where contrast administration is difficult due to small vessel size and smallgauge catheter use. Apart from contrast bolus administration, a 1:1 [195] or 2:1 ratio [196] of contrast agent and saline solution can be used for homogenous contrast enhancement and to minimize streak artifacts in pediatric CT [194]. In addition, diluting the contrast agent lowers viscosity that facilitates injection speed through the small-gauge catheters.
Current status
Although CT has several advantages for imaging congenital heart disease, there are some limitations of note. CT compared with MRI cannot directly measure flow velocity and volumes across valves and vessels (e.g., for quantifying pulmonary valve stenosis and/or regurgitation). However, in the absence of other valvular insufficiencies or cardiac shunt, CT may be used to quantify the percentage pulmonary valve regurgitation similar as with MRI by subtracting LV from RV stroke volume, divided by the RV enddiastolic volume [197]. However, in patients with multiple valvular lesions, this technique cannot be applied.
Another disadvantage of CT is radiation exposure. Radiation dose and the associated risk of developing radiation-induced cancer is of special concern in pediatric patients, since children have higher susceptibility to radiation and a longer life expectancy than adults [198,199]. Effective dose assessment in pediatric applications of CT requires special attention. Dedicated conversion factors are available to calculate effective dose from dose length product in children [200].
Various scan protocols are available to determine optimal tube-current and tube-voltage settings in pediatric CT with or without ECG synchronization [174,196]. Although effective doses up to 26 mSv have been reported with retrospective ECG-gating techniques [201], good-quality low-dose examinations of approximately 1 mSv can be obtained with current scan techniques by using prospective ECG triggering [181,202,203]. Although radiation dose increases when functional analysis is requested (in adult patients this is up to approximately 5–9 mSv [140,144,204]), with new prospective ECG-gating techniques this can be as low as 3.8 mSv for CT angiography, including cardiac functional analysis [143] or 3–4 mSv with low-dose retrospective ECGgating techniques when only functional analysis is requested [108]. This CT dose may still prove favorable compared with invasive angiography that uses radiation doses ranging between 0.6 and 23 mSv for diagnostic procedures [205–207]. Moreover, non-ECG-gated acquisitions may be sufficient when (noncoronary) larger structures are imaged to limit radiation exposure. However, we prefer short acquisition prospective triggering techniques, which improves image quality with the same radiation dose.

Figure 7.CT in congenital heart disease of an 18-year-old male patient with D-transposition of the great arteries after arterial switch operation with reimplantation of the coronary arteries. CT was performed for assessing the location of the coronary artery ostia and status of the coronary arteries. (A–D) Transverse slices: the pulmonary artery is located in front of the ascending aorta after Lecompte procedure. (B & C) The aortic root is dilated (D) above the aortic valve prosthesis. Normal location of the left main (B) and right (C) coronary artery. (E–G) Multiplanar reconstructions of coronary arteries: no coronary artery stenosis in the right coronary artery (E), left anterior descending artery (F) or circumflex/obtuse marginal artery (G). 320-detector row CT investigation, prospectively ECG-triggered CT at mid-diastole. Full heart imaging in single gantry rotation within fraction of a heart beat (350 ms). Patient dose was 3.0 mSv.
Recommendations
With the low complication rate, the low radiation exposure and the smaller volumes of contrast agent with current prospective ECGsynchronized techniques, CT angiography has become a useful tool in the diagnosis and follow- up of patients with congenital heart diseases. According to the Appropriateness criteria, CT is regarded as appropriate in the assessment of complex adult congenital heart disease and for the assessment of anomalous coronary arterial and/or other thoracic arterial and venous vessels (Box 1) [3].
Future perspective
Several new clinical applications of cardiac CT are now the subject of scientific research. For example, CT has become available on flat panel cardiac fluoroscopy systems, where CT acquisition is performed by rotation of the C-arm [208]. This development could improve the image guidance of cardiac interventions. However, due to the limitations in image quality and the long acquisition time of rotational C-arm CT angiography it is not considered in the near future as an alternative for diagnostic coronary CT angiography with a dedicated cardiac CT scanner. Dual-energy CT has become available and it has been suggested that contrast-enhanced dual-energy CT angiography has potential for the comprehensive analysis of coronary artery morphology, as well as changes in myocardial perfusion [209]. Further research is required to assess the clinical value of dual-energy in cardiac applications of CT.
In this section, two promising developments in cardiac CT are presented: late-enhancement imaging and CT myocardial perfusion imaging. It is desirable that technological opportunities for further reduction of patient dose will be realized in the future.
CT late-enhancement imaging
In ischemic heart disease, myocardial lateenhancement imaging can be used to distinguish viable from nonviable myocardium [210,211]. Clinical relevance is that dysfunctional, but viable, myocardium may improve after revascularization therapy, whereas nonviable myocardium will not [212]. Late-enhancement imaging has been developed with MRI, but CT late-enhancement imaging is also feasible [213,214]. The concept of CT late-enhancement imaging is comparable to that of late-enhancement imaging with MRI owing to comparable pharmacokinetic behavior of CT and MRI contrast agents in the myocardial tissue [213]. However, there are limitations for CT late-enhancement imaging compared with MRI. The contrast resolution of CT is not as good as with MRI [213,214]. The percentage signal increase with CT has been found to be approximately ten-times lower than with MRI. Furthermore, the contrast-to-noise ratio is approximately fourtimes lower than that of MRI [213]. Therefore, large quantities of contrast agent of approximately 120–150 ml are needed [214–216], which exceeds the amount of 50–80 ml that is currently needed for coronary CT angiography. Nevertheless, sensitivity for late-enhancement imaging remains somewhat lower with CT as compared with MRI and late-enhancement may be missed. Additionally, CT blooming artifacts may lead to overestimation of infarct size [214]. Moreover, late-enhancement imaging is associated with a radiation dose of approximately 4 mSv. Usually two scans are performed, one for coronary artery imaging and a second scan for late enhancement that further increases dose [214,215]. CT late-enhancement imaging is feasible, and may be an acceptable alternative when MRI is contraindicated. However, the associated additional contrast administration and radiation dose, and the lower accuracy for assessing viability than MRI, limit routine clinical application of CT for late-enhancement imaging.
CT myocardial perfusion imaging
Coronary CT angiography has been accepted as an imaging tool for the noninvasive evaluation of patients with low-to-intermediate pretest probability for coronary artery disease. The main strength of coronary CT angiography is ruling out coronary artery disease [66,138]. In addition, coronary CT angiography has a prognostic value, where the risk of death is almost zero with a normal coronary CT angiography, and the risk of events, including nonfatal myocardial infarction, unstable angina or revascularization, is less than 1% (follow-up duration: 15–18 months) [217,218]. In the case of significant coronary artery stenosis, the risk of event is in the range of 5 to 50%, which varies depending on the severity of stenosis [204,217–220]. However, these prognostic value numbers for patients with coronary artery disease found in populations are only of limited value for individual patients who may or may not develop complications. Moreover, it has been demonstrated that the functional relevance of a stenosis found is difficult to predict [221–225]. The limited correlation between severity of stenosis and its functional relevance is not only limited to coronary CT angiography but is also the case for invasive coronary angiography [221–223,226]. Therefore, dependent on patient presentation and coronary anatomy, anatomic evaluation of stenosis alone is not sufficient for diagnosing ischemic heart disease and functional testing, such as measuring the fractional flow reserve or stress perfusion imaging, remains essential to determine appropriate management as well as before revascularization treatment [219,221,222].
CT myocardial stress imaging
Myocardial stress imaging is needed to assess stenoses that reduce maximum blood flow but not resting flow. By using vasodilators, such as adenosine or dipyridamole, severe coronary artery stenoses can be detected by assessment of compromised hyperemic flow. Rest perfusion is used to determine whether perfusion defects are fixed, or partially or completely reversible. Myocardial perfusion imaging is most often performed by SPECT, but can also be carried out with MRI or PET [227–229]. Myocardial perfusion imaging using SPECT has been shown to be of incremental value to coronary CT angiography in the detection of hemodynamic significant coronary artery disease [230]. CT can potentially be used for myocardial perfusion imaging as well. The concept of a single cardiac CT examination for coronary stenosis imaging and functional imaging by perfusion is interesting, and has shown feasibility with acceptable radiation dose. CT stress and rest perfusion imaging, including imaging of the coronary arteries, has been achieved with a total effective exposure of 11.8 ± 4.5 mSv [231]. Preliminary patient studies have shown that adenosine CT stress perfusion imaging has diagnostic accuracy comparable with SPECT or stress perfusion by MRI for detecting significant coronary artery stenosis [227–229]. In another study, the combination of coronary CT angiography and adenosine CT stress perfusion imaging was found to be comparable to the combination of invasive coronary angiography and SPECT for predicting coronary artery stenosis [232]. Comparable performance of CT perfusion imaging and SPECT has also been found by using dipyridamole CT stress perfusion imaging [233].
Coronary CT angiography combined with CT perfusion imaging may be particularly useful in high-risk patients with a large calcified plaque burden or stents, and could help in guiding clinicians in assessing the need for invasive coronary angiography and revascularization [231]. Next to the simultaneous imaging of the morphologic coronary artery stenosis and functional hemodynamic perfusion effect, CT may have other advantages as compared with other perfusion modalities, such as SPECT or MRI (e.g., short scan times and superior spatial resolution). As with MRI, CT has the capability to detect subendocardial perfusion defects that are missed on SPECT. CT potentially allows quantification of myocardial blood flow [234]. Since both aspects of coronary stenosis and ischemia can be imaged with a single scanner, CT may also save costs compared with a combination of tests using different imaging modalities to complete the diagnosis ischemic heart disease.
Radiation dose reduction
Finally, an important future challenge will be to achieve further radiation dose reduction in cardiac applications of CT. In this field, a lot has been achieved already. Initially, coronary CT angiography with retrospective gated reconstructions was associated with a relatively high effective dose of 12–21 mSv [138–142,171]. The latest helical dual-source and axial volumetric CT scanners allow for performing ‘single-beat’ coronary CT angiography at an effective dose of 5 mSv or even lower [7,235]. A new technology that may help to reduce patient exposure further is the iterative reconstruction algorithm [236,237]. However, the potential improved performance of an iterative reconstruction compared with a filtered backprojection still has to be assessed in clinical practice for cardiac CT applications. The detectors that are currently used in CT are already very efficient, but the introduction of, for example, photon counting detectors in CT may help to improve CT detector performance and to achieve dose reduction [238]. However, the introduction of photon-counting detectors in clinical CT is not expected in the near future.
Financial & competing interests disclosure
The authors have no relevant affiliations or financial involvement with any organization or entity with a financial interest in or financial conflict with the subject matter or materials discussed in the manuscript. This includes employment, consultancies, honoraria, stock ownership or options, expert testimony, grants or patents received or pending, or royalties.
No writing assistance was utilized in the production of this manuscript.
Papers of special note have been highlighted as:
* of interest
References
- Achenbach S, Ulzheimer S, Baum U et al.: Noninvasive coronary angiography by retrospectively ECG-gated multislice spiral CT. Circulation 102, 2823–2828 (2000).
- Ohnesorge B, Flohr T, Becker C et al.: Cardiac imaging by means of electrocardiographically gated multisection spiral CT: initial experience. Radiology 217, 564–571 (2000).
- Taylor AJ, Cerqueira M, Hodgson JM et al.: ACCF/SCCT/ACR/AHA/ASE/ASNC/ NASCI/SCAI/SCMR 2010 appropriate use criteria for cardiac computed tomography: a report of the American College of Cardiology Foundation Appropriate Use Criteria Task Force, the Society of Cardiovascular Computed Tomography, the American College of Radiology, the American Heart Association, the American Society of Echocardiography, the American Society of Nuclear Cardiology, the North American Society for Cardiovascular Imaging, the Society for Cardiovascular Angiography and Interventions, and the Society for Cardiovascular Magnetic Resonance. J. Am. Coll. Cardiol. 56, 1864–1894 (2010). & Provides guidelines for appropriate use of cardiac CT.
- Hsieh J, Londt J, Vass M, Li J, Tang X, Okerlund D: Step-and-shoot data acquisition and reconstruction for cardiac x-ray computed tomography. Med. Phys. 33, 4236–4248 (2006).
- Earls JP, Berman EL, Urban BA et al.: Prospectively gated transverse coronary CT angiography versus retrospectively gated helical technique: improved image quality and reduced radiation dose. Radiology 246, 742–753 (2008).
- Achenbach S, Marwan M, Ropers D et al.: Coronary computed tomography angiography with a consistent dose below 1 mSv using prospectively electrocardiogram-triggered high-pitch spiral acquisition. Eur. Heart J. 31, 340–346 (2010).
- Einstein AJ, Elliston CD, Arai AE et al.: Radiation dose from single-heartbeat coronary CT angiography performed with a 320-detector row volume scanner. Radiology 254, 698–706 (2010).
- Kroft LJ, de Roos A, Geleijns J: Artifacts in ECG-synchronized MDCT coronary angiography. AJR Am. J. Roentgenol. 189, 581–591 (2007).
- Eggen DA, Strong JP, McGill HC Jr: Coronary calcification. Relationship to clinically significant coronary lesions and race, sex, and topographic distribution. Circulation 32, 948–955 (1965).
- Hoff JA, Chomka EV, Krainik AJ, Daviglus M, Rich S, Kondos GT: Age and gender distributions of coronary artery calcium detected by electron beam tomography in 35,246 adults. Am. J. Cardiol. 87, 1335–1339 (2001).
- Keelan PC, Bielak LF, Ashai K et al.: Long-term prognostic value of coronary calcification detected by electron-beam computed tomography in patients undergoing coronary angiography. Circulation 104, 412–417 (2001).
- Wong ND, Hsu JC, Detrano RC, Diamond G, Eisenberg H, Gardin JM: Coronary artery calcium evaluation by electron beam computed tomography and its relation to new cardiovascular events. Am. J. Cardiol. 86, 495–498 (2000).
- Carr JJ, Crouse JR, Goff DC Jr, D’Agostino RB Jr, Peterson NP, Burke GL: Evaluation of subsecond gated helical CT for quantification of coronary artery calcium and comparison with electron beam CT. AJR Am. J. Roentgenol. 174, 915–921 (2000).
- Agatston AS, Janowitz WR, Hildner FJ, Zusmer NR, Viamonte M Jr, Detrano R: Quantification of coronary artery calcium using ultrafast computed tomography. J. Am. Coll. Cardiol. 15, 827–832 (1990).
- Becker CR, Kleffel T, Crispin A et al.: Coronary artery calcium measurement: agreement of multirow detector and electron beam CT. AJR Am. J. Roentgenol. 176, 1295–1298 (2001).
- Becker CR, Jakobs TF, Aydemir S et al.: Helical and single-slice conventional CT versus electron beam CT for the quantification of coronary artery calcification. AJR Am. J. Roentgenol. 174, 543–547 (2000).
- Kopp AF, Ohnesorge B, Becker C et al.: Reproducibility and accuracy of coronary calcium measurements with multi-detector row versus electron-beam CT. Radiology 225, 113–119 (2002).
- Ulzheimer S, Kalender WA: Assessment of calcium scoring performance in cardiac computed tomography. Eur. Radiol. 13, 484–497 (2003).
- Stanford W, Thompson BH, Burns TL, Heery SD, Burr MC: Coronary artery calcium quantification at multi-detector row helical CT versus electron-beam CT. Radiology 230, 397–402 (2004).
- Hassan A, Nazir SA, Alkadhi H: Technical challenges of coronary CT angiography: today and tomorrow. Eur. J. Radiol. doi:10.1016/j.ejrad.2010.02.011 (2010) (Epub ahead of print).
- Callister TQ, Cooil B, Raya SP, Lippolis NJ, Russo DJ, Raggi P: Coronary artery disease: improved reproducibility of calcium scoring with an electron-beam CT volumetric method. Radiology 208, 807–814 (1998).
- Hoffmann U, Siebert U, Bull-Stewart A et al.: Evidence for lower variability of coronary artery calcium mineral mass measurements by multi-detector computed tomography in a community-based cohort – consequences for progression studies. Eur. J. Radiol. 57, 396–402 (2006).
- Budoff MJ, Shaw LJ, Liu ST et al.: Long-term prognosis associated with coronary calcification: observations from a registry of 25,253 patients. J. Am. Coll. Cardiol. 49, 1860–1870 (2007).
- Rumberger JA, Brundage BH, Rader DJ, Kondos G: Electron beam computed tomographic coronary calcium scanning: a review and guidelines for use in asymptomatic persons. Mayo Clin. Proc. 74, 243–252 (1999).
- Greenland P, Bonow RO, Brundage BH et al.: ACCF/AHA 2007 clinical expert consensus document on coronary artery calcium scoring by computed tomography in global cardiovascular risk assessment and in evaluation of patients with chest pain: a report of the American College of Cardiology Foundation Clinical Expert Consensus Task Force (ACCF/AHA writing committee to update the 2000 expert consensus document on electron beam computed tomography). Circulation 115, 402–426 (2007).
- Oudkerk M, Stillman AE, Halliburton SS et al.: Coronary artery calcium screening: current status and recommendations from the European Society of Cardiac Radiology and North American Society for cardiovascular imaging. Int. J. Cardiovasc. Imaging 24, 645–671 (2008).
- Blaha M, Budoff MJ, Shaw LJ et al.: Absence of coronary artery calcification and all-cause mortality. JACC Cardiovasc. Imaging 2, 692–700 (2009).
- Sarwar A, Shaw LJ, Shapiro MD et al.: Diagnostic and prognostic value of absence of coronary artery calcification. JACC Cardiovasc. Imaging 2, 675–688 (2009).
- Shaw LJ, Raggi P, Schisterman E, Berman DS, Callister TQ: Prognostic value of cardiac risk factors and coronary artery calcium screening for all-cause mortality. Radiology 228, 826–833 (2003).
- Arad Y, Goodman KJ, Roth M, Newstein D, Guerci AD: Coronary calcification, coronary disease risk factors, C-reactive protein, and atherosclerotic cardiovascular disease events: the St. Francis Heart Study. J. Am. Coll. Cardiol. 46, 158–165 (2005).
- Kondos GT, Hoff JA, Sevrukov A et al.: Electron-beam tomography coronary artery calcium and cardiac events: a 37-month follow-up of 5635 initially asymptomatic low- to intermediate-risk adults. Circulation 107, 2571–2576 (2003).
- Park R, Detrano R, Xiang M et al.: Combined use of computed tomography coronary calcium scores and C-reactive protein levels in predicting cardiovascular events in nondiabetic individuals. Circulation 106, 2073–2077 (2002).
- Raggi P, Callister TQ, Cooil B et al.: Identification of patients at increased risk of first unheralded acute myocardial infarction by electron-beam computed tomography. Circulation 101, 850–855 (2000).
- Rubinshtein R, Gaspar T, Halon DA, Goldstein J, Peled N, Lewis BS: Prevalence and extent of obstructive coronary artery disease in patients with zero or low calcium score undergoing 64-slice cardiac multidetector computed tomography for evaluation of a chest pain syndrome. Am. J. Cardiol. 99, 472–475 (2007).
- Marwan M, Ropers D, Pflederer T, Daniel WG, Achenbach S: Clinical characteristics of patients with obstructive coronary lesions in the absence of coronary calcification: an evaluation by coronary CT angiography. Heart 95, 1056–1060 (2009).
- Henneman MM, Schuijf JD, Pundziute G et al.: Noninvasive evaluation with multislice computed tomography in suspected acute coronary syndrome: plaque morphology on multislice computed tomography versus coronary calcium score. J. Am. Coll. Cardiol. 52, 216–222 (2008).
- Shaw LJ, Raggi P, Berman DS, Callister TQ: Coronary artery calcium as a measure of biologic age. Atherosclerosis 188, 112–119 (2006).
- Schmermund A, Mohlenkamp S, Berenbein S et al.: Population-based assessment of subclinical coronary atherosclerosis using electron-beam computed tomography. Atherosclerosis 185, 177–182 (2006).
- McClelland RL, Chung H, Detrano R, Post W, Kronmal RA: Distribution of coronary artery calcium by race, gender, and age: results from the Multi-Ethnic Study of Atherosclerosis (MESA). Circulation 113, 30–37 (2006).
- Raggi P, Gongora MC, Gopal A, Callister TQ, Budoff M, Shaw LJ: Coronary artery calcium to predict all-cause mortality in elderly men and women. J. Am. Coll. Cardiol. 52, 17–23 (2008).
- Polonsky TS, McClelland RL, Jorgensen NW et al.: Coronary artery calcium score and risk classification for coronary heart disease prediction. JAMA 303, 1610–1616 (2010).
- Church TS, Levine BD, McGuire DK et al.: Coronary artery calcium score, risk factors, and incident coronary heart disease events. Atherosclerosis 190, 224–231 (2007).
- Greenland P, LaBree L, Azen SP, Doherty TM, Detrano RC: Coronary artery calcium score combined with Framingham score for risk prediction in asymptomatic individuals. JAMA 291, 210–215 (2004).
- van der Bijl N, de Bruin PW, Geleijns J et al.: Assessment of coronary artery calcium by using volumetric 320-row multi-detector computed tomography: comparison of 0.5 mm with 3.0 mm slice reconstructions. Int. J. Cardiovasc. Imaging 26, 473–482 (2010).
- Muhlenbruch G, Thomas C, Wildberger JE et al.: Effect of varying slice thickness on coronary calcium scoring with multislice computed tomography in vitro and in vivo. Invest Radiol. 40, 695–699 (2005).
- Groen JM, Greuter MJ, Schmidt B, Suess C, Vliegenthart R, Oudkerk M: The influence of heart rate, slice thickness, and calcification density on calcium scores using 64-slice multidetector computed tomography: a systematic phantom study. Invest Radiol. 42, 848–855 (2007).
- Muhlenbruch G, Klotz E, Wildberger JE et al.: The accuracy of 1- and 3-mm slices in coronary calcium scoring using multi-slice CT in vitro and in vivo. Eur. Radiol. 17, 321–329 (2007).
- Vliegenthart R, Song B, Hofman A, Witteman JC, Oudkerk M: Coronary calcification at electron-beam CT: effect of section thickness on calcium scoring in vitro and in vivo. Radiology 229, 520–525 (2003).
- Horiguchi J, Matsuura N, Yamamoto H et al.: Variability of repeated coronary artery calcium measurements by 1.25-mmand 2.5-mm-thickness images on prospective electrocardiograph-triggered 64-slice CT. Eur. Radiol. 18, 209–216 (2008).
- van der Bijl N, Joemai RM, Geleijns J et al.: Assessment of Agatston coronary artery calcium score using contrast-enhanced CT coronary angiography. AJR Am. J. Roentgenol. 195, 1299–1305 (2010).
- Hong C, Becker CR, Schoepf UJ, Ohnesorge B, Bruening R, Reiser MF: Coronary artery calcium: absolute quantification in nonenhanced and contrast-enhanced multi-detector row CT studies. Radiology 223, 474–480 (2002).
- Glodny B, Helmel B, Trieb T et al.: A method for calcium quantification by means of CT coronary angiography using 64-multidetector CT: very high correlation with Agatston and volume scores. Eur. Radiol. 19, 1661–1668 (2009).
- Hong C, Bae KT, Pilgram TK, Suh J, Bradley D: Coronary artery calcium measurement with multi-detector row CT: in vitro assessment of effect of radiation dose. Radiology 225, 901–906 (2002).
- van Werkhoven JM, Schuijf JD, Gaemperli O et al.: Incremental prognostic value of multi-slice computed tomography coronary angiography over coronary artery calcium scoring in patients with suspected coronary artery disease. Eur. Heart J. 30, 2622–2629 (2009).
- Ostrom MP, Gopal A, Ahmadi N et al.: Mortality incidence and the severity of coronary atherosclerosis assessed by computed tomography angiography. J. Am. Coll. Cardiol. 52, 1335–1343 (2008).
- Greenland P, Alpert JS, Beller GA et al.: 2010 ACCF/AHA guideline for assessment of cardiovascular risk in asymptomatic adults: a report of the American College of Cardiology Foundation/American Heart Association Task Force on practice guidelines. Circulation 122, E584–E636 (2010).
- McEvoy JW, Blaha MJ, Defilippis AP et al.: Coronary artery calcium progression: an important clinical measurement? A review of published reports. J. Am. Coll. Cardiol. 56, 1613–1622 (2010).
- Pannu HK, Sullivan C, Lai S, Fishman EK: Evaluation of the effectiveness of oral b-blockade in patients for coronary computed tomographic angiography. J. Comput. Assist. Tomogr. 32, 247–251 (2008).
- de Graaf FR, Schuijf JD, van Velzen JE et al.: Evaluation of contraindications and efficacy of oral b blockade before computed tomographic coronary angiography. Am. J. Cardiol. 105, 767–772 (2010).
- Dewey M, Zimmermann E, Deissenrieder F et al.: Noninvasive coronary angiography by 320-row computed tomography with lower radiation exposure and maintained diagnostic accuracy: comparison of results with cardiac catheterization in a head-to-head pilot investigation. Circulation 120, 867–875 (2009).
- Dewey M, Hoffmann H, Hamm B: Multislice CT coronary angiography: effect of sublingual nitroglycerine on the diameter of coronary arteries. Rofo 178, 600–604 (2006).
- Chun EJ, Lee W, Choi YH et al.: Effects of nitroglycerin on the diagnostic accuracy of electrocardiogram-gated coronary computed tomography angiography. J. Comput. Assist. Tomogr. 32, 86–92 (2008).
- Mowatt G, Cook JA, Hillis GS et al.: 64-slice computed tomography angiography in the diagnosis and assessment of coronary artery disease: systematic review and meta-analysis. Heart 94, 1386–1393 (2008).
- Stein PD, Yaekoub AY, Matta F, Sostman HD: 64-slice CT for diagnosis of coronary artery disease: a systematic review. Am. J. Med. 121, 715–725 (2008).
- Meijer AB, YL O, Geleijns J, Kroft LJ: Meta-analysis of 40- and 64-MDCT angiography for assessing coronary artery stenosis. AJR Am. J. Roentgenol. 191, 1667–1675 (2008).
- Budoff MJ, Dowe D, Jollis JG et al.: Diagnostic performance of 64-multidetector row coronary computed tomographic angiography for evaluation of coronary artery stenosis in individuals without known coronary artery disease: results from the prospective multicenter ACCURACY (Assessment by Coronary Computed Tomographic Angiography of Individuals Undergoing Invasive Coronary Angiography) trial. J. Am. Coll. Cardiol. 52, 1724–1732 (2008).
- Budoff MJ, Achenbach S, Blumenthal RS et al.: Assessment of coronary artery disease by cardiac computed tomography: a scientific statement from the American Heart Association Committee on Cardiovascular Imaging and Intervention, Council on Cardiovascular Radiology and Intervention, and Committee on Cardiac Imaging, Council on Clinical Cardiology. Circulation 114, 1761–1791 (2006).
- Bluemke DA, Achenbach S, Budoff M et al.: Noninvasive coronary artery imaging: magnetic resonance angiography and multidetector computed tomography angiography: a scientific statement from the american heart association committee on cardiovascular imaging and intervention of the council on cardiovascular radiology and intervention, and the councils on clinical cardiology and cardiovascular disease in the young. Circulation 118, 586–606 (2008).
- Raff GL, Gallagher MJ, O’Neill WW, Goldstein JA: Diagnostic accuracy of noninvasive coronary angiography using 64-slice spiral computed tomography. J. Am. Coll. Cardiol. 46, 552–557 (2005).
- Ropers D, Pohle FK, Kuettner A et al.: Diagnostic accuracy of noninvasive coronary angiography in patients after bypass surgery using 64-slice spiral computed tomography with 330-ms gantry rotation. Circulation 114, 2334–2341 (2006).
- Pasricha SS, Nandurkar D, Seneviratne SK et al.: Image quality of coronary 320-MDCT in patients with atrial fibrillation: initial experience. AJR Am. J. Roentgenol. 193, 1514–1521 (2009).
- Sabik JF, III, Lytle BW, Blackstone EH, Houghtaling PL, Cosgrove DM: Comparison of saphenous vein and internal thoracic artery graft patency by coronary system. Ann. Thorac. Surg. 79, 544–551 (2005).
- Hamon M, Lepage O, Malagutti P et al.: Diagnostic performance of 16- and 64-section spiral CT for coronary artery bypass graft assessment: meta-analysis. Radiology 247, 679–686 (2008).
- Malagutti P, Nieman K, Meijboom WB et al.: Use of 64-slice CT in symptomatic patients after coronary bypass surgery: evaluation of grafts and coronary arteries. Eur. Heart J. 28, 1879–1885 (2007).
- Nazeri I, Shahabi P, Tehrai M, Sharif- Kashani B, Nazeri A: Assessment of patients after coronary artery bypass grafting using 64-slice computed tomography. Am. J. Cardiol. 103, 667–673 (2009).
- Webb CM, Moat NE, Chong CF, Collins P: Vascular reactivity and flow characteristics of radial artery and long saphenous vein coronary bypass grafts: a 5-year follow-up. Circulation 122, 861–867 (2010).
- Madssen E, Haere P, Wiseth R: Radial artery diameter and vasodilatory properties after transradial coronary angiography. Ann. Thorac. Surg. 82, 1698–1702 (2006).
- Mark DB, Berman DS, Budoff MJ et al.: ACCF/ACR/AHA/NASCI/SAIP/SCAI/ SCCT 2010 expert consensus document on coronary computed tomographic angiography: a report of the American College of Cardiology Foundation Task Force on Expert Consensus Documents. J. Am. Coll. Cardiol. 55, 2663–2699 (2010). & Consensus document for use of coronary CT angiography.
- Roiron C, Sanchez P, Bouzamondo A, Lechat P, Montalescot G: Drug eluting stents: an updated meta-analysis of randomised controlled trials. Heart 92, 641–649 (2006).
- Seifarth H, Ozgun M, Raupach R et al.: 64- versus 16-slice CT angiography for coronary artery stent assessment: in vitro experience. Invest. Radiol. 41, 22–27 (2006).
- Maintz D, Seifarth H, Raupach R et al.: 64-slice multidetector coronary CT angiography: in vitro evaluation of 68 different stents. Eur. Radiol. 16, 818–826 (2006).
- Schepis T, Koepfli P, Leschka S et al.: Coronary artery stent geometry and in-stent contrast attenuation with 64-slice computed tomography. Eur. Radiol. 17, 1464–1473 (2007).
- Schlosser T, Scheuermann T, Ulzheimer S et al.: In-vitro evaluation of coronary stents and 64-detector-row computed tomography using a newly developed model of coronary artery stenosis. Acta Radiol. 49, 56–64 (2008).
- Maintz D, Burg MC, Seifarth H et al.: Update on multidetector coronary CT angiography of coronary stents: in vitro evaluation of 29 different stent types with dual-source CT. Eur. Radiol. 19, 42–49 (2009).
- Zidan M, Nicoll R, Schmermund A, Henein M: Cardiac multi-detector CT: its unique contribution to cardiology practice. Int. J. Cardiol. 132, 25–29 (2009).
- Hamon M, Champ-Rigot L, Morello R, Riddell JW, Hamon M: Diagnostic accuracy of in-stent coronary restenosis detection with multislice spiral computed tomography: a meta-analysis. Eur. Radiol. 18, 217–225 (2008).
- Sun Z, Almutairi AM: Diagnostic accuracy of 64 multislice CT angiography in the assessment of coronary in-stent restenosis: a meta-analysis. Eur. J. Radiol. 73, 266–273 (2010).
- Kumbhani DJ, Ingelmo CP, Schoenhagen P, Curtin RJ, Flamm SD, Desai MY: Metaanalysis of diagnostic efficacy of 64-slice computed tomography in the evaluation of coronary in-stent restenosis. Am. J. Cardiol. 103, 1675–1681 (2009).
- Serruys PW, Ormiston JA, Onuma Y et al.: A bioabsorbable everolimus-eluting coronary stent system (ABSORB): 2-year outcomes and results from multiple imaging methods. Lancet 373, 897–910 (2009).
- Ghaye B, Remy J, Remy-Jardin M: Non-traumatic thoracic emergencies: CT diagnosis of acute pulmonary embolism: the first 10 years. Eur. Radiol. 12, 1886–1905 (2002).
- Hayter RG, Rhea JT, Small A, Tafazoli FS, Novelline RA: Suspected aortic dissection and other aortic disorders: multi-detector row CT in 373 cases in the emergency setting. Radiology 238, 841–852 (2006).
- White CS, Kuo D: Chest pain in the emergency department: role of multidetector CT. Radiology 245, 672–681 (2007).
- Takakuwa KM, Halpern EJ: Evaluation of a “triple rule-out” coronary CT angiography protocol: use of 64-section CT in low-tomoderate risk emergency department patients suspected of having acute coronary syndrome. Radiology 248, 438–446 (2008).
- Shuman WP, Branch KR, May JM et al.: Whole-chest 64-MDCT of emergency department patients with nonspecific chest pain: radiation dose and coronary artery image quality with prospective ECG triggering versus retrospective ECG gating. AJR Am. J. Roentgenol. 192, 1662–1667 (2009).
- Johnson TR, Nikolaou K, Wintersperger BJ et al.: ECG-gated 64-MDCT angiography in the differential diagnosis of acute chest pain. AJR Am. J. Roentgenol. 188, 76–82 (2007).
- Savino G, Herzog C, Costello P, Schoepf UJ: 64 slice cardiovascular CT in the emergency department: concepts and first experiences. Radiol. Med. 111, 481–496 (2006).
- Vrachliotis TG, Bis KG, Haidary A et al.: Atypical chest pain: coronary, aortic, and pulmonary vasculature enhancement at biphasic single-injection 64-section CT angiography. Radiology 243, 368–376 (2007).
- Halpern EJ: Triple-rule-out CT angiography for evaluation of acute chest pain and possible acute coronary syndrome. Radiology 252, 332–345 (2009).
- Lee HY, Yoo SM, White CS: Coronary CT angiography in emergency department patients with acute chest pain: triple rule-out protocol versus dedicated coronary CT angiography. Int. J. Cardiovasc. Imaging 25, 319–326 (2009).
- Heyer CM, Mohr PS, Lemburg SP, Peters SA, Nicolas V: Image quality and radiation exposure at pulmonary CT angiography with 100- or 120-kVp protocol: prospective randomized study. Radiology 245, 577–583 (2007).
- Schueller-Weidekamm C, Schaefer-Prokop CM, Weber M, Herold CJ, Prokop M: CT angiography of pulmonary arteries to detect pulmonary embolism: improvement of vascular enhancement with low kilovoltage settings. Radiology 241, 899–907 (2006).
- Morin RL, Gerber TC, McCollough CH: Radiation dose in computed tomography of the heart. Circulation 107, 917–922 (2003).
- Blanke P, Bulla S, Baumann T et al.: Thoracic aorta: prospective electrocardiographically triggered CT angiography with dual-source CT – feasibility, image quality, and dose reduction. Radiology 255, 207–217 (2010).
- Roos JE, Willmann JK, Weishaupt D, Lachat M, Marincek B, Hilfiker PR: Thoracic aorta: motion artifact reduction with retrospective and prospective electrocardiography-assisted multi-detector row CT. Radiology 222, 271–277 (2002).
- White CS, Kuo D, Kelemen M et al.: Chest pain evaluation in the emergency department: can MDCT provide a comprehensive evaluation? AJR Am. J. Roentgenol. 185, 533–540 (2005).
- Hiratzka LF, Bakris GL, Beckman JA et al.: 2010 ACCF/AHA/AATS/ACR/ASA/SCA/ SCAI/SIR/STS/SVM guidelines for the diagnosis and management of patients with thoracic aortic disease. A report of the American College of Cardiology Foundation/ American Heart Association Task Force on practice guidelines, American Association for Thoracic Surgery, American College of Radiology, American Stroke Association, Society of Cardiovascular Anesthesiologists, Society for Cardiovascular Angiography and Interventions, Society of Interventional Radiology, Society of Thoracic Surgeons,and Society for Vascular Medicine. J. Am. Coll. Cardiol. 55, E27–E129 (2010).
- Kaufman JA, Lee MJ: Vascular and Interventional Radiology: The Requisites. Mosby, USA, 219–245 (2010).
- Dogan H, Kroft LJ, Huisman MV et al.: Assessment of right ventricular function in acute pulmonary embolism using ECGsynchronized MDCT. AJR Am. J. Roentgenol. 195, 909–915 (2010).
- Stillman AE, Oudkerk M, Ackerman M et al.: Use of multidetector computed tomography for the assessment of acute chest pain: a consensus statement of the North American Society of Cardiac Imaging and the European Society of Cardiac Radiology. Eur. Radiol. 17, 2196–2207 (2007).
- White HD, Norris RM, Brown MA, Brandt PW, Whitlock RM, Wild CJ: Left ventricular end-systolic volume as the major determinant of survival after recovery from myocardial infarction. Circulation 76, 44–51 (1987).
- Zornoff LA, Skali H, Pfeffer MA et al.: Right ventricular dysfunction and risk of heart failure and mortality after myocardial infarction. J. Am. Coll. Cardiol. 39, 1450–1455 (2002).
- Solomon SD, Anavekar N, Skali H et al.: Influence of ejection fraction on cardiovascular outcomes in a broad spectrum of heart failure patients. Circulation 112, 3738–3744 (2005).
- de Groote P, Millaire A, Foucher-Hossein C et al.: Right ventricular ejection fraction is an independent predictor of survival in patients with moderate heart failure. J. Am. Coll. Cardiol. 32, 948–954 (1998).
- Ghio S, Gavazzi A, Campana C et al.: Independent and additive prognostic value of right ventricular systolic function and pulmonary artery pressure in patients with chronic heart failure. J. Am. Coll. Cardiol. 37, 183–188 (2001).
- Ribeiro A, Lindmarker P, Juhlin-Dannfelt A, Johnsson H, Jorfeldt L: Echocardiography Doppler in pulmonary embolism: right ventricular dysfunction as a predictor of mortality rate. Am. Heart J. 134, 479–487 (197).
- Kasper W, Konstantinides S, Geibel A, Tiede N, Krause T, Just H: Prognostic significance of right ventricular afterload stress detected by echocardiography in patients with clinically suspected pulmonary embolism. Heart 77, 346–349 (1997).
- Grifoni S, Olivotto I, Cecchini P et al.: Short-term clinical outcome of patients with acute pulmonary embolism, normal blood pressure, and echocardiographic right ventricular dysfunction. Circulation 101, 2817–2822 (2000).
- Steinherz LJ, Steinherz PG, Tan CT, Heller G, Murphy ML: Cardiac toxicity 4 to 20 years after completing anthracycline therapy. JAMA 266, 1672–1677 (1991).
- Tassan-Mangina S, Codorean D, Metivier M et al.: Tissue Doppler imaging and conventional echocardiography after anthracycline treatment in adults: early and late alterations of left ventricular function during a prospective study. Eur. J. Echocardiogr. 7, 141–146 (2006).
- Starling MR, Crawford MH, Sorensen SG, Levi B, Richards KL, O’Rourke RA: Comparative accuracy of apical biplane cross-sectional echocardiography and gated equilibrium radionuclide angiography for estimating left ventricular size and performance. Circulation 63, 1075–1084 (1981).
- Bavelaar-Croon CD, Kayser HW, van der Wall EE et al.: Left ventricular function: correlation of quantitative gated SPECT and MR imaging over a wide range of values. Radiology 217, 572–575 (2000).
- van der Wall EE, Vliegen HW, de Roos A, Bruschke AV: Magnetic resonance imaging in coronary artery disease. Circulation 92, 2723–2739 (1995).
- de Roos A, Kunz P, Lamb H et al.: Magnetic resonance imaging of ischemic heart disease: why cardiac magnetic resonance imaging will play a significant role in the management of patients with coronary artery disease. J. Comput. Assist. Tomogr. 23(Suppl. 1), S135–S141 (1999).
- Wu YW, Tadamura E, Yamamuro M et al.: Estimation of global and regional cardiac function using 64-slice computed tomography: a comparison study with echocardiography, gated-SPECT and cardiovascular magnetic resonance. Int. J. Cardiol. 128, 69–76 (2008).
- Guo YK, Gao HL, Zhang XC, Wang QL, Yang ZG, Ma ES: Accuracy and reproducibility of assessing right ventricular function with 64-section multi-detector row CT: comparison with magnetic resonance imaging. Int. J. Cardiol. 139, 254–262 (2010).
- Muller M, Teige F, Schnapauff D, Hamm B, Dewey M: Evaluation of right ventricular function with multidetector computed tomography: comparison with magnetic resonance imaging and analysis of inter- and intraobserver variability. Eur. Radiol. 19, 278–289 (2009).
- Sugeng L, Mor-Avi V, Weinert L et al.: Quantitative assessment of left ventricular size and function: side-by-side comparison of real-time three-dimensional echocardiography and computed tomography with magnetic resonance reference. Circulation 114, 654–661 (2006).
- Juergens KU, Fischbach R: Left ventricular function studied with MDCT. Eur. Radiol. 16, 342–357 (2006).
- de Graaf FR, Schuijf JD, van Velzen JE et al.: Assessment of global left ventricular function and volumes with 320-row multidetector computed tomography: a comparison with 2D-echocardiography. J. Nucl. Cardiol. 17, 225–231 (2010).
- Henneman MM, Schuijf JD, Jukema JW et al.: Assessment of global and regional left ventricular function and volumes with 64-slice MSCT: a comparison with 2D echocardiography. J. Nucl. Cardiol. 13, 480–487 (2006).
- Schlosser T, Mohrs OK, Magedanz A, Voigtlander T, Schmermund A, Barkhausen J: Assessment of left ventricular function and mass in patients undergoing computed tomography (CT) coronary angiography using 64-detector-row CT: comparison to magnetic resonance imaging. Acta Radiol. 48, 30–35 (2007).
- Dogan H, Veldkamp WJ, Dibbets-Schneider P et al.: Effects of heart rate, filling and slice thickness on the accuracy of left ventricular volume measurements in a dynamic cardiac phantom using ECG-gated MDCT. Br. J. Radiol. 81, 577–582 (2008).
- Yamamuro M, Tadamura E, Kubo S et al.: Cardiac functional analysis with multidetector row CT and segmental reconstruction algorithm: comparison with echocardiography, SPECT, and MR imaging. Radiology 234, 381–390 (2005).
- Belge B, Coche E, Pasquet A, Vanoverschelde JL, Gerber BL: Accurate estimation of global and regional cardiac function by retrospectively gated multidetector row computed tomography: comparison with cine magnetic resonance imaging. Eur. Radiol. 16, 1424–1433 (2006).
- Butler J, Shapiro MD, Jassal DS et al.: Comparison of multidetector computed tomography and two-dimensional transthoracic echocardiography for left ventricular assessment in patients with heart failure. Am. J. Cardiol. 99, 247–249 (2007).
- Abbara S, Chow BJ, Pena AJ et al.: Assessment of left ventricular function with 16- and 64-slice multi-detector computed tomography. Eur. J. Radiol. 67, 481–486 (2008).
- Desjardins B, Kazerooni EA: ECG-gated cardiac CT. AJR Am. J. Roentgenol. 182, 993–1010 (2004).
- Miller JM, Rochitte CE, Dewey M et al.: Diagnostic performance of coronary angiography by 64-row CT. N. Engl. J. Med. 359, 2324–2336 (2008).
- Maruyama T, Takada M, Hasuike T, Yoshikawa A, Namimatsu E, Yoshizumi T: Radiation dose reduction and coronary assessability of prospective electrocardiogram-gated computed tomography coronary angiography: comparison with retrospective electrocardiogram-gated helical scan. J. Am. Coll. Cardiol. 52, 1450–1455 (2008).
- Hausleiter J, Meyer T, Hermann F et al.: Estimated radiation dose associated with cardiac CT angiography. JAMA 301, 500–507 (2009).
- Shuman WP, Branch KR, May JM et al.: Prospective versus retrospective ECG gating for 64-detector CT of the coronary arteries: comparison of image quality and patient radiation dose. Radiology 248, 431–437 (2008).
- Pflederer T, Rudofsky L, Ropers D et al.: Image quality in a low radiation exposure protocol for retrospectively ECG-gated coronary CT angiography. AJR Am. J. Roentgenol. 192, 1045–1050 (2009).
- Feuchtner G, Goetti R, Plass A et al.: Dual-step prospective ECG-triggered 128-slice dual-source CT for evaluation of coronary arteries and cardiac function without heart rate control: a technical note. Eur. Radiol. 20, 2092–2099 (2010).
- Hausleiter J, Meyer T, Hadamitzky M et al.: Radiation dose estimates from cardiac multislice computed tomography in daily practice: impact of different scanning protocols on effective dose estimates. Circulation 113, 1305–1310 (2006).
- de Graaf FR, van Werkhoven JM, van Velzen JE et al.: Incremental prognostic value of left ventricular function analysis over non-invasive coronary angiographywith multidetector computed tomography. J. Nucl. Cardiol. 17, 1034–1040 (2010).
- Chow BJ, Wells GA, Chen L et al.: Prognostic value of 64-slice cardiac computed tomography severity of coronary artery disease, coronary atherosclerosis, and left ventricular ejection fraction. J. Am. Coll. Cardiol. 55, 1017–1028 (2010).
- Tops LF, Wood DA, Delgado V et al.: Noninvasive evaluation of the aortic root with multislice computed tomography implications for transcatheter aortic valve replacement. JACC Cardiovasc. Imaging 1, 321–330 (2008).
- Chheda SV, Srichai MB, Donnino R, Kim DC, Lim RP, Jacobs JE: Evaluation of the mitral and aortic valves with cardiac CT angiography. J. Thorac. Imaging 25, 76–85 (2010).
- Chenot F, Montant P, Goffinet C et al.: Evaluation of anatomic valve opening and leaflet morphology in aortic valve bioprosthesis by using multidetector CT: comparison with transthoracic echocardiography. Radiology 255, 377–385 (2010).
- LaBounty TM, Agarwal PP, Chughtai A, Bach DS, Wizauer E, Kazerooni EA: Evaluation of mechanical heart valve size and function with ECG-gated 64-MDCT. AJR Am. J. Roentgenol. 193, W389–W396 (2009).
- Wood DA, Tops LF, Mayo JR et al.: Role of multislice computed tomography in transcatheter aortic valve replacement. Am. J. Cardiol. 103, 1295–1301 (2009).
- Willmann JK, Weishaupt D, Lachat M et al.: Electrocardiographically gated multi-detector row CT for assessment of valvular morphology and calcification in aortic stenosis. Radiology 225, 120–128 (2002).
- Pouleur AC, le Polain de Waroux JB, Pasquet A, Vanoverschelde JL, Gerber BL: Aortic valve area assessment: multidetector CT compared with cine MR imaging and transthoracic and transesophageal echocardiography. Radiology 244, 745–754 (2007).
- Lembcke A, Kivelitz DE, Borges AC et al.: Quantification of aortic valve stenosis: head-to-head comparison of 64-slice spiral computed tomography with transesophageal and transthoracic echocardiography and cardiac catheterization. Invest. Radiol. 44, 7–14 (2009).
- LaBounty TM, Sundaram B, Agarwal P, Armstrong WA, Kazerooni EA, Yamada E: Aortic valve area on 64-MDCT correlates with transesophageal echocardiography in aortic stenosis. AJR Am. J. Roentgenol. 191, 1652–1658 (2008).
- Abdulla J, Sivertsen J, Kofoed KF et al.: Evaluation of aortic valve stenosis by cardiac multislice computed tomography compared with echocardiography: a systematic review and meta-analysis. J. Heart Valve Dis. 18, 634–643 (2009).
- Alkadhi H, Desbiolles L, Husmann L et al.: Aortic regurgitation: assessment with 64-section CT. Radiology 245, 111–121 (2007).
- Rosenhek R, Binder T, Porenta G et al.: Predictors of outcome in severe, asymptomatic aortic stenosis. N. Engl. J. Med. 343, 611–617 (2000).
- Bahler RC, Desser DR, Finkelhor RS, Brener SJ, Youssefi M: Factors leading to progression of valvular aortic stenosis. Am. J. Cardiol. 84, 1044–1048 (1999).
- Gilkeson RC, Markowitz AH, Balgude A, Sachs PB: MDCT evaluation of aortic valvular disease. AJR Am. J. Roentgenol. 186, 350–360 (2006).
- Rivard AL, Bartel T, Bianco RW et al.: Evaluation of aortic root and valve calcifications by multi-detector computed tomography. J. Heart Valve Dis. 18, 662–670 (2009).
- Kurra V, Lieber ML, Sola S et al.: Extent of thoracic aortic atheroma burden and long-term mortality after cardiothoracic surgery: a computed tomography study. JACC Cardiovasc. Imaging 3, 1020–1029 (2010).
- Alkadhi H, Wildermuth S, Bettex DA et al.: Mitral regurgitation: quantification with 16-detector row CT – initial experience. Radiology 238, 454–463 (2006).
- Chen JJ, Manning MA, Frazier AA, Jeudy J, White CS: CT angiography of the cardiac valves: normal, diseased, and postoperative appearances. Radiographics 29, 1393–1412 (2009).
- Feuchtner GM, Alkadhi H, Karlo C et al.: Cardiac CT angiography for the diagnosis of mitral valve prolapse: comparison with echocardiography. Radiology 254, 374–383 (2010).
- Shah RG, Novaro GM, Blandon RJ, Wilkinson L, Asher CR, Kirsch J: Mitral valve prolapse: evaluation with ECG-gated cardiac CT angiography. AJR Am. J. Roentgenol. 194, 579–584 (2010).
- Guo YK, Yang ZG, Ning G et al.: Isolated mitral regurgitation: quantitative assessment with 64-section multidetector CT – comparison with MR imaging and echocardiography. Radiology 252, 369–376 (2009).
- Lembcke A, Borges AC, Dushe S et al.: Assessment of mitral valve regurgitation at electron-beam CT: comparison with Doppler echocardiography. Radiology 236, 47–55 (2005).
- Messika-Zeitoun D, Serfaty JM, Laissy JP et al.: Assessment of the mitral valve area in patients with mitral stenosis by multislice computed tomography. J. Am. Coll. Cardiol. 48, 411–413 (2006).
- Manghat NE, Rachapalli V, van Lingen R, Veitch AM, Roobottom CA, Morgan-Hughes GJ: Imaging the heart valves using ECG-gated 64-detector row cardiac CT. Br. J. Radiol. 81, 275–290 (2008).
- Raff GL, Chinnaiyan KM, Share DA et al.: Radiation dose from cardiac computed tomography before and after implementation of radiation dose-reduction techniques. JAMA 301, 2340–2348 (2009).
- Lee EY, Siegel MJ, Hildebolt CF, Gutierrez FR, Bhalla S, Fallah JH: MDCT evaluation of thoracic aortic anomalies in pediatric patients and young adults: comparison of axial, multiplanar, and 3D images. AJR Am. J. Roentgenol. 182, 777–784 (2004).
- Siegel MJ: Multiplanar and three-dimensional multi-detector row CT of thoracic vessels and airways in the pediatric population. Radiology 229, 641–650 (2003).
- Leschka S, Oechslin E, Husmann L et al.: Pre- and postoperative evaluation of congenital heart disease in children and adults with 64-section CT. Radiographics 27, 829–846 (2007).
- Pappas JN, Donnelly LF, Frush DP: Reduced frequency of sedation of young children with multisection helical CT. Radiology 215, 897–899 (2000).
- Rybicki FJ, Otero HJ, Steigner ML et al.: Initial evaluation of coronary images from 320-detector row computed tomography. Int. J. Cardiovasc. Imaging 24, 535–546 (2008).
- Kroft LJ, Roelofs JJ, Geleijns J: Scan time and patient dose for thoracic imaging in neonates and small children using axial volumetric 320-detector row CT compared to helical 64-, 32-, and 16- detector row CT acquisitions. Pediatr. Radiol. 40, 294–300 (2010).
- Higgins CB, de Roos A.: Magnetic resonance imaging of function and flow in postoperative congenital heart disease. In: MRI and CT of the Cardiovascular System (2nd edition). Lippincott Williams & Wilkins, Hagerstown, USA, 411–440 (2006).
- Didier D, Ratib O, Beghetti M, Oberhaensli I, Friedli B: Morphologic and functional evaluation of congenital heart disease by magnetic resonance imaging. J. Magn Reson. Imaging 10, 639–655 (1999).
- Lee T, Tsai IC, Fu YC et al.: Using multidetector-row CT in neonates with complex congenital heart disease to replace diagnostic cardiac catheterization for anatomical investigation: initial experiences in technical and clinical feasibility. Pediatr. Radiol. 36, 1273–1282 (2006).
- Ben Saad M, Rohnean A, Sigal-Cinqualbre A, Adler G, Paul JF: Evaluation of image quality and radiation dose of thoracic and coronary dual-source CT in 110 infants with congenital heart disease. Pediatr. Radiol. 39, 668–676 (2009).
- Khatri S, Varma SK, Khatri P, Kumar RS: 64-slice multidetector-row computed tomographic angiography for evaluating congenital heart disease. Pediatr. Cardiol. 29, 755–762 (2008).
- Greil GF, Schoebinger M, Kuettner A et al.: Imaging of aortopulmonary collateral arteries with high-resolution multidetector CT. Pediatr. Radiol. 36, 502–509 (2006).
- Ley S, Zaporozhan J, Arnold R et al.: Preoperative assessment and follow-up of congenital abnormalities of the pulmonary arteries using CT and MRI. Eur. Radiol. 17, 151–162 (2007).
- Goo HW, Park IS, Ko JK, Kim YH, Seo DM, Park JJ: Computed tomography for the diagnosis of congenital heart disease in pediatric and adult patients. Int. J. Cardiovasc. Imaging 21, 347–365 (2005).
- Arnold R, Ley S, Ley-Zaporozhan J et al.: Visualization of coronary arteries in patients after childhood Kawasaki syndrome: value of multidetector CT and MR imaging in comparison to conventional coronary catheterization. Pediatr. Radiol. 37, 998–1006 (2007).
- Beier UH, Jelnin V, Jain S, Ruiz CE: Cardiac computed tomography compared to transthoracic echocardiography in the management of congenital heart disease. Catheter. Cardiovasc. Interv. 68, 441–449 (2006).
- Ou P, Marini D, Celermajer DS et al.: Non-invasive assessment of congenital pulmonary vein stenosis in children using cardiac-non-gated CT with 64-slice technology. Eur. J. Radiol. 70, 595–599 (2009).
- Deanfield J, Thaulow E, Warnes C et al.: Management of grown up congenital heart disease. Eur. Heart J. 24, 1035–1084 (2003).
- Eichhorn JG, Jourdan C, Hill SL, Raman SV, Cheatham JP, Long FR: CT of pediatric vascular stents used to treat congenital heart disease. AJR Am. J. Roentgenol. 190, 1241–1246 (2008).
- Eichhorn JG, Long FR, Hill SL et al.: Assessment of in-stent stenosis in small children with congenital heart disease using multi-detector computed tomography: a validation study. Catheter. Cardiovasc. Interv. 68, 11–20 (2006).
- Cook SC, McCarthy M, Daniels CJ, Cheatham JP, Raman SV: Usefulness of multislice computed tomography angiography to evaluate intravascular stents and transcatheter occlusion devices in patients with d-transposition of the great arteries after mustard repair. Am. J. Cardiol. 94, 967–969 (2004).
- Dogan H, Kroft LJ, Bax JJ et al.: MDCT assessment of right ventricular systolic function. AJR Am. J. Roentgenol. 186, S366-S370 (2006).
- Cohen RA, Frush DP, Donnelly LF: Data acquisition for pediatric CT angiography: problems and solutions. Pediatr. Radiol. 30, 813–822 (2000).
- Choo KS, Lee HD, Ban JE et al.: Evaluation of obstructive airway lesions in complex congenital heart disease using composite volume-rendered images from multislice CT. Pediatr. Radiol. 36, 219–223 (2006).
- Tsai IC, Chen MC, Jan SL et al.: Neonatal cardiac multidetector row CT: why and how we do it. Pediatr. Radiol. 38, 438–451 (2008).
- Rebergen SA, Chin JG, Ottenkamp J, van der Wall EE, de Roos A: Pulmonary regurgitation in the late postoperative follow-up of tetralogy of Fallot. Volumetric quantitation by nuclear magnetic resonance velocity mapping. Circulation 88, 2257–2266 (1993).
- Frush DP, Donnelly LF, Rosen NS: Computed tomography and radiation risks: what pediatric health care providers should know. Pediatrics 112, 951–957 (2003).
- Brenner DJ, Elliston CD, Hall EJ, Berdon WE: Estimates of the cancer risks from pediatric CT radiation are not merely theoretical: comment on “point/ counterpoint: in x-ray computed tomography, technique factors should be selected appropriate to patient size against the proposition”. Med. Phys. 28, 2387–2388 (2001).
- Deak PD, Smal Y, Kalender WA: Multisection CT protocols: sex- and age-specific conversion factors used to determine effective dose from dose–length product. Radiology 257, 158–166 (2010).
- Hollingsworth CL, Yoshizumi TT, Frush DP et al.: Pediatric cardiac-gated CT angiography: assessment of radiation dose. AJR Am. J. Roentgenol. 189, 12–18 (2007).
- Goo HW, Seo DM, Yun TJ et al.: Coronary artery anomalies and clinically important anatomy in patients with congenital heart disease: multislice CT findings. Pediatr. Radiol. 39, 265–273 (2009).
- Jin KN, Park EA, Shin CI, Lee W, Chung JW, Park JH: Retrospective versus prospective ECG-gated dual-source CT in pediatric patients with congenital heart diseases: comparison of image quality and radiation dose. Int. J. Cardiovasc. Imaging 26(Suppl. 1), 63–73 (2010).
- Hadamitzky M, Freissmuth B, Meyer T et al.: Prognostic value of coronary computed tomographic angiography for prediction of cardiac events in patients with suspected coronary artery disease. JACC Cardiovasc. Imaging 2, 404–411 (2009).
- Bacher K, Bogaert E, Lapere R, De Wolf D, Thierens H: Patient-specific dose and radiation risk estimation in pediatric cardiac catheterization. Circulation 111, 83–89 (2005).
- Schultz FW, Geleijns J, Spoelstra FM, Zoetelief J: Monte Carlo calculations for assessment of radiation dose to patients with congenital heart defects and to staff during cardiac catheterizations. Br. J. Radiol. 76, 638–647 (2003).
- Rassow J, Schmaltz AA, Hentrich F, Streffer C: Effective doses to patients from paediatric cardiac catheterization. Br. J. Radiol. 73, 172–183 (2000).
- Lauritsch G, Boese J, Wigstrom L, Kemeth H, Fahrig R: Towards cardiac C-arm computed tomography. IEEE Trans. Med. Imaging 25, 922–934 (2006).
- Kang DK, Schoepf UJ, Bastarrika G, Nance JW Jr, Abro JA, Ruzsics B: Dualenergy computed tomography for integrative imaging of coronary artery disease: principles and clinical applications. Semin. Ultrasound CT MR 31, 276–291 (2010).
- Rochitte CE, Lima JA, Bluemke DA et al.: Magnitude and time course of microvascular obstruction and tissue injury after acute myocardial infarction. Circulation 98, 1006–1014 (1998).
- Kim RJ, Fieno DS, Parrish TB et al.: Relationship of MRI delayed contrast enhancement to irreversible injury, infarct age, and contractile function. Circulation 100, 1992–2002 (1999).
- Kim RJ, Wu E, Rafael A et al.: The use of contrast-enhanced magnetic resonance imaging to identify reversible myocardial dysfunction. N. Engl. J. Med. 343, 1445–1453 (2000).
- Gerber BL, Belge B, Legros GJ et al.: Characterization of acute and chronic myocardial infarcts by multidetector computed tomography: comparison with contrast-enhanced magnetic resonance. Circulation 113, 823–833 (2006).
- Boussel L, Ribagnac M, Bonnefoy E et al.: Assessment of acute myocardial infarction using MDCT after percutaneous coronary intervention: comparison with MRI. AJR Am. J. Roentgenol. 191, 441–447 (2008).
- Mahnken AH, Koos R, Katoh M et al.: Assessment of myocardial viability in reperfused acute myocardial infarction using 16-slice computed tomography in comparison to magnetic resonance imaging. J. Am. Coll. Cardiol. 45, 2042–2047 (2005).
- Mahnken AH, Bruners P, Friman O, Hennemuth A: The culprit lesion and its consequences: combined visualization of the coronary arteries and delayed myocardial enhancement in dual-source CT: a pilot study. Eur. Radiol. 20, 2834–2843 (2010).
- Rubinshtein R, Halon DA, Gaspar T, Peled N, Lewis BS: Cardiac computed tomographic angiography for risk stratification and prediction of late cardiovascular outcome events in patients with a chest pain syndrome. Int. J. Cardiol. 137, 108–115 (2009).
- Min JK, Shaw LJ, Devereux RB et al.: Prognostic value of multidetector coronary computed tomographic angiography for prediction of all-cause mortality. J. Am. Coll. Cardiol. 50, 1161–1170 (2007).
- van Werkhoven JM, Gaemperli O, Schuijf JD et al.: Multislice computed tomography coronary angiography for risk stratification in patients with an intermediate pretest likelihood. Heart 95, 1607–1611 (2009).
- Fazel P, Peterman MA, Schussler JM: Three-year outcomes and cost analysis in patients receiving 64-slice computed tomographic coronary angiography for chest pain. Am. J. Cardiol. 104, 498–500 (2009).
- Christou MA, Siontis GC, Katritsis DG, Ioannidis JP: Meta-analysis of fractional flow reserve versus quantitative coronary angiography and noninvasive imaging for evaluation of myocardial ischemia. Am. J. Cardiol. 99, 450–456 (2007).
- Meijboom WB, Meijs MF, Schuijf JD et al.: Diagnostic accuracy of 64-slice computed tomography coronary angiography: a prospective, multicenter, multivendor study. J. Am. Coll. Cardiol. 52, 2135–2144 (2008).
- van Werkhoven JM, Schuijf JD, Jukema JW et al.: Comparison of non-invasive multi-slice computed tomography coronary angiography versus invasive coronary angiography and fractional flow reserve for the evaluation of men with known coronary artery disease. Am. J. Cardiol. 104, 653–656 (2009).
- Kristensen TS, Engstrom T, Kelbaek H, von der Recke P, Nielsen MB, Kofoed KF: Correlation between coronary computed tomographic angiography and fractional flow reserve. Int. J. Cardiol. 144, 200–205 (2010).
- Hoffmann U, Bamberg F, Chae CU et al.: Coronary computed tomography angiography for early triage of patients with acute chest pain: the ROMICAT (Rule Out Myocardial Infarction using Computer Assisted Tomography) trial. J. Am. Coll. Cardiol. 53, 1642–1650 (2009).
- Pijls NH, De Bruyne B, Peels K et al.: Measurement of fractional flow reserve to assess the functional severity of coronaryartery stenoses. N. Engl. J. Med. 334, 1703–1708 (1996).
- Blankstein R, Shturman LD, Rogers IS et al.: Adenosine-induced stress myocardial perfusion imaging using dual-source cardiac computed tomography. J. Am. Coll. Cardiol. 54, 1072–1084 (2009).
- Ko SM, Choi JW, Song MG et al.: Myocardial perfusion imaging using adenosine-induced stress dual-energy computed tomography of the heart: comparison with cardiac magnetic resonance imaging and conventional coronary angiography. Eur. Radiol. 21, 26–35 (2011).
- Ho KT, Chua KC, Klotz E, Panknin C: Stress and rest dynamic myocardial perfusion imaging by evaluation of complete time– attenuation curves with dual-source CT. JACC Cardiovasc. Imaging 3, 811–820 (2010).
- Rispler S, Keidar Z, Ghersin E et al.: Integrated single-photon emission computed tomography and computed tomography coronary angiography for the assessment of hemodynamically significant coronary artery lesions. J. Am. Coll. Cardiol. 49, 1059–1067 (2007).
- Rocha-Filho JA, Blankstein R, Shturman LD et al.: Incremental value of adenosineinduced stress myocardial perfusion imaging with dual-source CT at cardiac CT angiography. Radiology 254, 410–419 (2010).
- George RT, Arbab-Zadeh A, Miller JM et al.: Adenosine stress 64- and 256-row detector computed tomography angiography and perfusion imaging: a pilot study evaluating the transmural extent of perfusion abnormalities to predict atherosclerosis causing myocardial ischemia. Circ. Cardiovasc. Imaging 2, 174–182 (2009).
- Cury RC, Magalhaes TA, Borges AC et al.: Dipyridamole stress and rest myocardial perfusion by 64-detector row computed tomography in patients with suspected coronary artery disease. Am. J. Cardiol. 106, 310–315 (2010).
- Lautamaki R, George RT, Kitagawa K et al.: Rubidium-82 PET-CT for quantitative assessment of myocardial blood flow: validation in a canine model of coronary artery stenosis. Eur. J. Nucl. Med. Mol. Imaging 36, 576–586 (2009).
- Scheffel H, Alkadhi H, Leschka S et al.: Low-dose CT coronary angiography in the step-and-shoot mode: diagnostic performance. Heart 94, 1132–1137 (2008).
- Singh S, Kalra MK, Hsieh J et al.: Abdominal CT: comparison of adaptive statistical iterative and filtered back projection reconstruction techniques. Radiology 257, 373–383 (2010).
- Leipsic J, LaBounty TM, Heilbron B et al.: Estimated radiation dose reduction using adaptive statistical iterative reconstruction in coronary CT angiography: the ERASIR study. AJR Am. J. Roentgenol. 195, 655–660 (2010).
- Shikhaliev PM: The upper limits of the SNR in radiography and CT with polyenergetic x-rays. Phys. Med. Biol. 55, 5317–5339 (2010).
- Taylor AM: Cardiac imaging: MR or CT? Which to use when. Pediatr. Radiol. 38 (Suppl. 3), S433–S438 (2008).
- Marek J, Skovranek J, Hucin B et al.: Seven-year experience of noninvasive preoperative diagnostics in children with congenital heart defects: comprehensive analysis of 2,788 consecutive patients. Cardiology 86, 488–495 (1995).
- Tworetzky W, McElhinney DB, Brook MM, Reddy VM, Hanley FL, Silverman NH: Echocardiographic diagnosis alone for the complete repair of major congenital heart defects. J. Am. Coll. Cardiol. 33, 228–233 (1999).
- Gutgesell HP, Huhta JC, Latson LA, Huffines D, McNamara DG: Accuracy of two-dimensional echocardiography in the diagnosis of congenital heart disease. Am. J. Cardiol. 55, 514–518 (1985).


