Review Article - Imaging in Medicine (2011) Volume 3, Issue 3
Recent developments in intracoronary optical coherence tomography imaging
Hironori Kitabata1 and Takashi Akasaka†1
1Department of Cardiovascular Medicine, Wakayama Medical University, 811–1 Kimiidera, Wakayama, Japan
- *Corresponding Author:
- Takashi Akasaka
Department of Cardiovascular Medicine
Wakayama Medical University, 811–1 Kimiidera
Wakayama, Japan
Tel.: +81 734 472 300
Fax: +81 734 460 631
E-mail: akasat@wakayama-med.ac.jp
Abstract
Optical coherence tomography (OCT) has developed as an intracoronary imaging modality for the assessment of coronary artery disease. The high resolution (10–20 μm) of OCT has the ability to provide detailed microstructural information about coronary plaques in vivo, as well as the histological examination. Various in vitro and in vivo OCT studies have demonstrated a potential of OCT for identifying the features of vulnerable plaque. Furthermore, OCT can clearly identify stent failure following stent implantation. OCT can also reliably distinguish thin neointimal hyperplasia on stent struts better than intravascular ultrasound. Recently, the next-generation OCT system, named Fourier-domain OCT imaging, has been demonstrated to be a powerful enabling technology, with improvements in interrupted blood flow, higher penetration depth and faster image acquisition rates compared with the current OCT systems. This article describes the recent developments of intracoronary OCT imaging, and discusses the limitations and future perspectives in coronary OCT imaging.
Keywords
coronary artery disease; intracoronary imaging; optical coherence tomography; plaque stabilization; stent; vulnerable plaque
Optical coherence tomography (OCT) is a new, light-based intravascular imaging modality. Compared with other coronary imaging modalities, the greatest advantages of OCT are its high resolution of up to 10–20 μm, which is approximately ten-times higher than that of intravascular ultrasound (IVUS), and its accuracy of tissue characterization [1–5]. In addition, OCT can precisely identify incomplete stent apposition, tissue protrusion, edge dissection and neointimal hyperplasia following stent implantation, compared with IVUS [6–8]. The excellent resolution of OCT may provide new insights into the pathophysiology and treatment of coronary artery disease, including acute coronary syndrom e (ACS), and the vascular healing responses after percutaneous coronary intervention (PCI). This article reviews the current and future developments of OCT in coronary artery disease and also focuses on the clinical applications of OCT.
Current OCT system & technical requirements for OCT image acquisition
The current time-domain OCT (TD-OCT) system has emerged for intravascular imaging: the M2 and M3 OCT system (LightLab Imaging, MA, USA). Both systems employ a dedicated fiber-optic imaging wire (ImageWire™, LightLab Imaging) connected to a patient interface unit which, in turn, connects to the system console. The system console contains the optical engine and the computer. The optical engine consists of a light source, beam splitter, reference arm, detectors and signal processor. The maximal outer diameter of the OCT imaging wire, with a standard 0.014-inch radiopaque coiled tip, is 0.019 inches. The central wavelength used in the current intravascular OCT systems is 1310 nm, which minimizes absorption of the light waves by water, protein, lipids and hemoglobin, without tissue damage. Light is reflected by a tissue and by a moving mirror towards a detector. Information from the echo time delay is measured by a coherence interferometer, and the intensity of backscattering of light from the tissue is used to create the image. The maximum penetration depth of the current OCT system is 1.0–2.0 mm, depending on tissue type, with axial and lateral resolutions of 10 and 20 μm, respectively. The personal computer-based operating system permits high-resolution OCT imaging at a higher frame rate (20 f/s for M3; 15.6 f/s for M2) with a faster maximal pullback speed of 2.0–3.0 mm/s.
The OCT image wire is not torquable and is difficult to manipulate. For the TD-OCT procedure, a 3F over-the-wire occlusion balloon catheter (Helios® [Goodman Co. Ltd, Nagoya, Japan]) is inserted over a conventional angioplasty guidewire (0.014 inches) to the distal of the target lesion. The guidewire is then replaced by the OCT image wire. As near-infrared light penetrates only a short distance through blood, temporary blood clearance is required for OCT imaging. To remove blood from the imaging field, an occlusion balloon is inflated to 0.5–0.7 atm at the proximal site to the target lesion, while simultaneously flushing physiological saline or Ringer’s lactate solution from the distal tip of the occlusion balloon catheter at a rate of 0.5–1.0 ml/s.
A multicenter study reported on the safety and feasibility of intracoronary imaging with the occlusive OCT image acquisition technique in 76 patients with coronary artery disease [9]. Procedural success rate was 97%, and no procedure- related complications, including ventricular tachycardia or ventricular fibrillation, vessel dissection, thrombus formation or vasospasm, were found. Recently, a nonocclusive technique for OCT image acquisition has been developed as an alternative to the conventional balloonocclusion technique [10–12]. This nonocclusive technique, based on infusion of contrast media, or a mixture of commercially available dextran 40 and Ringer’s lactate solution (Low Molecular Dextran L Injection® [Otsuka Pharmaceutical Factory, Tokushima, Japan]) through the guiding catheter reduces the procedural time, and is superior for observing proximal lesions compared with the balloon-occlusion technique [10]. Barlis et al. reported a large OCT registry data of 468 patients from six European medical centers [13]. The OCT image acquisition was performed using the occlusive technique in 55% of patients, while the nonocclusive technique was used in the remaining 45%. Transient chest pain and QRS widening/ST-depression/elevation were observed in 47.6 and 45.5%, respectively. Major complications during OCT imaging included ventricular fibrillation (1.1%) owing to balloon occlusion and/or deep guide-catheter insertion, air embolism (0.6%) and vessel dissection (0.2%). There were no cases of coronary spasm or major adverse cardiovascular events within the 24‑h period after OCT examination. These results with both occlusive and nonocclusive OCT image acquisition demonstrate the technique to be safe. Major complications during the OCT procedure are very rare, and can be minimized with careful procedural planning and ECG monitoring.
Comparison of OCT with other imaging modalities
Noninvasive imaging modalities, such as MRI and CT, are currently under intense investigation; OCT may be directly compared with these imaging techniques. The imaging depth of OCT is typically limited to a few millimeters, which is less than in MRI and CT, but its resolution (10–20 μm) is greater than those of CT (300 μm) and MRI (1 mm). The acquisition time of OCT is short enough to support tomographic imaging at video rates, making it much more tolerant to subject motion than either CT or MRI. Catheter-based imaging by OCT with a high resolution would provide more detailed structural information than noninvasive methods.
Plaque characterization
Optical coherence tomography can clearly differentiate all of the three layers of the coronary artery wall, demonstrating the intima as the signal-rich layer, the media as the signal-poor middle layer and the adventitia as the signalrich layer surrounding the signal-poor layer of the media (Figure 1A); there is a good correlation between OCT image and histological examination [14]. Hence, it has been reported that intracoronary OCT is useful for the diagnosis of spontaneous coronary artery dissection [15,16]. Furthermore, OCT may allow us to identify tissue characterization of coronary plaques much more easily and more clearly compared with other imaging modalities [1,4,5,17,18] with very good intra- and inter-observer reliabilities (k = 0.83–0.84), and excellent sensitivity and specificity in each plaque. In previous histological- controlled studies, OCT demonstrated a sensitivity of 71–79% and a specificity of 97–98% for fibrous plaques, 95–96% and 97% for fibrocalcific plaques, and 90–94% and 90–92% for lipid-rich plaques, respectively [17,18]. OCT demonstrates fibrous plaques (Figure 1B) as signalrich homogenous lesions, fibrocalcific plaques (Figure 1C) as signal-poor sharp-border lesions and lipid-rich plaques (Figure 1D) as signal-poor diffuse-border lesions [17]. Moreover, in terms of the identification of thrombus, which is difficult to distinguish by IVUS, OCT can differentiate between red and white thrombi with a high sensitivity (90%) and specificity (88%) [19], probably similar to those of coronary angioscopy [20]. Kume et al. reported that red thrombi (red blood cell rich) were demonstrated as a highbackscattering protrusion mass with signal-free shadowing inside the vessel lumen (Figure 1E), and white thrombi (platelet rich) were revealed as low-backscattering projections (Figure 1F) [19].

Figure 1. Optical coherence tomography images of normal coronary vessel wall, coronary atherosclerotic plaques and thrombi. (A) Normal coronary vessel wall. Intima: signal-rich layer nearest the lumen; media: signal-poor layer in middle of vessel wall; adventitia: signal-rich outer layer of vessel wall. (B) Fibrous plaque: signal-rich homogeneous region. (C) Fibrocalcific plaque: signalpoor heterogeneous region with sharp border. (D) Lipidic plaque: signal-poor homogeneous region with poorly delineated border. (E) Red thrombus: signal-rich mass protruding into the lumen with signal-free shadow. (F) White thrombus: signal-rich low-backscattering protrusions inside the lumen.
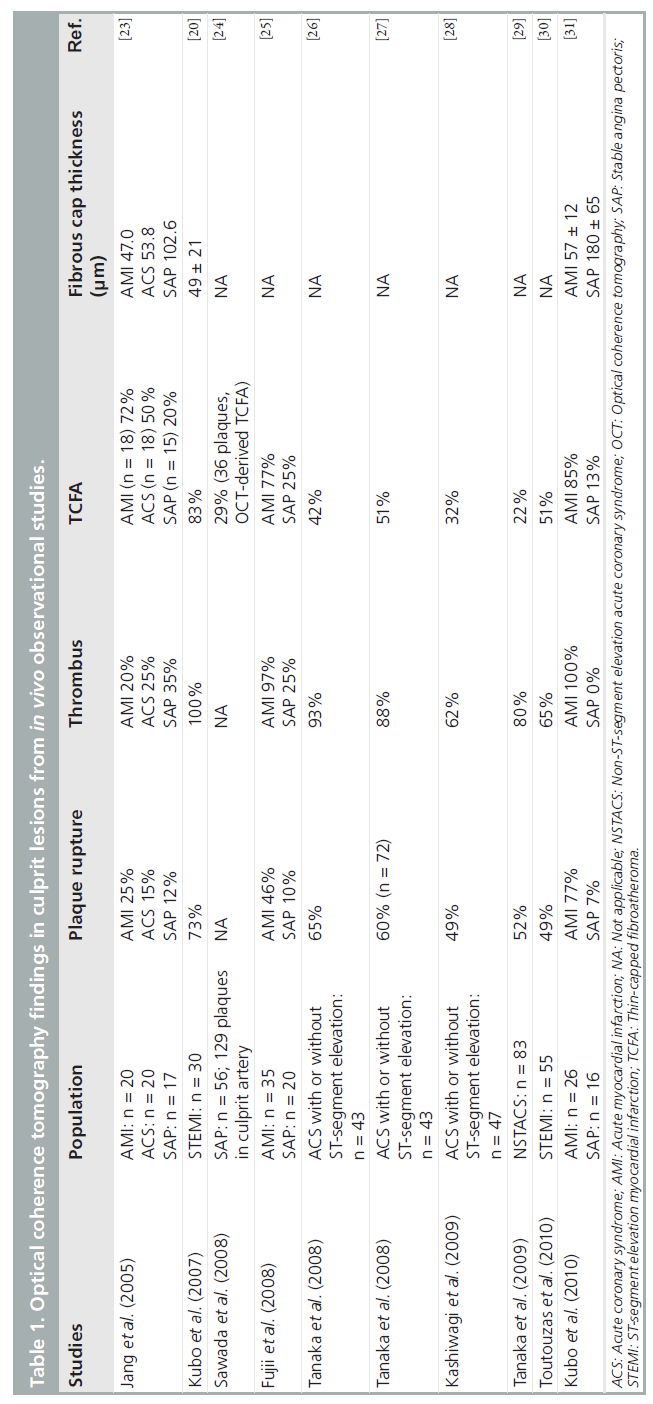
Vulnerable plaque detection
Rupture of vulnerable plaques is the main cause of ACS. For all cardiologists, the detection of vulnerable plaques is one of the major clinical concerns. Vulnerable plaques are characterized as a thin fibrous cap, large lipid core and an accumulation of macrophages within the cap, each of which can be identified by OCT [17,21,22]. OCT findings in culprit lesions from various in vivo observational studies are summarized in Table 1 [20,23–31]. Jang et al. reported culprit lesion morphology in coronary artery disease using a 3.2-Fr prototype OCT catheter in 2005, and a much more thin-capped fibroatheroma (TCFA; fibrous cap thickness <65 μm), which is a type of vulnerable plaque, has been demonstrated in addition to a tendency of frequent presence of plaque disruption, thrombus and lipid-rich plaque with a significantly thinner fibrous cap thickness in ACS compared with stable angina pectoris (SAP) [23]. However, in this study, the frequency of thrombus and plaque rupture in acute myocardial infarction (AMI) was thought to be very low compared with previous pathological reports [32,33]; the size of the OCT catheter, the timing of the OCT procedure (4.6 ± 5.3 days after the onset of AMI) and the use of thrombolysis and/or IIb/IIIa inhibitor administration might have affected the results. Recently, Kubo et al. used three methods (OCT, IVUS and angioscopy) in 30 patients with AMI to detect the specific characteristics of vulnerable plaque in the culprit site [20]. OCT was superior in detecting plaque rupture (73 vs 40 vs 43%; p = 0.021), erosion (23 vs 0 vs 3%; p = 0.003) and thrombus (100 vs 33 vs 100%; p < 0.001), as compared with IVUS and angioscopy. Frequency of TCFA in AMI culprit lesions in these studies was 72 and 83%, respectively, and the thickness of the fibrous cap in the former and latter studies was 47 μm and 49 ± 21 μm, respectively [20,23]. Sawada et al. compared the feasibility for detecting TCFA between OCT and virtual histology IVUS (VH-IVUS) [24]. Of the 126 coronary plaques examined, 61 plaques were diagnosed as VH-IVUS-derived TCFA and 36 plaques as OCT-derived TCFA. In the combined analysis of both methods, 28 plaques were diagnosed as definite TCFA. Thus, the accuracy of OCT for detecting definite- TCFA was 78%, although that of VH-IVUS was 46%. Fujii et al. performed a three-vessel OCT study to evaluate the incidence and predictors of TCFAs in patients with AMI and SAP [25]. TCFAs were more frequent at the culprit site than at remote sites in AMI patients, and multiple TCFAs were found to be more likely in AMI patients than in SAP patients (69 vs 10%; p < 0.001). In the multivariate analysis, AMI was the only independent predictor for the presence of TCFA. Furthermore, more recently, Fujii et al. reported that TCFAs and ruptured plaques were common in the proximal segments of the left anterior descending artery [34], as described previously [35]. These results are in agreement with other in vivo OCT studies [26,31]. Thus, OCT would be a useful tool to identify TCFAs in vivo.
The ultimate goal of in vivo OCT imaging is to detect vulnerable plaques before they rupture. However, the frequency of vulnerable plaques actually leading to ACS is very low and most ruptured plaques will remain clinically silent. Therefore, prospective OCT studies with a large number of patients are needed to clarify whether vulnerable plaques detected by OCT link to future acute coronary events in natural history studies.
More interestingly, it has recently been reported that the fibrous cap thickness and the site of rupture are different with different types of ACS onset [27]. As a result, the thickness of broken fibrous cap was thinner (50 vs 90 μm; p = 0.0017) in rest-onset ACS compared with exertion-triggered ACS, and the rupture at plaque shoulder was more frequent in the latter (57 vs 93%; p = 0.017). Furthermore, not only TCFA, but also thick-cap fibroatheroma (ThCFA; up to 150 μm) may potentially rupture, and highly sensitive C-reactive protein level negatively correlated well with the thickness of the ruptured fibrous cap (r = -0.31; p < 0.01). These findings suggest that fibrous cap rupture could occur at the site of plaque shoulder, even in ThCFA up to 150 μm during exertion. Exercise-induced high shear stress at the site of the plaque shoulder might be speculated to be a cause of fibrous cap disruption, although the demonstration of inflammation by commercially available OCT systems has not been established yet. However, it has already been demonstrated that OCT has a potential to assess the infiltration of macrophages within fibrous caps as a marker of inflammation [22,36,37].
More recently, Mizukoshi et al. reported that the frequency of plaque rupture (43 vs 13 vs 71%; p < 0.001) and plaque ulceration (32 vs 7 vs 8%; p = 0.003) was significantly different among the types of unstable angina pectoris in Braunwald class I, II and III [38], and the fibrous cap thickness (140 vs 150 vs 60 μm; p < 0.001), minimal lumen area (0.70 vs 1.80 vs 2.31 mm2; p < 0.001) and the frequency of thrombus (72 vs 30 vs 73%; p < 0.001) were also significantly different among the types of unstable angina pectoris, although the frequency of lipid-rich plaque was comparable among each group (85 vs 80 vs 87%; p = 0.73). Thus, OCT may allow us to realize the pathophysiology of ACS in detail in living humans.
The thickness of the fibrous cap in coronary plaques is an important determinant of plaque vulnerability [39]. Using OCT, which can precisely measure the thickness of fibrous cap in vivo [21], Takarada et al. demonstrated that lipid-lowering therapy by statins may have potential to significantly increase the fibrous cap thickness and stabilize vulnerable plaques through anti-inf lammatory actions [40,41]. As therapies to stabilize vulnerable plaques are developed, OCT will help to monitor the response to such anti-atherosclerotic therapies in the clinical setting.
Current efforts with OCT focus on the identification of makers of plaque vulnerability to improve patient risk stratification. Increased neovascularization in atherosclerotic plaques plays a key role in plaque progression, plaque instability and rupture of plaque [42]. The excellent resolution of OCT may offer an opportunity to assess the spatial distribution of plaque neovascularization in vivo. Actually, microvascular structures demonstrating vasa vasorum neovascularization are identified frequently around the vulnerable plaques by OCT [43]. Vorpahl et al. reported that microvascular structures (small black holes) in OCT imaging matched intravascular neoangiogenesis formation in histology [44]. Microvascular structures detected by OCT may help to identify the vulnerability, not only of culprit plaques, but also of nonculprit plaques (Figure 2). Furthermore, plaque neovascularization can become a therapeutic target for plaque stabilization, which is as important as the thickness of the fibrous cap [45,46].

Figure 2. Plaque neovascularization. Microchannel structures demonstrating that plaque neovascularization is located as small black holes (arrow) in the outer plaque (A) near the adventitia and (B) in the thickened intima. A microchannel (black hole) is defined as a no-signal tubuloluminal structure without a connection to the vessel lumen recognized on at least three consecutive frames in optical coherence tomography pullback images [43].
However, outcome data showing that the assessment of plaque vulnerability by OCT would make a clinical impact or affect mortality are lacking. Therefore, long-term large-scale studies are needed to clarify whether vulnerable plaques (especially TCFA) detected by OCT lead to future clinical cardiac events.
Assessment of vascular healing after drug-eluting stent implantation by OCT
Although drug-eluting stents (DESs) have dramatically reduced restenosis and target-lesion revascularization, long-term safety remains a clinical major concern owing to persistent increase in the incidence of very-late stent thrombosis (VLST). While stent thrombosis is a multifactorial process, at least one previous pathologic study has shown that the extent of the stent coverage (the ratio of uncovered struts to total struts) is the powerful predictor of late stent thrombosis [47]. OCT, with its excellent resolution, can reliably distinguish thin neointimal hyperplasia on stent struts and uncovered struts better than IVUS (Figure 3) [48,49]. It has also been reported that OCT imaging can accurately assess the extent and thickness of neointimal coverage on stent struts after stent implantation with good histological correlation [48,50,51]. Xie et al. performed a prospective OCT study at 3 months after sirolimus-eluting stent (SES) implantation [52]. In this study, a total of 5076 struts of SESs were evaluated, and the mean neointimal hyperplasia thickness was 31 ± 39 μm. The frequency of uncovered struts was 15% (741 struts) and the frequency of struts with neointimal coverage less than 100 μm, which is undetectable by IVUS, was 94%. Similarly, Matsumoto et al. investigated 34 patients who underwent OCT examination at 6-month follow-up after SES implantation [8]. The median neointima thickness was 52.5 μm. In total, 89% of SESs were covered by thin neointimal hyperplasia, and 64% of neointima covering the stent struts were less than 100 μm in thickness. Only nine SESs (16%) showed full coverage by neointimal hyperplasia at 6 months, whereas the remaining stents had partially uncovered struts.

Figure 3. Intravascular ultrasound and optical coherence tomography images 6 months after sirolimus-eluting stent implantation. (A) Optical coherence tomography images clearly demonstrate neointimal tissue on stent struts at the 11-o’clock position. (B) The thickness of these neointimal tissues is very thin (measuring 20 µm), not seen by intravascular ultrasound due to its limited resolution.
Zhu-hua et al. evaluated the time course of neointimal coverage in SESs with OCT 6 months and 12 months after implantation [53]. The frequency of uncovered struts decreased from 9.2 to 6.6%. Katoh et al. also reported a comparison of OCT findings in identical SESs at 6 and 12 months [54]. As a result, the frequency of struts without neointimal coverage (10.4–5.7%) was similar to the results of Zhu-hua’s study. Longerterm follow-up (up to 2 years) OCT examination has demonstrated that, although the percentage of uncovered struts decreased from 15 to 5% at 2 years, the prevalence of patients with any uncovered struts did not differ between the 3‑month group and the 2‑year group (95 vs 81%; p = 0.15) [55]. Furthermore, Takano et al. performed serial OCT observations at 2 and 4 years in 17 patients treated with 21 SESs [56]. The frequency of patients with uncovered struts significantly decreased from 88 to 29% (p = 0.002). These studies suggest that long-term delayed neointimalization exists with SESs. However, at the present time, exactly when a SES is fully covered by neointima remains unclear.
The pattern of vascular healing after implantation may be somewhat different according to the types of DESs and the overlap or nonoverlap segments [57]. OCT For DES Safety (ODESSA) reported the frequency of uncovered/ malapposed struts at 6 months in overlap segments (SES: 6.7 ± 9.6%; paclitaxel-eluting stent [PES]: 6.7 ± 16.5%; zotarolimus-eluting stent [ZES]: 0.10 ± 0.37%) and in nonoverlap segments (SES: 8.9 ± 12.0%; PES: 2.7 ± 4.5%; ZES: 0.02 ± 0.11%) [58].
Uncovered stent struts might be thrombogenic, and mural thrombus might be one of the risk factors for stent thrombosis. Otake et al. reported that the frequency of mural thrombus, which was detected by OCT, was 26% (14 out of 53 lesions) in SES patients at 6 months and subclinical thrombus was associated with a larger number of uncovered struts, uneven neointimal thickness, greater asymmetric stent expansion and longer SES [59]. However, in this small study, the presence of mural thrombus did not lead to clinical stent thrombosis during the follow-up period (median: 485 days). Kim et al. also reported large-scale OCT registry data of 226 patients with various DES [60]. Intracoronary thrombus was detected in 27 SES cases (28%), seven PES (11%) and one ZES (1%) case. Although the presence of intracoronary thrombus was associated with longer stent length (≥28mm), smaller stent diameter (<3.0 mm) and more uncovered struts (at least eight uncovered struts in each stent), major adverse cardiovascular events, including stent thrombosis, were not observed in patients with intracornary thrombus during long-term follow-up after OCT (mean: 8 months; range: 1–15 months). These studies demonstrate that there is a relationship between uncovered stent struts and intracoronary thrombus formation. However, to provide a clear conclusion about the clinical implications of intracoronary thrombus detected by OCT, randomized studies with long-term clinical follow-up and a larger population would be needed.
In the DES era, incomplete stent apposition (ISA) is also one of the major concerns, owing to one recent report showing its possible association with VLST after DES implantation [61]. While there is no significant difference in the prevalence of acute ISA between bare-metal stent (BMS) and DES patients, late-acquired ISA is more frequently observed after DES (10–20%) than BMS (5–10%) implantation. The mechanism of late-acquired ISA is widely accepted to typically be the result of either positive arterial remodeling and/or thrombus dissolution behind the stent struts (especially in myocardial infarction). The clinical association of late-acquired ISA and stent thrombosis remains controversial. More recently, Ozaki et al. assessed the fate of ISA after deployment of SESs [62]. The frequency of incompletely apposed struts post-intervention was 7.2% (309 struts). Of 309 struts, 202 (65%) struts failed to heal (persistent ISA without neointimal coverage) even at 10-month follow-up. Mural thrombus was observed more frequently in struts with ISA (20.6%) compared with struts with a good apposition (only 2.0%). Takano et al. reported that extra-stent lumens, representing ISA, expanded from 2 to 4 years (0.28 ± 0.27 vs 0.62 ± 0.68 mm2; p < 0.01) (Figure 4), and the incidence of subclinical thrombus did not decrease (24% at 2 years vs 29% at 4 years; p = 1.0) [56]. All thrombi were also detected in patients who had cross-sections with extra-stent lumens. The authors concluded that careful and further extended follow-up studies will be required for the patients with SESs.

Figure 4. Serial change of late-acquired incomplete stent apposition after sirolimus-eluting stent implantation. (A) Coronary angiogram 9 months after sirolimus-eluting stent implantation shows peristrut contrast staining (arrow) in the mid-left anterior descending artery. (B) Coronary angiogram, 3 years later, reveals the expansion of peristrut contrast staining (arrow). (C & D) In the optical coherence tomography examinations, the extra-stent lumen area significantly increased, from 1.48 to 2.36 mm2 at 9 months and 3 years, although the stent area did not change. Intracoronary thrombus was not identified by optical coherence tomography. This patient continued a dual antiplatelet therapy after the initial coronary intervention.
The optimal duration of dual antiplatelet therapy for DESs has not been completely established. By clearly visualizing neointimal stent coverage, intracoronary thrombus and ISA, OCT will provide important information about chronic DES status to determine the timing of the discontinuation of dual antiplatelet therapy.
Assessment of vascular healing after BMS implantation by OCT
Although it is generally recognized that the long-term clinical outcome of BMS implantation is favorable, the late luminal narrowing with restenosis of BMS can occur during extended follow-up (beyond 4 years), resulting in clinical events, such as stent thrombosis and myocardial infarction [63]. Regarding the mechanisms of progressive late luminal narrowing, Inoue et al. have reported that stainless steel stents evoke a remarkable foreign body inflammatory reaction to the metal, and persistent peri-strut chronic inflammatory cells may accelerate new atherosclerotic changes and consequent plaque vulnerability of the neointimal tissue around the stent struts [64]. Indeed, Hasegawa et al., using atherectomy specimens in living human beings, reported that new atherosclerotic progression occurred inside BMSs [65]. OCT study also demonstrated that neointima within BMSs more than 5 years after implantation was characterized by marked signal attenuation and a diffuse border, suggesting lipid-laden intima [66]. Furthermore, rupture of TCFA inside a BMS may be a cause of VLST after BMS implantation (Figure 5) [67,68]. These findings suggest that the underlying mechanism of VLST might be different between BMSs and DESs [69].
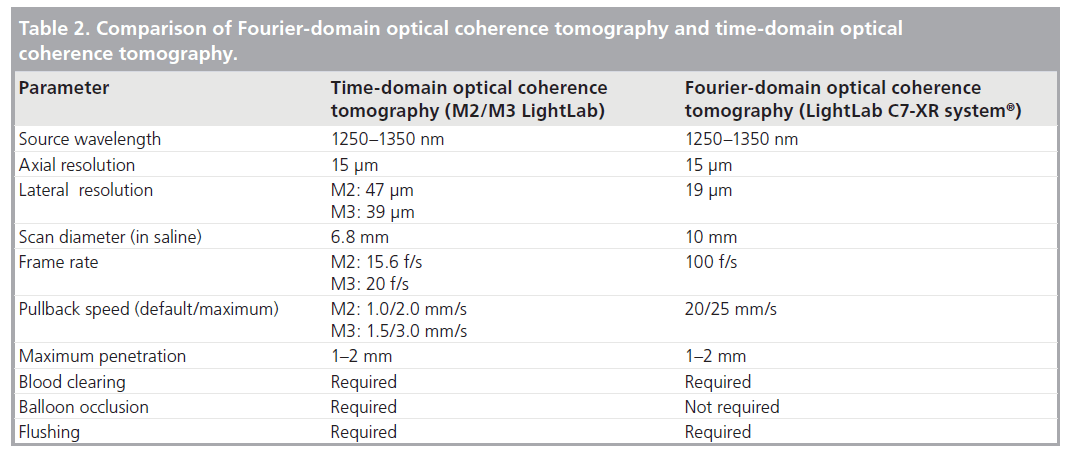

Figure 5. Very-late stent thrombosis after bare-metal stent implantation. A 68-year-old man was admitted to our hospital because of non-ST-segment elevation myocardial infarction. He had a history of stenting owing to inferior ST-segment elevation myocardial infarction in the mid-portion of the right coronary artery with a bare-metal stent (3.0 × 30 mm) 7 years ago. (A) An emergent coronary angiogram showed severe in-stent stenosis in the previously stented segment. (B & C) Optical coherence tomography examination revealed plaque rupture (white arrowheads) and intracornary thrombus (*) within the bare-metal stent. The thickness of broken fibrous cap was 20 µm. (D) Lipid-rich plaque (red arrows) covered by thin fibrous cap (60 µm) was imaged and determined as a thin-capped fibroatheroma. At this region, stent struts are invisible because of signal attenuation suggesting lipid component. Arrowheads represent stent struts. Reproduced with permission from [67].
Guidance for coronary intervention
Optical coherence tomography provides more detailed morphological information for monitoring stent deployment than conventional intracoronary imaging modalities. Kubo et al. demonstrated that OCT has a potential to detect stent-edge dissection (40 vs 16%; p = 0.005), tissue protrusion (58 vs 20%: p < 0.001) and stent malapposition (47 vs 8%: p < 0.001), compared with IVUS [7]. Several studies also reported similar advantages of OCT in complex interventions, such as bifurcation lesions and chronic total occlusions [6,70,71]. However, future prospective studies are needed to address the consequences of these OCT findings on the outcome after PCI. Recently, Tanaka et al. investigated whether OCT could predict the no-reflow phenomenon after PCI in 83 patients with non-ST-segment elevation ACS [29]. TCFA was more frequently observed in the no-reflow group than in the reflow group (50 vs 16%; p = 0.005). The size of the lipid arc estimated by OCT in the culprit plaque was significantly greater in the no-reflow group than in the good-reflow group (166 ± 60° vs 44 ± 63°; p < 0.001). Final myocardial blush grade also deteriorated according to the increase in the lipid arc (especially >180°). A multivariable logistic regression model revealed that lipid arc alone was an independent predictor of the angiographic no-reflow phenomenon (odds ratio: 1.018; 95% CI: 1.004–1.033; p < 0.01). Gonzalo also reported that plaque type
at the stent edges, especially lipid-rich plaque, has an impact on the presence of edge dissections [72]. Thus, OCT is a useful tool for risk stratification of PCI. Therefore, the treatment strategy can be decided individually on the basis of OCT findings during PCI.
Limitations
The current OCT system has several considerable limitations for its clinical application. First, at the time of image acquisition, OCT requires vessel occlusion by means of gentle balloon inflation and vessel flushing for a blood-free imaging zone, because the nearinfrared light signals are attenuated by red blood cells. Therefore, the evaluation of left main trunk or ostial coronary lesions may be limited. To improve this limitation, a simplified nonocclusive technique for coronary blood removal has recently been developed [10,11]. Second, the time constraint imposed by blood flow interruption, as well as slow frame rate of the current OCT system, prevents scanning of a significant length of a coronary artery during a single flush. Third, the rate of flush may have an influence on measuring the vessel lumen diameter and area [9]. Finally, OCT has a relatively shallow axial penetration depth of 2 mm. The OCT signal does not reach the back wall of thick atherosclerotic lesions. The penetration depth of OCT depends on tissue characteristics of coronary plaques. OCT is not appropriate for the visualization of whole vessel and the evaluation of arterial remodeling and coronary aneurysm. The current OCT is particularly suitable for the assessment of the plaque morphologies within 500 μm of the lumen surface.
Future perspective
A second-generation OCT technology, named Fourier-domain OCT (FD-OCT), has recently been developed to overcome many of the technical limitations of the current TD-OCT system by imaging at much higher frame rates (100 frame/s), a wider scan diameter (10 mm) and a faster image acquisition rate (20 mm/s) without loss of image quality, and this technology does not require proximal balloon occlusion (Tab le 2) [73]. The imaging catheter of FD-OCT, which is designed for rapid exchange delivery, has a 2.7-Fr crossing profile and can be delivered over a 0.014-inch guidewire through a 6-Fr, or larger, guide catheter. Injecting saline, angiographic contrast media or a mixture of contrast and saline, through the guide catheter (4–6 ml/s; 2–3 s) can achieve effective clearing of blood for the FD-OCT imaging. In combination with a short, nonocclusive flush and a faster pullback speed, the FD-OCT enables imaging of longer segments of coronary arteries without significant ischemia and motion artifact [74]. Therefore, computed-assisted quantitative analysis of FD-OCT with excellent reproducibility for consecutive pullbacks may be a valuable tool for PCI in the near future (Figure 6) [75,76]. In addition, the FD-OCT facilitates the acquisition of spectroscopic and polarization data for tissue characterization, and identification of vulnerable plaque and more precise and easier assessment of not only culprit, but also nonculprit lesion morphologies in coronary artery disease could be expected in daily clinical practice (Figure 7).

Figure 6. Fourier-domain optical coherence tomography quantitative measurements pre-intervention. A longitudinal reconstruction (lower panel) and cross-sectional images (upper panel) acquired with a Fourier-domain optical coherence tomography (FD-OCT) system at 20 mm/s before intervention. (A) Distal reference site demonstrating all of the three layers of coronary vessel wall, with corresponding longitudinal view. (B) Minimum lumen area, with corresponding longitudinal view. (C) Proximal reference site demonstrating all of the three layers of coronary vessel wall, with corresponding longitudinal view. In the FD-OCT image without significant motion artifact, not only stent size but also stent length can be determined. * Represents guidewire artifact.

Figure 7. Plaque vulnerability in the culprit and nonculprit lesions. A longitudinal reconstruction (upper panel) and cross-sectional images (lower panel) acquired with a Fourierdomain optical coherence tomography (FD-OCT) system at 20 mm/s after manual thrombectomy in a patient with inferior acute myocardial infarction. (A) Small white thrombus (arrows), with corresponding longitudinal view. (B) Plaque rupture (arrow), with corresponding longitudinal view. (C) Lipid-rich plaque covered by 60-µm thin fibrous cap (thin-capped fibroatheroma), with corresponding longitudinal view. (D) Intimal thickening with neovascularization (arrows), with corresponding longitudinal view. FD-OCT can identify the vulnerability of not only culprit but also nonculprit lesions safely and easily even in acute coronary syndrome. * Represents guidewire artifact. TCFA: Thin-capped fibroatheroma.
Conclusion
The high-resolution imaging of OCT provides histology-grade definition of the morphology of coronary plaques in coronary artery disease in vivo. At the culprit site in ACS, TCFA disruption with thrombus formation is generally observed by OCT as reported previously by histology. Nonruptured TCFA and clinically silent ruptured TCFA can also be demonstrated, not only in culprit, but also in nonculprit vessels by OCT, even in SAP. Thus, OCT allows a greater understanding of the pathophysiology of coronary artery disease in vivo, and may have a potential to offer guidance on the appropriate patient-specific therapeutic approach. Furthermore, OCT provides substantial information regarding the mechanism of stent thrombosis, which may be different between BMS and DES patients. Although more clinical trials with larger numbers of subjects, a standardized definition of tissue characterization and stent evaluation, and future improvement of the imaging technology are required for routine clinical use of OCT, OCT will play a key role in the future of cardiology in coronary artery disease.
Financial & competing interests disclosure
The authors have no relevant affiliations or financial involvement with any organization or entity with a financial interest in or financial conflict with the subject matter or materials discussed in the manuscript. This includes employment, consultancies, honoraria, stock ownership or options, expert testimony, grants or patents received or pending, or royalties.
No writing assistance was utilized in the production of this manuscript.
Papers of special note have been highlighted as:
* of interest
* of considerable interest
References
- Jang IK, Bouma BE, Kang DH et al.: Visualization of coronary atherosclerotic plaques in patients using optical coherence tomography: comparison with intravascular ultrasound. J. Am. Coll. Cardiol. 39(4), 604–609 (2002).
- Tearney GJ, Jang IK, Bouma BE: Optical coherence tomography for imaging the vulnerable plaque. J. Biomed. Opt. 11, 021002 (2006).
- Pinto TL, Waksman R: Clinical application of optical coherence tomography. J. Interv. Cardiol. 19(6), 566–573 (2006).
- Low AF, Teaney GJ, Bouma BE, Jang IK: Technology insight: optical coherence tomography-current status and future development. Nat. Clin. Pract. Cardiovasc. Med. 3(3), 154–162 (2006).
- Kawasaki M, Bouma BE, Bressner J et al.: Diagnostic accuracy of optical coherence tomography and integrated backscatter intravascular ultrasound images for tissue characterization of human coronary plaques. J. Am. Coll. Cardiol. 48(1), 81–88 (2006).
- Bouma BE, Tearney GJ, Yabushita H et al.: Evaluation of intracoronary stenting by intravascular optical coherence tomography. Heart 89(3), 317–320 (2003).
- Kubo T, Imanishi T, Kitabata H et al.: Comparison of vascular response after sirolimus-eluting stent implantation between unstable angina pectoris and stable angina pectoris: a serial optical coherence tomography study. J. Am. Coll. Cardiol. Img. 1(4), 475–484 (2008).
- Matsumoto D, Shite J, Shinke T et al.: Neointimal coverage of sirolimus-eluting stents at 6-month follow-up: evaluated by optical coherence tomography. Eur. Heart J. 28(8), 961–967 (2007).
- Yamaguchi T, Terashima M, Akasaka T et al.: Safety and feasibility of an intravascular optical coherence tomography image wire system in the clinical setting. Am. J. Cardiol. 101(5), 562–567 (2008). & Reported the safety and feasibility of intracoronary optical coherence tomography imaging with the occlusive technique in a multicenter study.
- Kataiwa H, Tanaka A, Kitabata H, Imanishi T, Akasaka T: Safety and usefulness of non-occlusion image acquisition technique for optical coherence tomography. Circ. J. 72(9), 1536–1537 (2008).
- Prati F, Cera F, Ramazzotti V, Imola F, Giudice R, Albertucci M: Safety and feasibility of a new non-occlusive technique for facilitated intracoronary optical coherence tomography (OCT) acquisition in various clinical and anatomical scenarios. Eurointervention 3(3), 365–70 (2007).
- Prati F, Cera M, Ramazzotti V, Imola F, Giudice R, Giudice M et al.: From bench to bedside: a novel technique of acquiring OCT images. Circ. J. 72(5), 839–843 (2008).
- Barlis P, Gonzalo N, Di Mario C et al.: A multicentre evaluation of the safety of intracoronary optical coherence tomography. EuroIntervention 5(1), 90–95 (2009).
- Kume T, Akasaka T, Kawamoto T et al.: Assessment of coronary intima-media thickness by optical coherence tomography: comparison with intravascular ultrasound. Circ. J. 69(8), 903–907 (2005).
- Ishibashi K, Kitabata H, Akasaka T: Intracoronary optical coherence tomography assessment of spontaneous coronary artery dissection. Heart 95(10), 818 (2009).
- Alfonso F, Canales E, Aleong G: Spontaneous coronary artery dissection: diagnosis by optical coherence tomography. Eur. Heart J. 30(3), 385 (2009).
- Yabushita H, Bouma BE, Houser SL et al.: Characterization of human atherosclerosis by optical coherence tomography. Circulation 106(13), 1640–1645 (2002).
- Kume T, Akasaka T, Kawamoto T et al.: Assessment of coronary arterial plaque by optical coherence tomography. Am. J. Cardiol. 97(8), 1172–1175 (2006).
- Kume T, Akasaka T, Kawamoto T et al.: Assessment of coronary arterial thrombus by optical coherence tomography. Am. J. Cardiol. 97(12), 1713–1717 (2006).
- Kubo T, Imanishi T, Takarada S et al.: Assessment of culprit lesion morphology in acute myocardial infarction: ability of optical coherence tomography: compared with intravascular ultrasound and coronary angioscopy. J. Am. Coll. Cardiol. 50(10), 933–9 (2007). & Reported the features of vulnerable plaques in culprit site using three modalities of optical coherence tomography, intravascular ultrasound and angioscopy in 30 acute myocardial infarction patients.
- Kume T, Akasaka T, Kawamoto T et al.: Measurement of the thickness of the fibrous cap by optical coherence tomography. Am. Heart J. 152(4), 755.E1–E4 (2006).
- Tearney GJ, Yabushita H, Houser SL et al.: Quantification of macrophage content in atherosclerotic plaques by optical coherence tomography. Circulation 107(1), 113–119 (2003).
- Jang IK, Tearney GJ, MacNeill B et al.: In vivo characterization of coronary atherosclerotic plaque by use of optical coherence tomography. Circulation 111(12), 1551–1555 (2005). & First reported culprit coronary lesion morphology in acute coronary syndrome in humans.
- Sawada T, Shite J, Garcia-Garcia HM et al.: Feasibility of combined use of intravascular ultrasound radiofrequency data analysis and optical coherence tomography for detecting thin-cap fibroatheroma. Eur. Heart J. 29(9), 1136–1146 (2008).
- Fujii K, Masutani M, Okumura T et al.: Frequency and predictor of coronary thin-cap fibroatheroma in patients with acute myocardial infarction and stable angina pectoris: a 3-vessel optical coherence tomography study. J. Am. Coll. Cardiol. 52(9), 787–788 (2008).
- Tanaka A, Imanishi T, Kitabata H et al.: Distribution and frequency of thin- capped fibroatheromas and ruptured plaques in the entire culprit coronary artery in patients with acute coronary syndrome as determined by optical coherence tomography. Am. J. Cardiol. 102(8), 975–979 (2008).
- Tanaka A, Imanishi T, Kitabata H et al.: Morphology of exertion-triggered plaque rupture in patients with acute coronary syndrome: an optical coherence tomography study. Circulation 118(23), 2368–2373 (2008).
- Kashiwagi M, Tanaka A, Kitabata H et al.: Relationship between coronary arterial remodeling, fibrous cap thickness and high-sensitivity C-reactive protein levels in patients with acute coronary syndrome. Circ. J. 73(7), 1291–1295 (2009).
- Tanaka A, Imanishi T, Kitabata H et al.: Lipid-rich plaque and myocardial perfusion after successful stenting in patients with non-ST-segment elevation acute coronary syndrome: an optical coherence tomographystudy. Eur. Heart J. 30(11), 1348–1355 (2009).
- Toutouzas K, Tsiamis E, Karanasos A et al.: Morphological characteristics of culprit atheromatic plaque are associated with coronary flow after thrombolytic therapy: new implications of optical coherence tomography from a multicenter study. JACC Cardiovasc. Interv. 3(5), 507–514 (2010).
- Kubo T, Imanishi T, Kashiwagi S et al.: Multiple coronary lesion instability in patients with acute myocardial infarction as determined by optical coherence. Am. J. Cardiol. 105(3), 318–322 (2010).
- Naghavi M, Libby P, Falk E et al.: From vulnerable plaque to vulnerable patient: a call for new definitions and risk assessment strategies. Part I. Circulation 108(14), 1664–1672 (2003).
- Virmani R, Kolodgie FD, Burke AP et al.: Atherosclerotic plaque progression and vulnerability to rupture: angiogenesis as a source of intraplaque hemorrhage. Arterioscler. Thromb. Vasc. Biol. 25(10), 2054–2061 (2005).
- Fujii K, Kawasaki D, Masutani M et al.: OCT assessment of thin-cap fibroatheroma distribution in native coronary arteries. JACC Cardiovasc. Imaging 3(2), 168–175 (2010).
- Cheruvu PK, Finn AV, Gardner C et al.: Frequency and distribution of thin-cap fibroatheroma and ruptured plaques in human coronary arteries: a pathologic study. J. Am. Coll. Cardiol. 50(10), 940–949 (2007).
- MacNeill BD, Jang IK, Bouma BE et al.: Focal and multi-focal plaque macrophage distributions in patients with acute and stable presentations of coronary artery disease. J. Am. Coll. Cardiol. 44(5), 972–979 (2004).
- Tanaka A, Tearney GJ, Bouma BE: Challenges on the frontier of intracoronary imaging: atherosclerotic plaque macrophage measurement by optical coherence tomography. J. Biomed. Optics 15(1), 011104 (2010).
- Mizukoshi M, Imanishi T, Tanaka A et al.: Clinical classification and plaque morphology determined by optical coherence tomography in unstable angina pectoris. Am. J. Cardiol. 106(3), 323–328 (2010).
- Virmani R, Kolodgie FD, Burke AP, Farb A, Schwartz SM: Lessons from sudden coronary death: a comprehensive morphological classification scheme for atherosclerotic lesions. Arterioscler. Thromb. Vasc. Biol. 20(5), 1262–1275 (2000).
- Takarada S, Imanishi T, Kubo T et al.: Effect of statin therapy on coronary fibrous-cap thickness in patients with acute coronary syndrome assessment by optical coherence tomography study. Atherosclerosis 202(2), 491–497 (2009).
- Takarada S, Imanishi T, Ishibashi K et al.: The effect of lipid and inflammatory profiles on the morphological changes of lipid-rich plaques in patients with non-ST elevated acute coronary syndrome: follow-up study by optical coherence tomography and intravascular ultrasound. JACC Cardiovasc. Interv. 3(7), 766–772 (2010).
- Doyle B, Caplice N: Plaque neovascularization and antiangiogenic therapy for atherosclerosis. J. Am. Coll. Cardiol. 49(21), 2073–2080 (2007).
- Kitabata H, Tanaka A, Kubo T et al.: Relation of microchannel structure identified by optical coherence tomography to plaque vulnerability in patients with coronary artery disease. Am. J. Cardiol. 105, 1673–1678 (2010).
- Vorpahl M, Nakano M, Virmani R: Small black holes in optical frequency domain imaging matches intravascular neoangiogenesis formation in histology. Eur. Heart J. 31(15), 1889 (2010).
- Moulton KS, Vakili K, Zurakowski D et al.: Inhibition of plaque neovascularization reduces macrophage accumulation and progression of advanced atherosclerosis. Proc. Natl Acad. Sci. USA 100(8), 4736–4741, (2003).
- Finn AV, Jain RK: Coronary plaque neovascularization and hemorrhage: a potential target for plaque stabilization? JACC Cardiovasc. Imaging 3(1), 41–44 (2010).
- Finn AV, Joner M, Nakazawa G et al.: Pathological correlates of late drug-eluting stent thrombosis: strut coverage as a marker of endothelialization. Circulation 115(18), 2435–2441 (2007).
- Suzuki Y, Ikeno F, Koizumi T et al.: In vivo comparison between optical coherence tomography and intravascular ultrasound for detecting small degrees of in-stent neointima after stent implantation. JACC Cardiovasc. Interv. 1(2), 168–173 (2008). & Reported that with good histological correlation, optical coherence tomography detected a small degree of in-stent neointima more accurately than intravascular ultrasound.
- Capodanno D, Prati F, Pawlowsky T et al.: Comparison of optical coherence tomography and intravascular ultrasound for the assessment of in-stent tissue coverage after stent implantation. EuroIntervention 5(5), 538–543 (2009).
- Mills JS, N’diaye CS, Yow E et al.: Preliminary observations using optical coherence tomography to assess neointimal coverage of a metal stent in a porcine model. Cardiovasc. Revasc. Med. 10(4), 229–235 (2009).
- Murata A, Wallace-Bradley D, Tellez A et al.: Accuracy of optical coherence tomography in the evaluation of neointimal coverage after stent implantation. JACC Cardiovasc. Imaging 3(1), 76–84 (2010).
- Xie Y, Takano M, Murakami D et al.: Comparison of neointimal coverage by optical coherence tomography of a sirolimus-eluting stent versus a bare-metal stent three months after implantation. Am. J. Cardiol. 102(1), 27–31 (2008).
- Zhu-hua Y, Matsubara T, Inada T, Suzuki Y, Suzuki T: Neointimal coverage of sirolimuseluting stents 6 months and 12 months after implantation: evaluation by optical coherence tomography. Chin. Med. J. 121(6), 503–507 (2008).
- Katoh H, Shite J, Shinke T et al.: Delayed neointimalization on sirolimus-eluting stents: 6-months and 12-month follow up by optical coherence tomography. Circ. J. 73(6), 1033–1037 (2009).
- Takano M, Yamamoto M, Inami S et al.: Long-term follow-up evaluation after sirolimuseluting stent implantation by optical coherence tomography: do uncovered struts persist? J. Am. Coll. Cardiol. 51(9), 968–969 (2008).
- Takano M, Yamamoto M, Mizuno M et al.: Late vascular responses from 2 to 4 years after implantation of sirolimus-eluting stents: serial observations by intracoronary optical coherence tomography. Circ. Cardiovasc. Interv. 3(5), 476–483 (2010).
- Finn AV, Kolodgie FD, Harnek J et al.: Differential response of delayed healing and persistent inflammation at sites of overlapping sirolimus- or paclitaxel-eluting stents. Circulation 112(2), 270–278 (2005).
- Guagliumi G, Musumeci G, Sirbu V et al.: Optical coherence tomography assessment of in vivo vascular response after implantation of overlapping bare-metal and drug-eluting stents. JACC Cardiovasc. Interv. 3(5), 531–539 (2010). & Reported that the pattern of vascular healing after implantation was different according to the types of stent and the overlap or nonoverlap segments.
- Otake H, Shite J, Ako J et al.: Local determinants of thrombus formation following sirolimuseluting stent implantation assessed by optical coherence tomography. JACC Cardiovasc. Interv. 2(5), 459–466 (2009).
- Kim JS, Hong MK, Fan C et al.: Intracoronary thrombus formation after drug-eluting stents implantation: optical coherence tomographic study. Am. Heart J. 159(2), 278–283 (2010).
- Cook S, Wenaweser P, Togni M et al.: Incomplete stent apposition and very late stent thrombosis after drug-eluting stent implantation. Circulation 115(18), 2426–2434 (2007).
- Ozaki Y, Okumura M, Ismail TF et al.: The fate of incomplete stent apposition with drug-eluting stents: an optical coherence tomography-based natural history study. Eur. Heart J. 31(12), 1470–1476 (2010).
- Doyle B, Rihal CS, O’Sullivan CJ et al.: Outcomes of stent thrombosis and restenosis during extended follow-up of patients treated with bare-metal coronary stents. Circulation 116(21), 2391–2398 (2007).
- Inoue K, Abe K, Ando K et al.: Pathological analyses of long-term intracoronary Palmaz–Schatz stenting. Is its efficacy permanent? Cardiovasc. Pathol. 13(2), 109–115 (2004).
- Hasegawa K, Tamai H, Kyo E et al.: Histopathological findings of new in-stent lesions developed beyond five years. Catheter. Cardiovasc. Interv. 68(4), 554–558 (2006).
- Takano M, Yamamoto M, Inami S et al.: Appearance of lipid-laden intima and neovascularization after implantation of bare metal stents: extended late phase observation by intracoronary optical coherence tomography. J. Am. Coll. Cardiol. 55(1), 26–32 (2010). & Reported that neointima within the bare-metal stent might transform into lipid-laden tissue during an extended follow-up period.
- Kashiwagi M, Kitabata H, Tanaka A et al.: Very late clinical cardiac event after BMS implantation: in vivo optical coherence tomography examination. JACC Cardiovasc. Imaging 3(5), 525–527 (2010).
- Hou J, Qi H, Zhang M et al.: Development of lipid-rich plaque inside bare metal stent: possible mechanism of late stent thrombosis? An optical coherence tomography. Heart 96(15), 1187–1190 (2010).
- Lee CW, Kang SJ, Park DW et al.: Intravascular ultrasound findings in patients with very late stent thrombosis after either drug-eluting or bare-metal stent implantation. J. Am. Coll. Cardiol. 55(18), 1936–1942 (2010).
- Schultz C, van der Ent M, Serruys PW, Regar E: Optical coherence tomography to guide treatment of chronic occlusions? JACC Cardiovasc. Interv. 2(4), 366–367 (2009).
- Tyczynski P, Kukreja N, Pieri E, di Mario C: Optical frequency domain imaging guided crossing of a stumpless chronic total occlusion. Int. J. Cardiol. 148(2), 231–233 (2011).
- Gonzalo N, Serruys PW, Okamura T et al.: Relation between plaque type and dissections at the edges after stent implantation: an optical coherence tomography study. Int. J. Cardiol. DOI:10.1016/j.ijcard.2010.03.006 (2010) (Epub ahead of print).
- Barlis P, Schmitt JM: Current and future developments in intracoronary optical coherence tomography imaging. EuroIntervention 4(4), 529–533 (2009).
- Takarada S, Imanishi T, Liu Y et al.: Advantage of next-generation frequencydomain optical coherence tomography compared with conventional time-domain system in the assessment of coronary lesion. Catheter. Cardiovasc. Interv. 75(2), 202–206 (2010).
- Okamura T, Gonzalo N, Gutiérrez-Chico JL et al.: Reproducibility of coronary Fourier domain optical coherence tomography: quantitative analysis of in vivo stented coronary arteries using three different software packages. EuroIntervention 6(3), 371–379 (2010).
- Bezerra HG, Costa MA, Guagliumi G, Rollins AM, Simon DI: Intracoronary optical coherence tomography: a comprehensive review clinical and research applications. JACC Cardiovasc. Interv. 2(11), 1035-1046 (2009).


