Review Article - Imaging in Medicine (2013) Volume 5, Issue 5
Role of MRI perfusion in improving the treatment of brain tumors
David Fussell1 and Robert J Young*1,21Department of Radiology, Memorial Sloan-Kettering Cancer Center, MRI-1156, New York, NY 10065, USA
2Brain Tumor Center, Memorial Sloan-Kettering Cancer Center, MRI-1156, New York, NY 10065, USA
Abstract
Keywords
arterial spin-labeled; brain tumors; dynamic contrast-enhanced; dynamic susceptibility contrast; MRI perfusion; pseudoprogression; pseudoresponse; radiation injury
The goal of MRI perfusion is to provide noninvasive estimates of functional hemodynamic parameters. Many different techniques are available: arterial spin-labeled (ASL), dynamic susceptibility contrast (DSC) and dynamic contrast- enhanced (DCE) T1-weighted perfusion imaging. Each has particular advantages and disadvantages; for instance, ASL perfusion imaging does not require the intravenous administration of gadolinium contrast material, therefore, one or more acquisitions can be obtained without concern for renal toxicity. DSC and DCE perfusion imaging require contrast material but are more widely available on clinical scanners and offer greater signal-to-noise ratios. DCE perfusion data can be fitted to one of several models of the tissue microenvironment, allowing the direct measurement of meaningful hemodynamic parameters.
Perfusion parameters have been correlated with histopathologic measures of microvascular density, proliferation and hyperplasia [1–5]. Perfusion imaging has been applied to many different pathologic entities that disturb tissue perfusion [6]. In addition to neoplasm, the subject of this review, other conditions under investigation with MRI perfusion include inflammatory disorders, infections, epilepsy and stroke. Hemodynamic parameters have been shown to be useful in diagnosing and grading primary brain tumors, directing brain biopsy to the most aggressive component of an individual lesion and, most recently, evaluating response to therapy by both distinguishing radiation necrosis from the progressive tumor and by improving our ability to assess response to novel antiangiogenic chemotherapeutics. The purpose of this paper is to summarize commonly applied MRI perfusion techniques and discuss their applications and limitations in brain tumor imaging.
Perfusion methods
The common goal of all MRI perfusion techniques is to generate an image contrast that models the concentration of blood in tissues. DSC and DCE techniques derive information about blood flow from the effects of gadolinium contrast on the MR signal. Repeated successive acquisitions at short intervals permit the estimation of various hemodynamic perfusion parameters. Common DSC and DCE perfusion parameters are summarized in Table 1. In DSC perfusion, the better established and more widely used of the two techniques [7–9], T2- or T2*- weighted images are obtained to track the first pass transit of contrast, which is assumed to be intravascular. In DCE perfusion, T1-weighted images are obtained to measure changes in tissue concentration. ASL does not use gadolinium contrast.
DSC T2*-weighted MRI perfusion
DSC perfusion can be obtained using both spin echo (SE) and gradient echo (GRE) sequences. SE images employ a 180° refocusing pulse that eliminates T2* effects and, similar to a diffusion-weighted sequence, only measures the signal loss that results from the diffusion of protons through gadolinium-induced magnetic field gradients, as well as from direct intravascular T2-changes. The effect is strongest where gadolinium contrast varies most sharply over a short distance (relative to the typical diffusion distance at the time-scale of the experiment; i.e., the echo time), for example, across the membrane of a capillary [10–12]. SE sequences are, therefore, most sensitive to microvascular density. GRE techniques, on the other hand, do not include a refocusing pulse and are more sensitive to susceptibility effects of gadolinium across a range of vessel calibers. Foregoing the refocusing pulse permits a shorter echo time, so that GRE sequences are faster than SE sequences, allowing either greater temporal resolution or a larger field of view. Since T2* effects are included, the signal changes in GRE sequences are greater and images of high quality can be obtained with a smaller dose of contrast material [13]. For these reasons, GRE pulse sequences are most commonly used clinically; however, recently techniques have been developed that seek to combine the benefits of SE and GRE imaging [14].
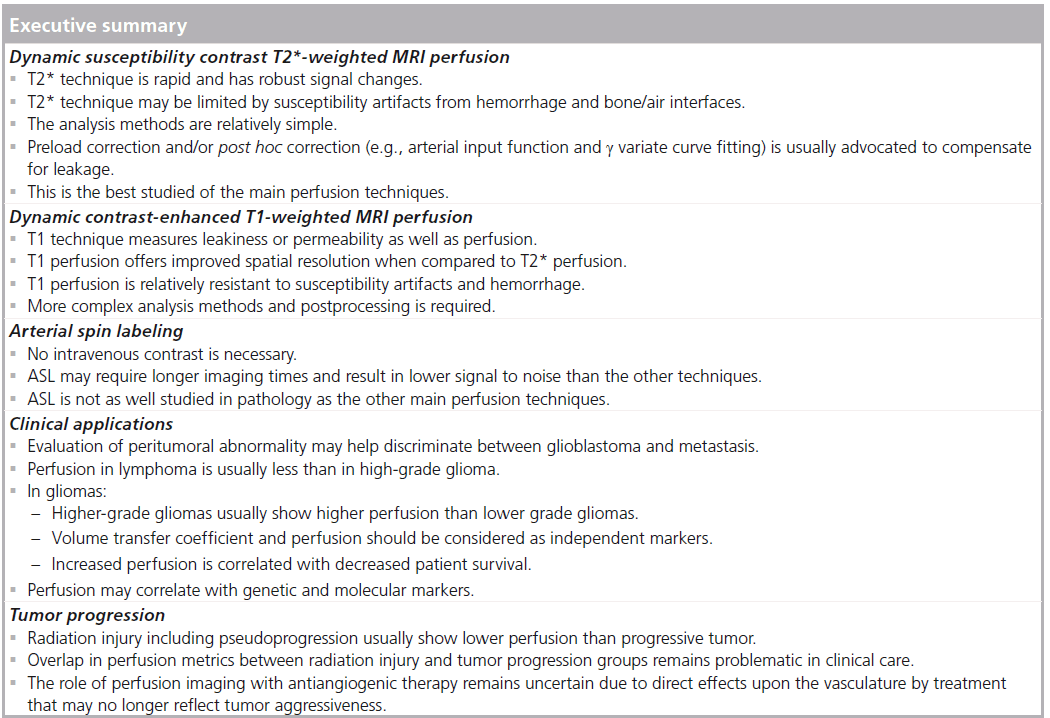
Although they are not entirely accurate [15], two assumptions that are usually made when analyzing DSC perfusion data are that the relationship between signal loss and contrast concentration within a voxel is linear, and that the T1 effects of gadolinium are negligible. To generate perfusion maps, contrast concentration is computed as a function of time on a per voxel basis during the rapid (assumed intra vascular) tracking of the contrast bolus. The area under the time–contrast curve gives an estimate of cerebral blood volume (CBV). Time to peak concentration can also be obtained directly from the time–contrast curve. Measurement of the arterial input function permits the quantification of cerebral blood flow (CBF) and mean transit time. Owing to the many assumptions that must be made in the calculation of these parameters, values are usually reported relative to an area of brain parenchyma presumed to be normal, usually in the contralateral hemisphere. Relative values have been shown to be less sensitive to choice of arterial input function [16] and, in some cases, are more accurate in predicting pathology [17]. Two commonly applied DSC parameters are relative CBV (rCBV), used to estimate perfusion normalized to contralateral white matter, and percentage signal recovery (PSR), used to estimate leakiness by measuring the recovery of the signal–intensity curve to baseline.
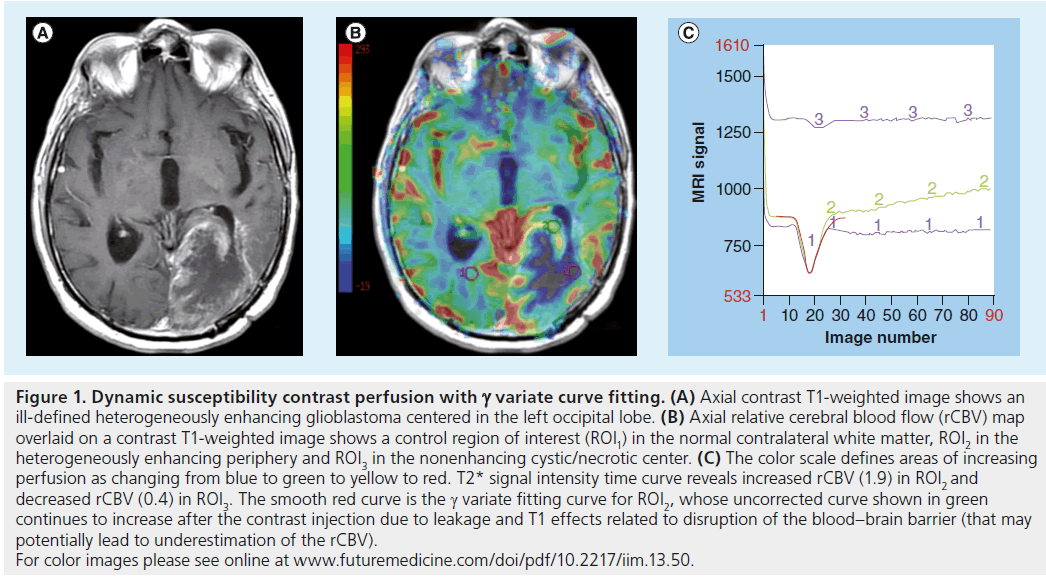
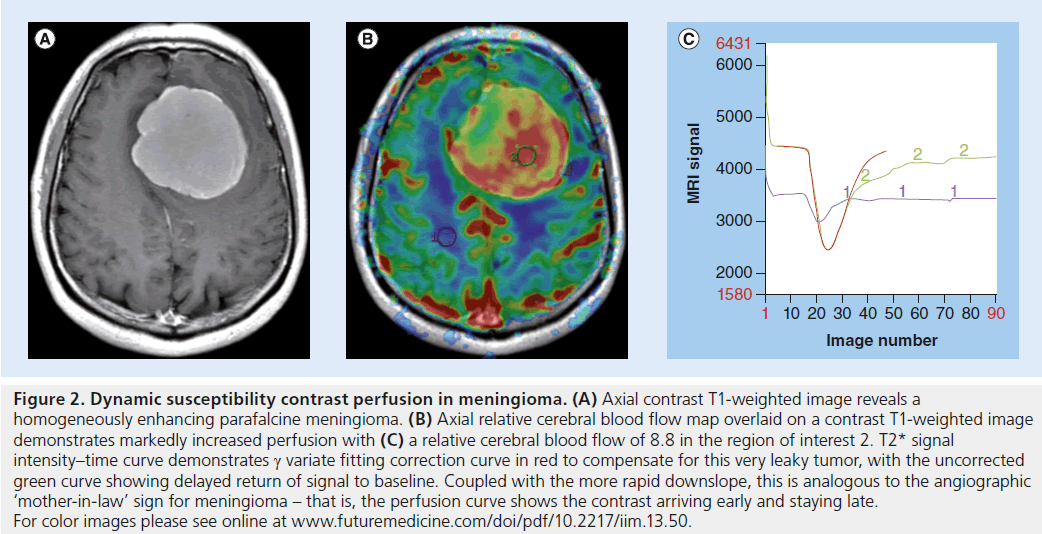
The DSC perfusion model presumes an intact blood–brain barrier (BBB). The most common model is the single compartment model, based on the intravascular indicator dilution theory where all of the administered contrast agent remains confined within the vasculature [18]. This assumption is invalid in most pathologic conditions – wherever there is contrast enhancement, the BBB must be compromised. The extravasation of contrast agent alters the T1 relaxation time and modifies the MRI signal intensity, complicating any estimation of perfusion parameters. Techniques have been developed to compensate for this leakage of contrast agent from the vasculature into the interstitial space and/or recirculation effects [19,20], for example, by preloading with a dose of intravenous contrast before scanning begins. The amount of contrast administered for the preload dose may vary according to the local institutional preferences by an order of magnitude from 0.01 to 0.10 mmol/kg, with no consensus on the optimal preload dose to yield the most accurate perfusion metrics [21,22]. T1 effects may also be reduced by using low flip angle gradient echo sequences and dual-echo sequences [23,24]. Using a low flip angle (35°) gradient echo sequence and a single contrast dose, Essock-Burns et al. found that blood volume metrics from both a nonlinear fitting analysis and nonparametric analysis of the time–concentration curve were able to predict areas of microvascular hyperplasia in 72 tissue samples from 35 glioblastoma patients [5]. Post hoc corrections may also be performed using g variate curve fitting or an arterial input function [25], although these may incompletely correct the underlying artifacts. In the former of these, the change in R2* (ΔR2*) curve is modeled from the sum of the g variate function and the leakage caused by the contrast bolus using a nonlinear fitting procedure (Figures 1 & 2) [5]. Without correction of T1-weighted leakage and T2/T2*-weighted effects, the accuracy of DSC perfusion has been described as only 81% [21]. Other authors have described DSC perfusion as inconsistent in the absence of any correction [22,26], potentially limiting its clinical applicability [19].
DCE T1-weighted MRI perfusion
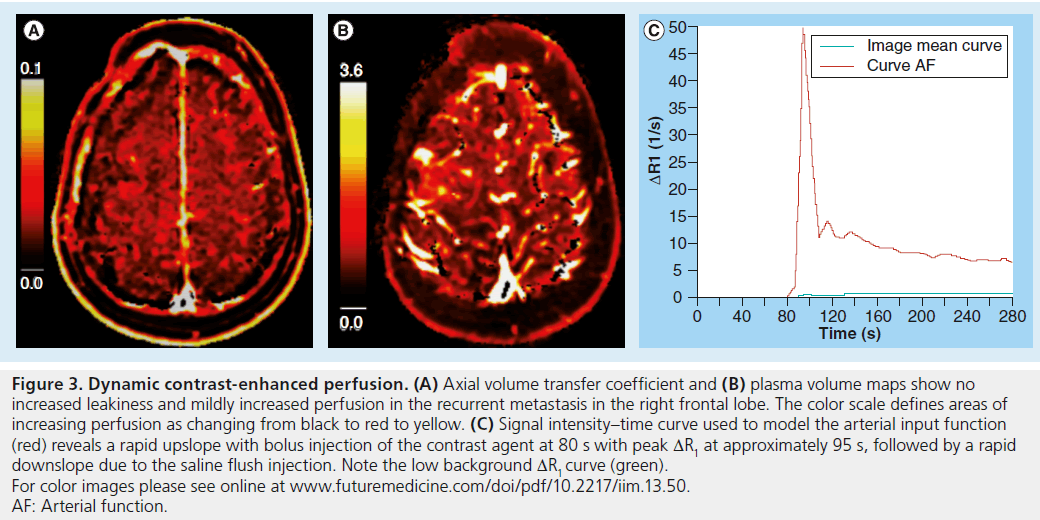
DCE perfusion also requires the intravenous administration of gadolinium contrast to exploit the leakiness of pathologic capillaries to provide useful information about microvascular structure. As with DSC perfusion, a gadolinium bolus is dynamically tracked through tissue to estimate hemodynamic parameters. Unlike DSC perfusion, DCE perfusion uses T1-weighted images to measure changes in the tissue concentration of intravenous contrast over time. Image contrast depends on the observed T1 shortening of the gadolinium bolus and increase in MRI signal as it passes through the tissue of interest. The relationship between contrast concentration and signal intensity depends on precontrast tissue relaxivity, flip angle, repetition time and proton density, which is somewhat more complex than in the case of DSC perfusion [27,28]. Since the calculation of contrast concentration from signal intensity does not presume an intact BBB, additional information is available about the movement of the tracer across the capillary membrane and into the tissue. Multiple methods for deriving so-called model-based parameters have been reported. Most commonly, a two-compartment model of the local tissue environment is assumed [29]. The tracer flows into the capillary system from the arterial circulation and, if the BBB is disrupted, can extravasate into the interstitium. The two compartments of the model are the intravascular plasma space, which represents contrast material in blood plasma, and the extravascular extracellular space (EES), which represents the portion of tissue into which the tracer can diffuse. DCE signal is calculated from the plasma volume (Vp) estimating the plasma volume fraction, the Ve estimating the extravascular–extracellular fraction in the EES and the cellular volume estimating the cellular fraction (Figure 3). A primary goal of DCE perfusion is to estimate the volume transfer coefficient (Ktrans), which measures the passage of the tracer from the intravascular plasma space to the EES. Although it depends on multiple factors including capillary permeability, capillary surface area and plasma flow, Ktrans can be considered to be a measure of capillary leakiness [30]. A popular model assumes that Ve >>> Vp, and therefore simply solves for Ktrans and Ve while ignoring Vp. The details of the derivation of these parameters to describe vascular leakiness, which includes measurement of the arterial input function from a large vessel, are beyond the scope of this article, but many excellent reviews on this topic are available [28,29,31,32]. The first and currently only US FDA-approved DCE perfusion module is nordicICE (Nordic- NeuroLab, WI, USA).
Figure 1. Dynamic susceptibility contrast perfusion with g variate curve fitting. (A) Axial contrast T1-weighted image shows an ill-defined heterogeneously enhancing glioblastoma centered in the left occipital lobe. (B) Axial relative cerebral blood flow (rCBV) map overlaid on a contrast T1-weighted image shows a control region of interest (ROI1) in the normal contralateral white matter, ROI2 in the heterogeneously enhancing periphery and ROI3 in the nonenhancing cystic/necrotic center. (C) The color scale defines areas of increasing perfusion as changing from blue to green to yellow to red. T2* signal intensity time curve reveals increased rCBV (1.9) in ROI2 and decreased rCBV (0.4) in ROI3. The smooth red curve is the g variate fitting curve for ROI2, whose uncorrected curve shown in green continues to increase after the contrast injection due to leakage and T1 effects related to disruption of the blood–brain barrier (that may potentially lead to underestimation of the rCBV). For color images please see online at www.futuremedicine.com/doi/pdf/10.2217/iim.13.50.
Figure 2. Dynamic susceptibility contrast perfusion in meningioma. (A) Axial contrast T1-weighted image reveals a homogeneously enhancing parafalcine meningioma. (B) Axial relative cerebral blood flow map overlaid on a contrast T1-weighted image demonstrates markedly increased perfusion with (C) a relative cerebral blood flow of 8.8 in the region of interest 2. T2* signal intensity–time curve demonstrates g variate fitting correction curve in red to compensate for this very leaky tumor, with the uncorrected green curve showing delayed return of signal to baseline. Coupled with the more rapid downslope, this is analogous to the angiographic ‘mother-in-law’ sign for meningioma – that is, the perfusion curve shows the contrast arriving early and staying late. For color images please see online at www.futuremedicine.com/doi/pdf/10.2217/iim.13.50.
Arterial spin labeling
ASL does not require any exogenous gadolinium contrast. Instead, arterial blood water molecules are used as the freely diffusible intrinsic contrast. First, protons within a slice proximal to (upstream from) the imaging volume are tagged with an inversion pulse. Dynamic scans through the volume of interest are then evaluated before and after the arrival of the tagged spins in order to obtain perfusion information [33–35]. In general, techniques are divided into continuous ASL (CASL), pulsed ASL (PASL) and pseudocontinuous ASL (p-CASL).
In CASL, a continuous labeling radiofrequency pulse or a long train of pulses (over several seconds) is applied to adiabatically invert arterial blood spins through the labeling slice. This is based on the theory of adiabatic fast passage. CASL provides more effective spin labeling and a higher signal than PASL. These advantages are countered by the fact that macromolecules in the volume of interest, which have a broad range of resonance frequencies, become saturated over time by the continuous radiofrequency pulses and transfer this magnetization back to the tissue in the form of a high specific absorption rate [36].
PASL applies short inversion pulses (over a few milliseconds) to a thick slab of inflowing spins close to the imaging volume. Multiple PASL sequences have been developed to address specific shortcomings of the basic technique [37,38]. PASL techniques are easier to implement and have a lower specific absorption rate than CASL. PASL also demonstrates high labeling efficiency over a wide range of blood flow velocities.
p-CASL applies a train of rapidly repeating low-tip pulses and alternating sign magnetic field gradients to perform continuous labeling. This provides a higher signal-to-noise ratio and does not require any additional complicated modeling or saturation pulses as compared with PASL. p-CASL and PASL have been described as having superior intersite reproducibility to CASL [39], although p-CASL has been advocated as the default technique for clinical ASL perfusion due to its insensitivity to vessel geometry and other advantages over PASL [40]. Further improvements to the p-CASL technique, such as modified p-CASL, may overcome the cumulative tipping that occurs in PASL to maintain the ASL signal [41].
ASL principally provides an estimate of the absolute CBF, most commonly using a single compartment model under the assumption that water diffuses freely across vascular membranes [42]. Some investigators have employed models of two or more compartments with concordant results [43]. CBF measurements correlate well with perfusion values obtained by other means [44]. Hirai et al. examined 24 patients with glioma and found similar reproducibility and intermodality agreement for tumor blood flow (TBF) using DSC and ASL perfusion techniques [45].
Summary of perfusion techniques
Each of the three main MR perfusion techniques has unique advantages and disadvantages. DSC perfusion is the best established and most widely studied of the three techniques. It is relatively easy to implement and data analysis is straightforward [46]. DSC offers highest contrast-tonoise ratios and, since the majority of schemes use echo planar imaging, acquisitions are rapid and easy to incorporate into routine practice. Greater experience with this technique and a broader base of published data will provide guidance in the interpretation of results.
DCE perfusion offers lower contrast-to-noise ratios but greater spatial resolution. The ability to quantify microvascular leakiness is an important advantage, for example, in grading gliomas [47], where Ktrans has been suggested to be the single best indicator of a high-grade tumor. On the other hand, calculation of hemodynamic parameters is complex and a multitude of data analysis packages are available. To some degree, this has prevented the establishment of meaningful numerical criteria with which to interpret DCE perfusion data.
ASL is perhaps the least well-studied perfusion technique and clinical availability remains limited. Signal-to-noise ratio is low particular for white matter regions. As the only technique that does not require contrast material, however, it can be employed in patients with poor renal function or limited intravenous access. Whereas repeated acquisition of DCE and DSC data is limited by total gadolinium dose, ASL measurements can be performed an unlimited number of times in rapid succession, so that the results of an intervention can be assessed immediately. The noninvasive nature of ASL perfusion is also advantageous when scanning in children. A positive linear correlation has been described between ASL and DSC perfusion, although the CBF results may be regionally similar but spatially different [48].
An emerging perfusion technique is steadystate susceptibility contrast CBV (SS-CBV) mapping. SS-CBV mapping acquires T2 or T2* maps without and with injection of a blood-pool contrast agent. One such agent is ferumoxytol, an ultra small superparamagnetic iron oxide nanoparticle that is confined to the intravascular space due to its larger size and longer half-life (~12 h) than gadolinium compounds. Christen et al. described a linear relationship between ferumoxytol dose (mg/kg) and DR2* (1/s) in the brains of seven volunteers, with SS-CBV images acquired to 1 mm3 isotropic spatial resolution [49]. Varallyay et al. examined 65 patients and found good correlations between SS-CBV and DSC perfusion techniques, with SS-CBV again providing superior spatial resolution [50]. Further studies into SS-CBV techniques and blood-pool contrast agents are necessary, as are direct comparisons to existing perfusion techniques as well as validation with histopathology in different pathologic conditions.
Figure 3. Dynamic contrast-enhanced perfusion. (A) Axial volume transfer coefficient and (B) plasma volume maps show no increased leakiness and mildly increased perfusion in the recurrent metastasis in the right frontal lobe. The color scale defines areas of increasing perfusion as changing from black to red to yellow. (C) Signal intensity–time curve used to model the arterial input function (red) reveals a rapid upslope with bolus injection of the contrast agent at 80 s with peak DR1 at approximately 95 s, followed by a rapid downslope due to the saline flush injection. Note the low background DR1 curve (green). For color images please see online at www.futuremedicine.com/doi/pdf/10.2217/iim.13.50. AF: Arterial function.
Clinical applications
Diagnosis & characterization of brain tumors
Conventional MRI is the technique of choice for the localization and differential diagnosis of cerebral mass lesions. In many cases, however, there is considerable overlap in the imaging features of different pathologic entities and narrowing the differential diagnosis is difficult. Perfusion imaging has been applied as a problem-solving tool in a wide array of clinical scenarios, for example, in distinguishing an abscess from a tumor or demyelinating plaque from normal white matter [51–53]. Perfusion imaging has proven to be exceptionally useful in the identification of primary CNS gliomas, of which approximately 22,500 new cases are diagnosed each year in the USA [54]. Accurate diagnosis, characterization and prognostication with noninvasive imaging is highly desirable. Perfusion techniques are well suited to imaging of primary brain tumors owing to their highly vascular nature [55]. Furthermore, the degree of vascularity has been correlated with glioma grade [56].
Distinguishing glioblastoma from metastasis
Metastasis is the most common brain tumor in adults and can have an imaging appearance similar to that of glioblastoma and other highgrade glioma. Clinical information is useful but not always definitive, as 30–50% of metastases are solitary [57], and primary brain tumors may occur in patients with systemic malignancies [58]. A study by Young and Setayesh used SE DSC perfusion to distinguish metastasis from highgrade glioma [59]. The study population included 40 patients with metastasis and 43 with highgrade glioma. The authors reported an rCBV ratio (rCBV of enhancing tumor compared with that of contralateral normal-appearing white matter) of 1.53 ± 0.79 in high-grade glioma versus 0.82 ± 0.40 in metastasis. At an rCBV threshold of 1.0, they achieved a diagnostic sensitivity of 88% and a specificity of 72%. The considerable overlap in intratumoral rCBV values between metastases and high-grade gliomas, however, limits any success in using perfusion MRI to distinguish between the two in routine practice.
DCE and ASL perfusion imaging of metastases have been less well studied. Ludemann et al. reported DCE perfusion data for 41 gliomas, six meningiomas and eight metastases using a novel three-compartment model, with the EES split into two subspaces using different exchange constants [60]. CBV was highest in meningiomas, intermediate in metastases and lowest in gliomas. One possible explanation for this conflicting result is the inclusion in the dataset of low-grade gliomas, tumors that tend not to be hypervascular. In our DCE experience, both high-grade gliomas and metastases tend to show increased plasma volume and capillary leakiness with little distinction in measurements. ASL studies are known to correlate well in general with other measures of perfusion; a recent qualitative study found a close correlation (r = 0.69) between CBF measurements obtained from gliomas and metastases [61]. Yamashita et al. examined PASL in five hemangioblastomas and 14 metastases and found higher absolute TBF and relative TBF values in hemangioblastomas, with the exception of a vascular renal cell carcinoma metastasis [62]. A relative TBF >3.3 had 100% sensitivity, 79% specificity and 84% accuracy for the diagnosis of hemangioblastoma.
Measuring disturbances in perfusion in the T2-hyperintense peritumoral abnormality immediately surrounding a brain tumor may be more useful than measuring the tumor itself. Perfusion imaging can take advantage of this infiltrative growth pattern unique to primary brain tumors. The peritumoral region of primary brain tumors may contain both edema and infiltrating tumor cells, while the peritumoral region of metastases usually contains only bland edema. Server et al. applied GRE DSC perfusion imaging to the peritumoral region in 40 patients with glioblastoma and 21 patients with metastasis [63]. The authors reported a rCBV of 1.8 ± 0.7 for glioblastoma and 0.6 ± 0.1 for metastasis; a threshold value of 0.8 yielded a diagnostic sensitivity of 95% and a specificity of 92%. Cha et al. investigated the differences in two different metrics derived from DSC perfusion data, the peak height of the contrast curve and the percentage signal intensity recovered after bolus passage [64]. In the peritumoral region, average peak height was significantly higher for glioblastomas than for metastases. Percentage signal recovery was significantly reduced for metastases versus glioblastomas in both the peritumoral region (78 vs 83%) and in the enhancing portion of the tumor (63 vs 81%). An earlier study by Law et al. reported similar results, with mean peritumoral rCBV of 1.31 ± 0.97 for high-grade gliomas and 0.39 ± 0.19 for metastases [65].
Distinguishing high-grade glioma from lymphoma
Another common diagnostic dilemma in patients with one or more brain masses is to distinguish high-grade glioma from primary CNS lymphoma. Both can present with heterogeneously enhancing mass lesion(s) and involvement of the corpus callosum. Accurate preoperative diagnosis (or at a minimum, consideration) of lymphoma is important as the treatments are different. Maximal tumor resection has been shown to improve survival in high-grade glioma but not in lymphoma. Therefore, in a case of suspected lymphoma, the patient usually requires only a biopsy and withdrawal of steroid medication if possible to avoid potentially falsenegative histopathology results. Implications for radiation therapy, chemotherapy and prognosis also differ between the two tumors.
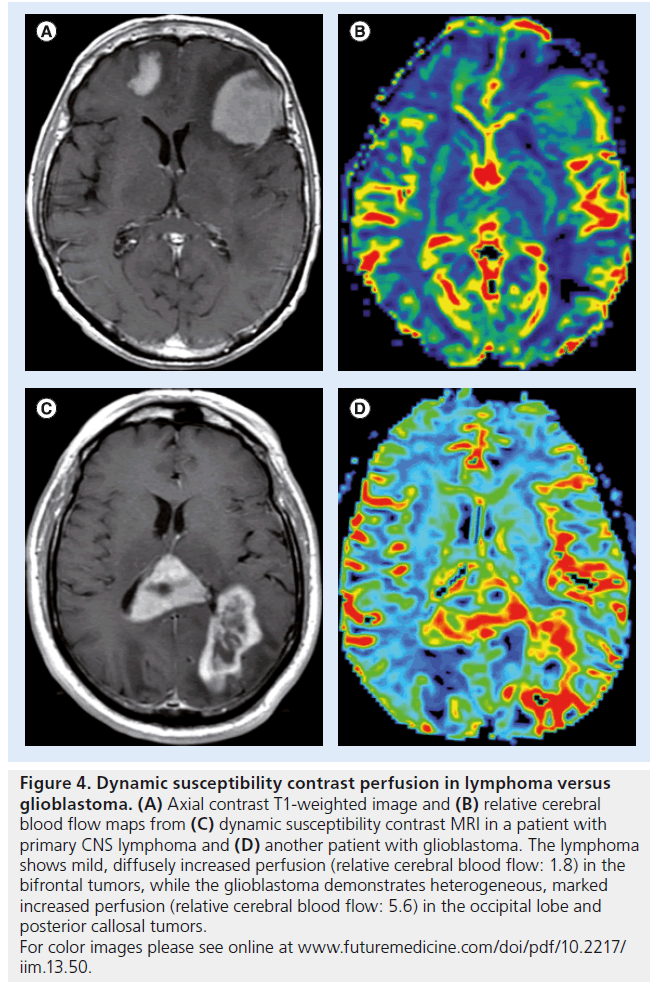
Studies of DSC perfusion imaging consistently demonstrate small increases in rCBV in lymphoma that are less than the large increases in rCBV that are observed in glioblastoma ( Figure 4) [66]. The differences in perfusion reflect the underlying pathophysiology, as lymphomas demonstrate angiocentric growth that results in mild hyperperfusion, while high-grade gliomas have neovascularity with many new, immature and leaky blood vessels [67]. The mild increase in perfusion observed in lymphoma is often disproportionate to its aggressive appearance on conventional MRI (i.e., large, ill-defined, heterogeneously enhancing, cystic/necrotic changes).
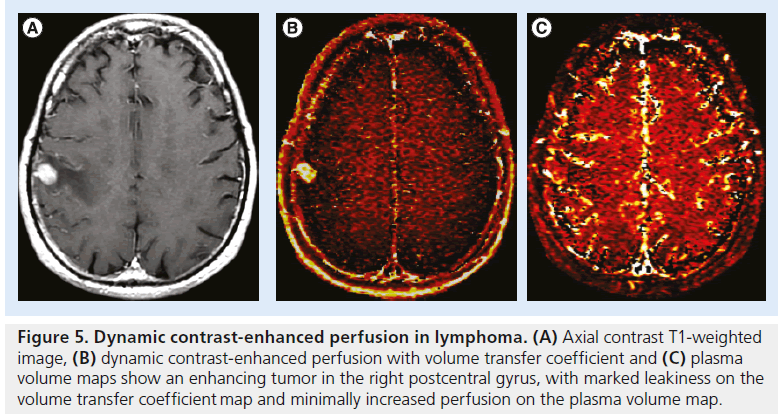
A recent study employing a contrast leakagecorrection technique found a corrected rCBV of 2.28 ± 0.60 for lymphoma and 5.47 ± 2.05 in glioblastoma [68]. Investigators are also beginning to study ASL perfusion in this setting. In a study of 26 patients, Yoo et al. found higher absolute CBF in high-grade glioma (92.1 ± 34.7 ml/100 g/min) than in lymphoma (53.6 ± 30.5 ml/100 g/min) [69]. Yamashita et al. reported similar findings, with significantly higher absolute CBF values in glioblastoma (91.6 ± 56.0 ml/100 g/min) compared with lymphoma (37.3 ± 10.5 ml/100 g/min) [70]. Weber et al. found lower increases in rCBF in CNS lymphoma than in glioblastoma using all three perfusion techniques [71]. We have observed similar trends using DCE perfusion, with lymphoma usually demonstrating a relatively mild increase in perfusion (Figure 5).
Predicting glioma grade
Perfusion imaging is useful in the grading of gliomas. Larger and more advanced tumors require greater vascularity [72], since a tumor that grows more than a few millimeters from an existing vessel must develop its own vascular supply. Tumor vessels, unlike normal host capillaries, are fragile, have a chaotic structure and lack a normal BBB [73]. Perfusion imaging can be used to estimate the increased microvascular density and capillary leakiness of these higher-grade neoplasms. Some caution is warranted in interpreting perfusion data, however, as hyperperfusion does not always signify high-grade pathology. For instance, lowgrade gliomas with substantial oligodendroglial components may show greater than expected CBF [74]. Gangliogliomas may also show elevated perfusion [75] and juvenile pilocytic astrocytomas, despite their typically benign course, often also have malignant-appearing elevations in perfusion. Studies examining the potential relationships between perfusion and tumor grade often exclude these tumor groups, focusing only on the astrocytic gliomas.
Figure 4. Dynamic susceptibility contrast perfusion in lymphoma versus glioblastoma. (A) Axial contrast T1-weighted image and (B) relative cerebral blood flow maps from (C) dynamic susceptibility contrast MRI in a patient with primary CNS lymphoma and (D) another patient with glioblastoma. The lymphoma shows mild, diffusely increased perfusion (relative cerebral blood flow: 1.8) in the bifrontal tumors, while the glioblastoma demonstrates heterogeneous, marked increased perfusion (relative cerebral blood flow: 5.6) in the occipital lobe and posterior callosal tumors. For color images please see online at www.futuremedicine.com/doi/pdf/10.2217/ iim.13.50.
Figure 5. Dynamic contrast-enhanced perfusion in lymphoma. (A) Axial contrast T1-weighted image, (B) dynamic contrast-enhanced perfusion with volume transfer coefficient and (C) plasma volume maps show an enhancing tumor in the right postcentral gyrus, with marked leakiness on the volume transfer coefficient map and minimally increased perfusion on the plasma volume map.
Studies of DSC perfusion have consistently described a good correlation between blood volume and glioma grade [76–80]. Highet-grade gliomas tend to have greater increases in perfusion than lower grade gliomas, although many studies have failed to show a significant difference between anaplastic gliomas and astrocytomas. Typically, a region of interest is drawn around the expected margins of the tumor based on contrast enhancement or another imaging feature. Young et al. have demonstrated histogram analysis as a viable alternative to region of interest placement, finding strong correlations between rCBV and glioma grade in both tumoral and peritumoral regions [81].
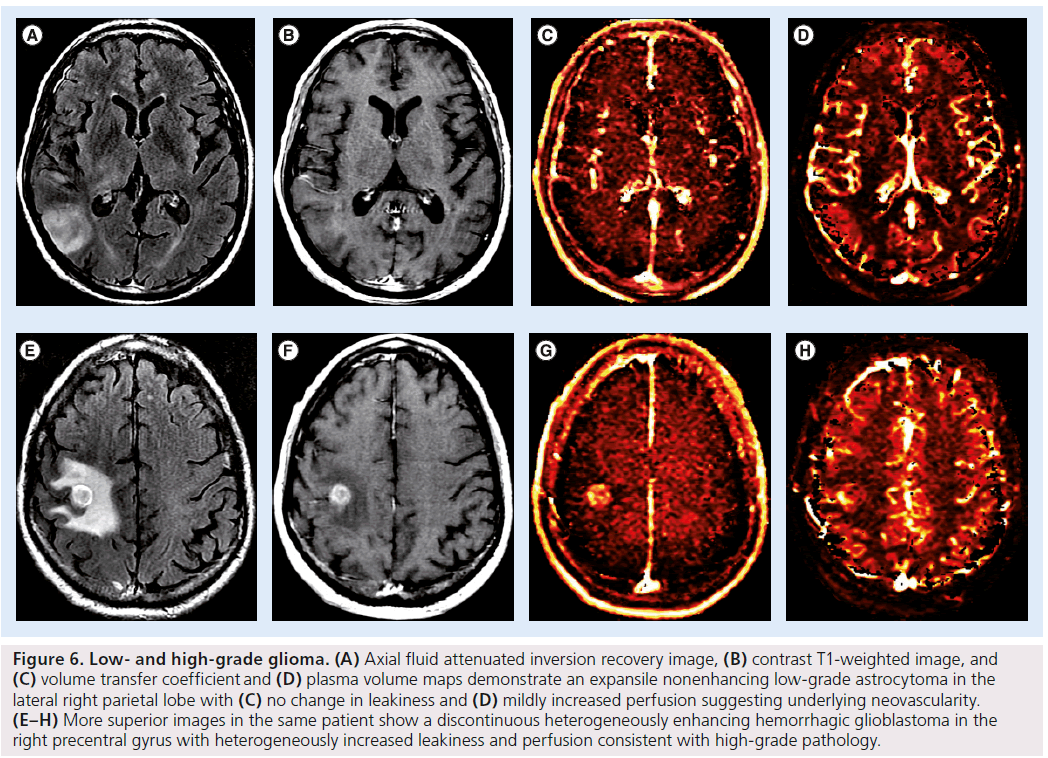
DCE perfusion offers estimations of Ktrans and capillary leakiness that reflect underlying tumor neoangiogenesis. Ktrans and plasma volume, which are both usually increased in high-grade gliomas, are considered independent metrics for patient prognosis. Nguyen et al. applied DCE perfusion to 46 patients with newly diagnosed gliomas using a phase-derived arterial input function and found that median plasma volume increased with glioma grade [82]. While early studies provided conflicting results [83,84], possibly owing to heterogeneity in choices of kinetic model, more recent data have suggested a strong correlation between Ktrans and glioma grade [85,86]. A 2012 study by Zhang et al., using the extended two compartment Tofts model, found Ktrans to be a statistically significant independent discriminator of low- and high-grade gliomas, with a sensitivity of 0.92 and a specificity of 0.85 [47]. Our preliminary results also suggest greater increases in Ktrans and plasma volume in high-grade gliomas than in low-grade gliomas (Figure 6).
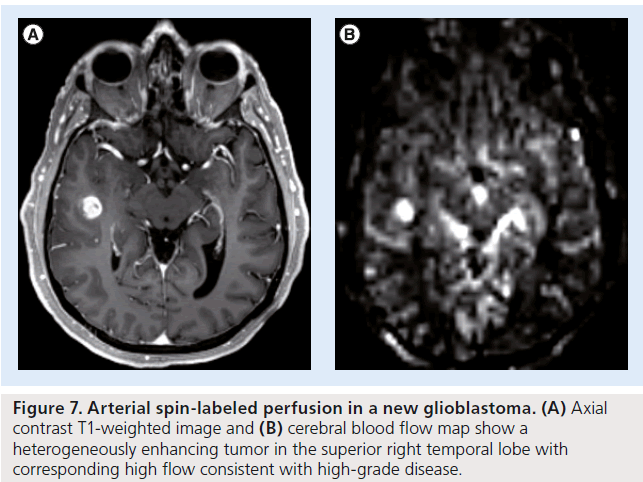
Studies of glioma grading using ASL perfusion have demonstrated an increased rCBF in gliomas of higher grade [87], and increased accuracy relative to conventional MRI in grading gliomas using ASL alone [88] and in combination with diffusion-weighted imaging ( Figure 7) [89]. Wolf et al. reported increased absolute blood flow in high-grade gliomas (94.9 ± 71.7 ml/100 g/min) compared with low-grade gliomas (42.8 ± 22.0 ml/100 g/min) [90]. All but one low-grade glioma demonstrated a maximum CBF ≤50 ml/100 g/min.
Predicting patient prognosis
Perfusion in individual tumors has been correlated with prognosis by a number of investigators, most of whom relied on DSC perfusion data [91–98]. While early studies reported variable results, recent work has led to the consensus that a greater rCBV within a tumor confers a worse prognosis. Law et al. reported a median length of progression free survival (PFS) of 3585 days for patients with tumors of rCBV less than 1.75 compared with median PFS of 265 days for patients with tumors of rCBV greater than 1.75 [96]. When oligodendrogliomas and oligoastrocytomas, lower grade tumors that tend to be hyperperfused, were excluded, Bisdas et al. found significant correlations between rCBV and both PFS and WHO grade [97]. In that study, a maximum tumor rCBV of less than 3.8 predicted 1-year survival with 94% sensitivity and 73% specificity. A more recent study found significant correlations between rCBV and both overall survival and microvascular surface area at pathology [98]. The utility of DCE and ASL perfusion in predicting prognosis has not yet been well established.
Figure 6.Low- and high-grade glioma. (A) Axial fluid attenuated inversion recovery image, (B) contrast T1-weighted image, and (C) volume transfer coefficient and (D) plasma volume maps demonstrate an expansile nonenhancing low-grade astrocytoma in the lateral right parietal lobe with (C) no change in leakiness and (D) mildly increased perfusion suggesting underlying neovascularity. (E–H) More superior images in the same patient show a discontinuous heterogeneously enhancing hemorrhagic glioblastoma in the right precentral gyrus with heterogeneously increased leakiness and perfusion consistent with high-grade pathology.
Recent molecular work has identified subtypes of tumors with particular genetic characteristics that have prognostic implications. For example, the 1p/19q chromosomal codeletion is a strong predictor of favorable treatment response in patients with oligodendroglioma [99]. Early efforts to correlate perfusion with tumor genetics are underway. Law et al. reported preliminary DSC perfusion results in a retrospective study of 16 oligodendroglioma patients [100]. Increased rCBV values correlated with the presence of the 1p/19q chromosomal codeletion. Other investigators have reported similar results [101]. Similarly, MGMT promoter methylation status predicts a stronger response to temozolomide chemotherapy in patients with glioblastoma [102]. The utility of perfusion imaging in identifying MGMT promoter subtypes is less well established. Gupta et al. compared DSC perfusion characteristics of gliomas in 31 tumors with 46 without MGMT promoter methylation and, finding no significant difference in perfusion between the two groups [103]. Similar results were reported by Moon et al. [104].
Selecting potential biopsy sites
Perfusion imaging is useful to identify region(s) of higher-grade pathology within an individual heterogeneous tumor. As glioma grade is determined by the most aggressive portion of the tumor, tissue sampling is ideally directed at the most malignant portion of the lesion. This becomes particularly important for tumors located in eloquent or deep brain areas that are not amenable to gross total resection. Contrast enhancement and conventional MRI are of limited value to guide tissue sampling [105–107]. A recent study by Weber et al. evaluated the utility of each of the three perfusion techniques in directing tissue sampling toward the most abnormal portions of the tumors that are likely to harbor areas of increased tumor cell proliferation and microvascularity [108]. In 61 glioma patients, they found that DCE and DSC perfusion had good (>50%), or perfect (100%), agreement in identifying tumor hot spots in all patients, respectively. When also including ASL perfusion, 18F-fluorothymidine PET and MRI spectroscopy imaging with DCE and DSC perfusion, they found good or perfect agreement in 80% of patients.
Figure 7.Arterial spin-labeled perfusion in a new glioblastoma. (A) Axial contrast T1-weighted image and (B) cerebral blood flow map show a heterogeneously enhancing tumor in the superior right temporal lobe with corresponding high flow consistent with high-grade disease.
Evaluating treated brain tumors
Standard therapy for a newly diagnosed glioblastoma consists of maximal safe surgical resection, radiation therapy and concurrent and then adjuvant chemotherapy with temozolomide [109]. Lower grade tumors usually undergo some combination of resection, chemotherapy and radiation. For patients with disease that recurs on adjuvant temozolomide, several novel agents have recently become available, most of which act as inhibitors of neoangiogenesis [110–113]. The availability of these second-line agents and the potential for salvage treatments in the form of clinical trials have magnified the importance of imaging to accurately characterize treatment response and failure.
Tumor progression
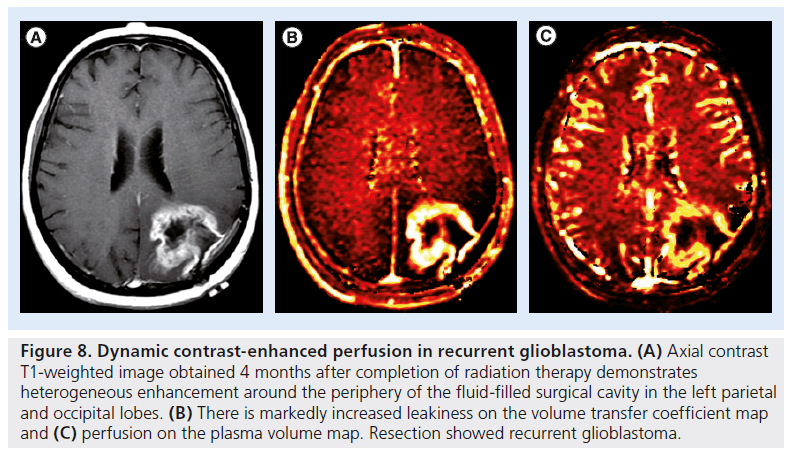
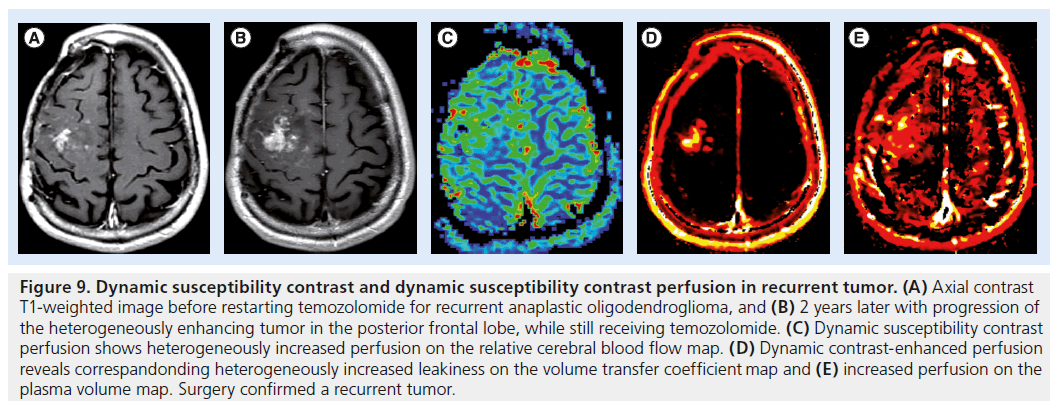
Traditionally, recurrent or progressive disease was diagnosed when imaging revealed an increase in size of the enhancing portion of a tumor or the development of a new foci of enhancement [114]. More recently, response criteria typically used in clinical trials have been expanded to address the problem of similarities in the conventional imaging appearance of recurrent tumor and certain post-therapeutic changes [115,116]. Despite the recent updates, response criteria do not incorporate MRI perfusion information to determine true progression [117,118]. This is despite growing evidence that perfusion imaging can be useful to predict recurrent or progressive tumor by complementing conventional imaging and guiding treatment decisions. A recurrent tumor usually demonstrates increased perfusion and increased capillary leakiness, which may in some cases precede the development of an enhancing tumor. These changes may be observed using DSC perfusion with increased rCBV and decreased PSR, and using DCE perfusion with increased plasma volume and increased Ktrans (Figures 8 & 9). Further discussion and direct comparison to radiation injury follows in the next section.
Radiation injury
Radiation therapy has an important role in prolonging the length of survival for many patients with both primary and secondary brain tumors. Treatment may consist of whole-brain radiation therapy (secondary tumors only), partialbrain radiation therapy (primary or secondary tumors) or stereotactic radiosurgery (usually secondary tumors only). Therefore, the term radiation injury is applicable to both secondary metastases from systemic cancers and primary brain tumors. Radiation injury can be classified as acute, early delayed or late delayed according to the time at which it manifests after completion of therapy [119–121]. Although many factors are involved, brain tolerance is related to the prescribed volume, total dose, fractionation and schedule of radiation therapy. Radiation injury has many synonyms including radiation necrosis, post-treatment effect and treatment-related change. Most of these are used interchangeably, although the term radiation ‘necrosis’ has traditionally been used to refer to late-delayed radiation injury with persistent enhancing mass lesions. By contrast, the term ‘pseudoprogression’ refers to a specific clinical form of early-delayed radiation injury in primary brain tumors only (usually glioblastomas). Despite differences in pathophysiology, MR perfusion imaging often shows a common theme with increased perfusion in viable tumor and decreased perfusion in injured or necrotic tissue.
Figure 8.Dynamic contrast-enhanced perfusion in recurrent glioblastoma. (A) Axial contrast T1-weighted image obtained 4 months after completion of radiation therapy demonstrates heterogeneous enhancement around the periphery of the fluid-filled surgical cavity in the left parietal and occipital lobes. (B) There is markedly increased leakiness on the volume transfer coefficient map and (C) perfusion on the plasma volume map. Resection showed recurrent glioblastoma.
Figure 9.Dynamic susceptibility contrast and dynamic susceptibility contrast perfusion in recurrent tumor. (A) Axial contrast T1-weighted image before restarting temozolomide for recurrent anaplastic oligodendroglioma, and (B) 2 years later with progression of the heterogeneously enhancing tumor in the posterior frontal lobe, while still receiving temozolomide. (C) Dynamic susceptibility contrast perfusion shows heterogeneously increased perfusion on the relative cerebral blood flow map. (D) Dynamic contrast-enhanced perfusion reveals correspandonding heterogeneously increased leakiness on the volume transfer coefficient map and (E) increased perfusion on the plasma volume map. Surgery confirmed a recurrent tumor.
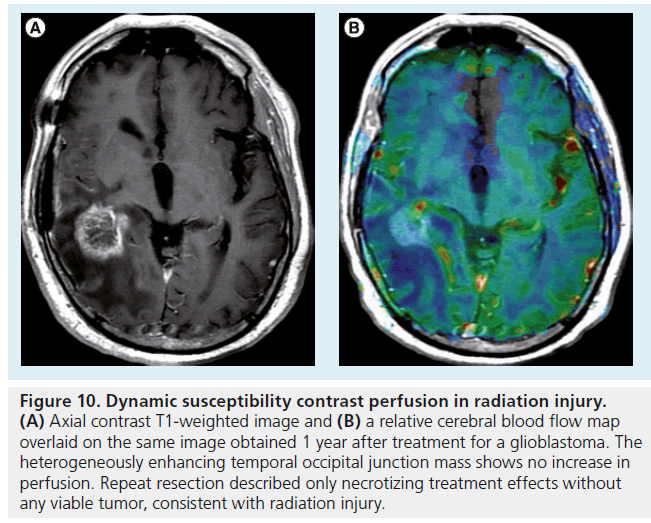
Several investigators have used DSC perfusion imaging to distinguish residual or recurrent metastatic disease from radiation necrosis. Barajas et al. investigated the relative peak height (rPH) and PSR at DSC perfusion in 27 patients with recurrent enhancing lesions following g knife radiosurgery [122]. Mean and maximum rPH values were significantly higher in the recurrent tumor group, while PSR was significantly lower in the recurrent tumor group. Mitsuya et al. studied DSC perfusionderived rCBV values in 28 enhancing lesions that recurred after linear accelerator or g knife radiosurgery [123]. Median ratio of rCBV to contralateral white matter was 3.5 for recurrent metastases and 1.0 for radiation effect (p < 0.0001) (Figure 10).
Studies separating recurrent tumor from radiation necrosis in cases of glioma have shown similar results. Barajas et al. reported rCBV, rPH and PSR at DSC perfusion in 57 glioma patients with recurrent enhancing lesions [124]. rPH and rCBV were significantly higher in recurrent glioblastoma than in radiation necrosis, whereas PSR was significantly lower. Larsen et al. applied DCE perfusion imaging to distinguish recurrent glioma from radiation necrosis in 19 patients, reporting that an absolute CBV threshold of 2.0 ml/100 g tissue detected tumor progression with 100% sensitivity and specificity [125]. Narang et al. reported success using a host of non-model-based DCE perfusion parameters to distinguish glioma from treatment effect [126]. Early studies of ASL perfusion suggest that it too is effective in distinguishing recurrent tumor from radiation necrosis [127].
Figure 10.Dynamic susceptibility contrast perfusion in radiation injury. (A) Axial contrast T1-weighted image and (B) a relative cerebral blood flow map overlaid on the same image obtained 1 year after treatment for a glioblastoma. The heterogeneously enhancing temporal occipital junction mass shows no increase in perfusion. Repeat resection described only necrotizing treatment effects without any viable tumor, consistent with radiation injury.
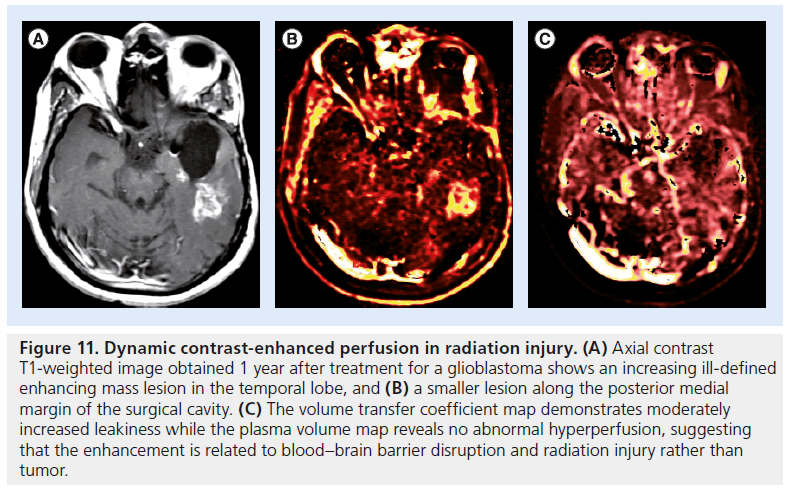
Figure 11.Dynamic contrast-enhanced perfusion in radiation injury. (A) Axial contrast T1-weighted image obtained 1 year after treatment for a glioblastoma shows an increasing ill-defined enhancing mass lesion in the temporal lobe, and (B) a smaller lesion along the posterior medial margin of the surgical cavity. (C) The volume transfer coefficient map demonstrates moderately increased leakiness while the plasma volume map reveals no abnormal hyperperfusion, suggesting that the enhancement is related to blood–brain barrier disruption and radiation injury rather than tumor
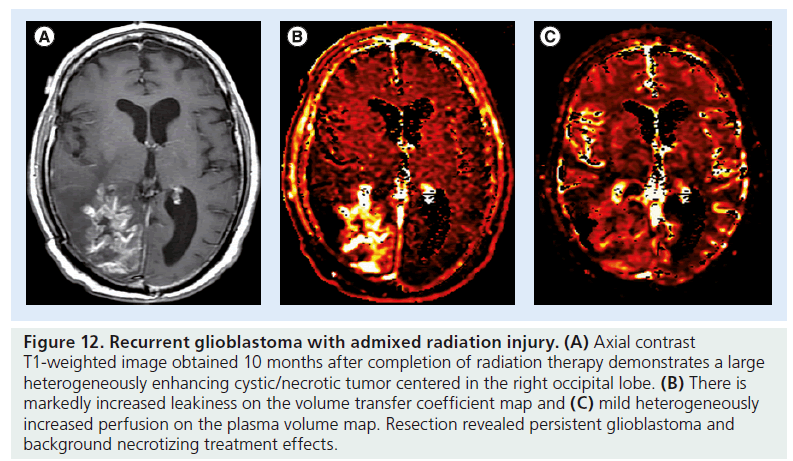
At our institution, DCE perfusion imaging is routinely performed before initiation of therapy and at follow-up of both metastatic and primary CNS tumors. Ktrans is often greater in recurrent tumor than in radiation injury, but is elevated in both cases. Plasma volume is often greater in recurrent tumor and normal or decreased in radiation necrosis. Therefore, recurrent tumors usually present with an increased Ktrans and increased plasma volume (Figure 11). Unlike DSC perfusion, optimal threshold values have not been suggested in the literature; interpretation may also be complicated when patients present with recurrent tumor admixed with treatment effects (Figure 12).
Pseudoprogression in high-grade gliomas
Recent changes in standard of care therapy for glioblastoma have led to the description of a distinct class of tissue injury observed after chemoradiation. Termed as pseudoprogression, it consists of radiographic worsening in the early-delayed radation time window (usually ≤3 months and up to 6 months following completion of radiation therapy) that spontaneously stabilizes or resolves over time [128,129]. Typically, the term pseudoprogression is reserved for cases of high-grade glioma treated with radiation and temozolomide, where the incidence is as high as 30% [130–133], although it has also been described with other chemotherapy agents. Interestingly, evidence suggests that development of pseudoprogression may be a good prognostic sign, considering that it represents desirable therapy-induced death of tumor cells [134,135]. This probably reflects the higher incidence of pseudoprogression in patients with a methylated or inactivated MGMT promoter, a suicide DNA repair enzyme. In 50 patients, Brandes et al. reported that pseudoprogression occurred in 91% of methylated versus 41% of unmethylated patients (p = 0002) [134].
Figure 12.Recurrent glioblastoma with admixed radiation injury. (A) Axial contrast T1-weighted image obtained 10 months after completion of radiation therapy demonstrates a large heterogeneously enhancing cystic/necrotic tumor centered in the right occipital lobe. (B) There is markedly increased leakiness on the volume transfer coefficient map and (C) mild heterogeneously increased perfusion on the plasma volume map. Resection revealed persistent glioblastoma and background necrotizing treatment effects.
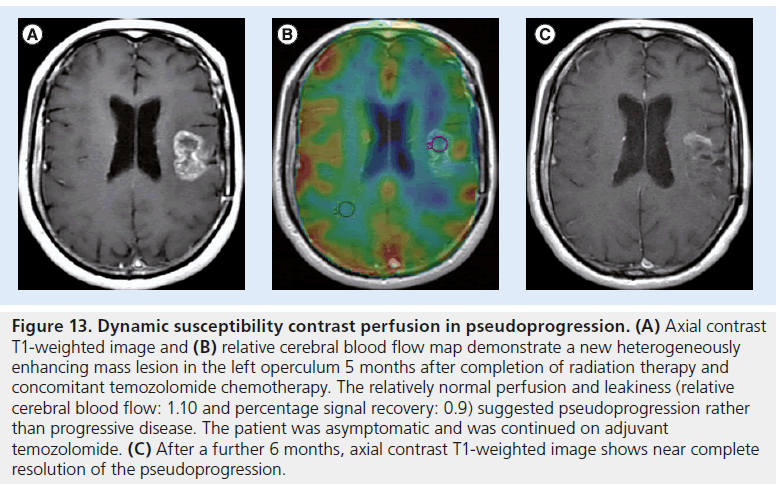
Figure 13.Dynamic susceptibility contrast perfusion in pseudoprogression. (A) Axial contrast T1-weighted image and (B) relative cerebral blood flow map demonstrate a new heterogeneously enhancing mass lesion in the left operculum 5 months after completion of radiation therapy and concomitant temozolomide chemotherapy. The relatively normal perfusion and leakiness (relative cerebral blood flow: 1.10 and percentage signal recovery: 0.9) suggested pseudoprogression rather than progressive disease. The patient was asymptomatic and was continued on adjuvant temozolomide. (C) After a further 6 months, axial contrast T1-weighted image shows near complete resolution of the pseudoprogression.
Differentiating pseudoprogression from true progression is vital in making an informed treatment decision for a patient with a new or enlarging enhancing lesion. Effective therapy in pseudoprogression should be continued and the patient spared unnecessary repeat surgery and/or secondline chemotherapy that may be more toxic. There are also implications for clinical trials, as erroneously enrolling a patient with pseudoprogression, whose enhancing lesion would have spontaneously stabilized or resolved, would result in a false-positive result for the drug under study. de Wit et al. have suggested that patients with suspected pseudoprogression should be ineligible for Phase II clinical trials for this reason [128]. On the other hand, delayed treatment for a patient with true progression may result in unacceptable neurological decline and/or premature death.
Early studies of DSC perfusion have demonstrated that perfusion is greater in recurrent tumor than in pseudoprogression [136–138]. Young et al. found a lower rCBV, lower rPH and higher PSR in pseudoprogression compared with recurrent tumor (p = 009, p < 001 and p = 039, respectively) (Figure 13) [139]. Gahramanov et al. also found that a lower rCBV was a useful predictor of pseudoprogression, although they used the iron oxide nanoparticle blood-pool agent ferumoxytol rather than the standard gadolinium-based contrast agent [140]. Although not widely available, iron oxide nanoparticle agents may provide superior perfusion results due to their relative insensitivity to BBB disruptions, which obviate any corrections for potential contrast agent leakage [26]. Iron oxide agents lack renal excretion and are, therefore, a viable alternative contrast agent in patients with renal failure or at risk for nephrogenic systemic fibrosis. DCE and ASL perfusion results specifically for pseudoprogression have not yet been reported.
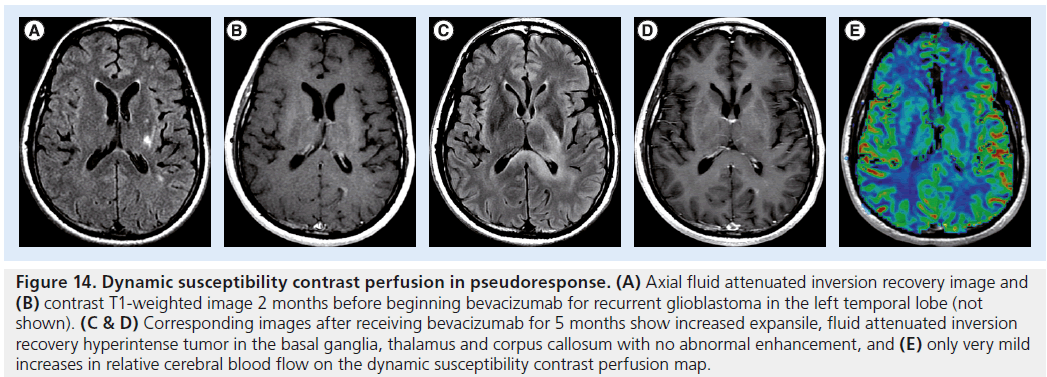
Figure 14.Dynamic susceptibility contrast perfusion in pseudoresponse. (A) Axial fluid attenuated inversion recovery image and (B) contrast T1-weighted image 2 months before beginning bevacizumab for recurrent glioblastoma in the left temporal lobe (not shown). (C & D) Corresponding images after receiving bevacizumab for 5 months show increased expansile, fluid attenuated inversion recovery hyperintense tumor in the basal ganglia, thalamus and corpus callosum with no abnormal enhancement, and (E) only very mild increases in relative cerebral blood flow on the dynamic susceptibility contrast perfusion map
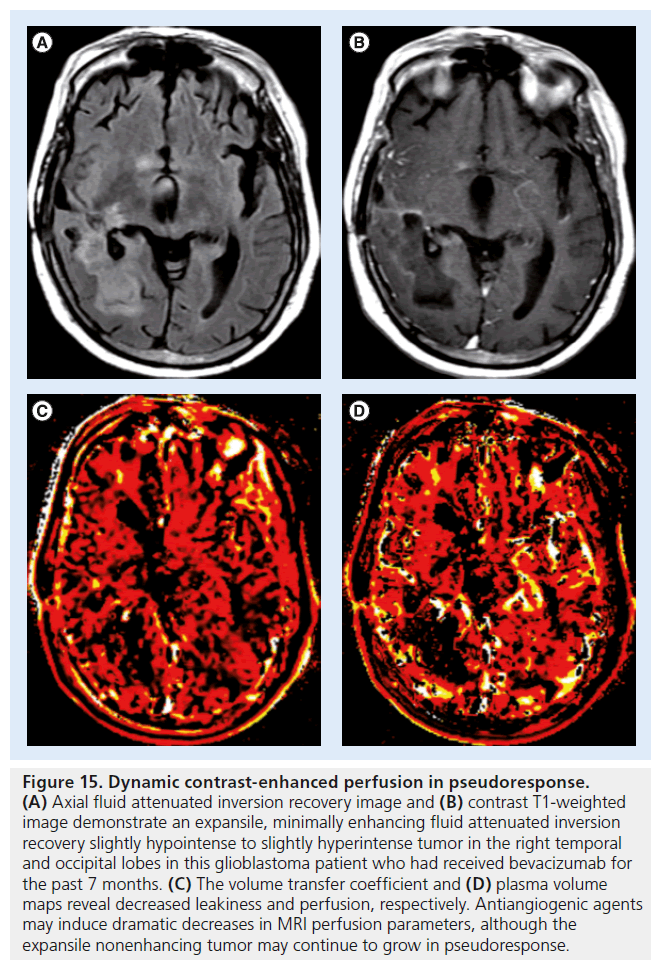
Figure 15.Dynamic contrast-enhanced perfusion in pseudoresponse. (A) Axial fluid attenuated inversion recovery image and (B) contrast T1-weighted image demonstrate an expansile, minimally enhancing fluid attenuated inversion recovery slightly hypointense to slightly hyperintense tumor in the right temporal and occipital lobes in this glioblastoma patient who had received bevacizumab for the past 7 months. (C) The volume transfer coefficient and (D) plasma volume maps reveal decreased leakiness and perfusion, respectively. Antiangiogenic agents may induce dramatic decreases in MRI perfusion parameters, although the expansile nonenhancing tumor may continue to grow in pseudoresponse.
Pseudoresponse in high-grade gliomas
Recently, several new drugs have been brought to market to target the neovascularization cascade involved in tumor growth. The two best studied agents are bevacizumab (Avastin®, Genentech, CA, USA), a monoclonal VEGF antibody, and cediranib (AZD2171), a VEGF inhibitor. Bevacizumab was recently approved by the FDA for the treatment of recurrent glioblastoma [141]. Although the antiangiogenic effects of these agents are rapidly evident [119,120] with diminution of enhancement at conventional MRI within hours [142,143], the overall survival benefit has been modest [144]. Some patients will show expansion of the infiltrative, nonenhancing tumor, which often demonstrates intermediate-to-low T2 signal and mildly restricted diffusion [145,146]. This decrease in enhancing tumor and increase in expansile nonenhancing tumor has been termed pseudoresponse. Only applicable in high-grade gliomas, this decrease in enhancing tumor would often result in classification as partial or complete response using the standard McDonald response criteria [114]. The updated response assessment in neuro-oncology criteria allow increased nonenhancing disease as a criterion for progression, but offer relatively vague guidelines for quantifying such signal changes [115,116].
Despite the increased nonenhancing disease, the lack of enhancing disease to corroborate progression can be confusing. Experience with perfusion imaging in the setting of pseudoresponse is limited. Early studies suggest that a lower rCBV predicts longer PFS in patients treated with cediranib [147,148]. At our institution, where patients receiving bevacizumab therapy are routinely followed with DSC and/or DCE perfusion imaging, we have observed that, typically, rCBV (DSC), Ktrans and plasma volume (DCE) are decreased, normal or minimally increased in patients with pseudoresponse (Figures 14 & 15). These results contrast with usual progression patterns where both perfusion and capillary leakiness metrics are markedly increased, limiting the clinical utility of perfusion imaging in these patients. Fellah et al. reported a single patient with recurrent glioblastoma receiving bevacizumab where DSC and ASL perfusion showed increasing perfusion metrics prior to increased enhancing tumor, suggesting that there is a useful role for perfusion imaging in a subset of patients receiving antiangiogenic therapy [149]. Imaging of pseudoresponse will probably continue to be an area of active research as imaging techniques are refined and new chemotherapeutics are developed.
Conclusion
Perfusion MRI is a convenient, noninvasive means of obtaining functional information about the hemodynamic state of a tissue of interest. This is of particular use in brain tumor imaging where more aggressive lesions typically display greater vascularity. Of the three main MR perfusion techniques, DSC perfusion is the most widely available and best studied. DCE perfusion offers greater spatial resolution and additional information about capillary leakiness, but data analysis is more complicated and the literature is less mature. ASL perfusion is most forgiving technically, as it does not require gadolinium administration; however, it suffers from poor availability, low spatial resolution and low signal-to-noise ratio.
While MRI perfusion techniques have been shown to be of value in tumor imaging and have proven to be useful in daily practice, guidelines for data acquisition, postprocessing and interpretation have not been standardized. This has slowed the more widespread adoption into clinical practice and delayed the incorporation of perfusion metrics into standardized response criteria. Further study in the optimal acquisition parameters is necessary to enable multiinstitutional pooling of data. These parameters should be feasible in any busy clinical setting and not simply reflect ideal parameters used in research settings. In addition, further advances in the mathematical modeling of intravenous contrast and exchanges between intravascular and extravascular extracellular spaces in normal and leaky pathological states could help improve the accuracy of imaging- based measurements.
Future perspective
In the next 5–10 years, MRI perfusion techniques will probably become more widely available and better studied, increasing their stature as vital clinical and research tools that enable reliable predictions about clinical outcome. Further advancements in perfusion software will lead to automated or semiautomated analyses of MRI perfusion data, removing many of the operator and site-specific variabilites that hinder contemporary comparisons. Future advancements will be facilitated by newer perfusion techniques, such as steady-state imaging, and newer intravenous contrast and molecular agents. These will be enabled by the widespread adoption of hybrid PET/MR imaging systems, just as 3T scanners have become as common as 1.5 T scanners today. These PET/MR systems will enable multiparametric functional, anatomical and molecular imaging with unparalleled tissue contrast and concordance between different imaging techniques. As an established technology with decades of data available, MRI perfusion will become a standard tool against which newer imaging techniques are evaluated.

Financial & competing interests disclosure
The authors have no relevant affiliations or financial involvement with any organization or entity with a financial interest in or financial conflict with the subject matter or materials discussed in the manuscript. This includes employment, consultancies, honoraria, stock ownership or options, expert testimony, grants or patents received or pending, or royalties.
No writing assistance was utilized in the production of this manuscript.
References
Papers of special note have been highlighted as:
* of interest
- Cha S, Johnson G, Wadghiri YZ et al. Dynamic, contrast-enhanced perfusion MRI in mouse gliomas: correlation with histopathology. Magn. Reson. Med. 49(5), 848–855 (2003).
- Noguchi T, Yoshiura T, Hiwatashi A et al. Perfusion imaging of brain tumors using arterial spin-labeling: correlation with histopathologic vascular density. AJNR Am. J. Neuroradiol. 29(4), 688–693 (2008).
- Hu LS, Baxter LC, Smith KA et al. Relative cerebral blood volume values to differentiate high-grade glioma recurrence from posttreatment radiation effect: direct correlation between image-guided tissue histopathology and localized dynamic susceptibility-weighted contrast-enhanced perfusion MR imaging measurements. AJNR Am. J. Neuroradiol. 30(3), 552–558 (2009). & Addresses some of the controversies involved in leakage correction for dynamic susceptibility contrast perfusion.
- Barajas RF Jr, Phillips JJ, Parvataneni R et al. Regional variation in histopathologic features of tumor specimens from treatment-naive glioblastoma correlates with anatomic and physiologic MR imaging. Neuro. Oncol. 14(7), 942–954 (2012).
- Essock-Burns E, Phillips JJ, Molinaro AM et al. Comparison of DSC-MRI post-processing techniques in predicting microvascular histopathology in patients newly diagnosed with GBM. J. Magn. Reson. Imaging 38(2), 388–400 (2013).
- Lacerda S, Shiroishi MS, Law M. Clinical applications of dynamic contrast-enhanced (DCE) permeability imaging. In: Functional Neuroradiology: Principles and Clinical Applications. Faro SH, Mohamed FB, Law M, Ulmer JT (Eds). Springer, London, UK, 117–137 (2011).
- Bruening R, Kwong KK, Vevea MJ et al. Echo-planar MR determination of relative cerebral blood volume in human brain tumors: T1 versus T2 weighting. AJNR Am. J. Neuroradiol. 17(5), 831–840 (1996).
- Aksoy FG, Lev MH. Dynamic contrastenhanced brain perfusion imaging: technique and clinical applications. Semin. Ultrasound CT MR 21(6), 462–477 (2000).
- Provenzale JM, Wang GR, Brenner T, Petrella JR, Sorensen AG. Comparison of permeability in high-grade and low-grade brain tumors using dynamic susceptibility contrast MR imaging. AJNR Am. J. Neuroradiol. 178(3), 711–716 (2002).
- Boxerman JL, Hamberg LM, Rosen BR, Weisskoff RM. MR contrast due to intravascular magnetic susceptibility perturbations. Magn. Reson. Med. 34(4), 555–566 (1995).
- Kiselev VG. On the theoretical basis of perfusion measurements by dynamic susceptibility contrast MRI. Magn. Reson. Med. 46(6), 1113–1122 (2001).
- Weisskoff RM, Zuo CS, Boxerman JL, Rosen BR. Microscopic susceptibility variation and transverse relaxation: theory and experiment. Magn. Reson. Med. 31(6), 601–610 (1994).
- Chavhan GB, Babyn PS, Thomas B, Shroff MM, Haacke EM. Principles, techniques, and applications of T2*-based MR imaging and its special applications. Radiographics 29(5), 1433–1449 (2009).
- Schmiedeskamp H, Straka M, Newbould RD et al. Combined spin- and gradient-echo perfusion-weighted imaging. Magn. Reson. Med. 68(1), 30–40 (2012).
- van Osch MJ, Vonken EJ, Viergever MA, van der Grond J, Bakker CJ. Measuring the arterial input function with gradient echo sequences. Magn. Reson. Med. 49(6), 1067–1076 (2003).
- Zaro-Weber O, Moeller-Hartmann W, Heiss WD, Sobesky J. Influence of the arterial input function on absolute and relative perfusion-weighted imaging penumbral flow detection: a validation with 15O-water positron emission tomography. Stroke 43(2), 378–385 (2012).
- Christensen S, Mouridsen K, Wu O et al. Comparison of 10 perfusion MRI parameters in 97 sub-6-hour stroke patients using voxel-based receiver operating characteristics analysis. Stroke 40(6), 2055–2061 (2009).
- Law M, Young R, Babb J et al. Comparing perfusion metrics obtained from a single compartment versus pharmacokinetic modeling methods using dynamic susceptibility contrast-enhanced perfusion MR imaging with glioma grade. AJNR Am. J. Neuroradiol. 27(9), 1975–1982 (2006). n Excellent discussion of dynamic susceptibility contrast modeling techniques.
- Boxerman JL, Schmainda KM, Weisskoff RM. Relative cerebral blood volume maps corrected for contrast agent extravasation significantly correlate with glioma tumor grade, whereas uncorrected maps do not. AJNR Am. J. Neuroradiol. 27(4), 859–867 (2006).
- Bjornerud A, Sorensen AG, Mouridsen K, Emblem KE. T1- and T2*-dominant extravasation correction in DSC-MRI: part I – theoretical considerations and implications for assessment of tumor hemodynamic properties. J. Cereb. Blood Flow Metab. 31(10), 2041–2053 (2011).
- Hu LS, Baxter LC, Pinnaduwage DS et al. Optimized preload leakage-correction methods to improve the diagnostic accuracy of dynamic susceptibility-weighted contrast-enhanced perfusion MR imaging in posttreatment gliomas. AJNR Am. J. Neuroradiol. 31(1), 40–48 (2010).
- Boxerman JL, Prah DE, Paulson ES, Machan JT, Bedekar D, Schmainda KM. The role of preload and leakage correction in gadolinium-based cerebral blood volume estimation determined by comparison with MION as a criterion standard. AJNR Am. J. Neuroradiol. 33(6), 1081–1087 (2012).
- Heiland S, Benner T, Debus J, Rempp K, Reith W, Sartor K. Simultaneous assessment of cerebral hemodynamics and contrast agent uptake in lesions with disrupted blood–brainbarrier. Magn. Reson. Imaging 17(1), 21–27 (1999).
- Lee MC, Cha S, Chang SM, Nelson SJ. Dynamic susceptibility contrast perfusion imaging of radiation effects in normal-appearing brain tissue: changes in the first-pass and recirculation phases. J. Magn. Reson. Imaging 21(6), 683–693 (2005).
- Patil V, Johnson G. An improved model for describing the contrast bolus in perfusion MRI. Medical Physics 38(12), 6380–6383 (2011).
- Gahramanov S, Muldoon LL, Varallyay CG et al. Pseudoprogression of glioblastoma after chemo- and radiation therapy: diagnosis by using dynamic susceptibility-weighted contrast-enhanced perfusion MR imaging with ferumoxytol versus gadoteridol and correlation with survival. Radiology 266(3), 842–852 (2013).
- Evelhoch JL. Key factors in the acquisition of contrast kinetic data for oncology. J. Magn. Reson. Imaging 10(3), 254–259 (1999).
- Sourbron S, Ingrisch M, Siefert A, Reiser M, Herrmann K. Quantification of cerebral blood flow, cerebral blood volume, and blood–brain-barrier leakage with DCE-MRI. Magn. Reson. Med. 62(1), 205–217 (2009).
- Koh TS, Bisdas S, Koh DM, Thng CH. Fundamentals of tracer kinetics for dynamic contrast-enhanced MRI. J. Magn. Reson. Imaging 34(6), 1262–1276 (2011).
- Tofts PS. Modeling tracer kinetics in dynamic Gd-DTPA MR imaging. J. Magn. Reson. Imaging 7(1), 91–101 (1997). n Classic paper describing popular modeling techniques that are still used today.
- Larsson HB, Courivaud F, Rostrup E, Hansen AE. Measurement of brain perfusion, blood volume, and blood–brain barrier permeability, using dynamic contrast-enhanced T(1)-weighted MRI at 3 tesla. Magn. Reson. Med. 62(5), 1270–1281 (2009).
- Zaharchuk G. Theoretical basis of hemodynamic MR imaging techniques to measure cerebral blood volume, cerebral blood flow, and permeability. AJNR Am. J. Neuroradiol. 28(10), 1850–1858 (2007).
- Silva AC, Williams DS, Koretsky AP. Evidence for the exchange of arterial spin-labeled water with tissue water in rat brain from diffusion-sensitized measurements of perfusion. Magn. Reson. Med. 38(2), 232–237 (1997).
- Kwong KK, Chesler DA, Weisskoff RM et al. MR perfusion studies with T1-weighted echo planar imaging. Magn. Reson. Med. 34(6), 878–887 (1995).
- Detre JA, Zhang W, Roberts DA et al. Tissue specific perfusion imaging using arterial spin labeling. NMR Biomed. 7(1–2), 75–82 (1994).
- Henkelman RM, Huang X, Xiang QS, Stanisz GJ, Swanson SD, Bronskill MJ. Quantitative interpretation of magnetization transfer. Magn. Reson. Med. 29(6), 759–766 (1993).
- Golay X, Hendrikse J, Lim TC. Perfusion imaging using arterial spin labeling. Top. Magn. Reson. Imaging 15(1), 10–27 (2004).
- Wong EC, Buxton RB, Frank LR. Quantitative imaging of perfusion using a single subtraction (QUIPSS and QUIPSS II). Magn. Reson. Med. 39(5), 702–708 (1998).
- Gevers S, Van Osch MJ, Bokkers RP et al. Intra- and multicenter reproducibility of pulsed, continuous and pseudo-continuous arterial spin labeling methods for measuring cerebral perfusion. J. Cereb. Blood Flow Metab. 31(8), 1706–1715 (2011).
- Chen Y, Wang DJ, Detre JA. Test–retest reliability of arterial spin labeling with common labeling strategies. J. Magn. Reson. Imaging 33(4), 940–949 (2011).
- Nezamzadeh M, Matson GB, Young K, Weiner MW, Schuff N. Improved pseudo-continuous arterial spin labeling for mapping brain perfusion. J. Magn. Reson. Imaging 31(6), 1419–1427 (2010).
- Buxton RB, Frank LR, Wong EC, Siewert B, Warach S, Edelman RR. A general kinetic model for quantitative perfusion imaging with arterial spin labeling. Magn. Reson. Med. 40(3), 383–396 (1998).
- Zhou J, Wilson DA, Ulatowski JA, Traystman RJ, van Zijl PC. Two-compartment exchange model for perfusion quantification using arterial spin tagging. J. Cereb. Blood Flow Metab. 21(4), 440–455 (2001).
- St Lawrence KS, Frank JA, McLaughlin AC. Effect of restricted water exchange on cerebral blood flow values calculated with arterial spin tagging: a theoretical investigation. Magn. Reson. Med. 44(3), 440–449 (2000).
- Hirai T, Kitajima M, Nakamura H et al. Quantitative blood flow measurements in gliomas using arterial spin-labeling at 3T: intermodality agreement and inter- and intraobserver reproducibility study. AJNR Am. J. Neuroradiol. 32(11), 2073–2079 (2011).
- Wolf RL. Clinical applications of mr perfusion imaging. In: Functional Neuroradiology: Principles and Clinical Applications. Faro SH, Mohamed FB, Law M, Ulmer JT (Eds). Springer, London, UK, 71–105 (2011).
- Zhang N, Zhang L, Qiu B, Meng L, Wang X, Hou BL. Correlation of volume transfer coefficient Ktrans with histopathologic grades of gliomas. J. Magn. Reson. Imaging 36(2), 355–363 (2012).
- White CM, Pope WB, Zaw T et al. Regional and voxel-wise comparisons of blood flow measurements between dynamic susceptibility contrast magnetic resonance imaging (DSC-MRI) and arterial spin labeling (ASL) in brain tumors. J Neuroimaging, doi:10.1111/ j.1552-6569.2012.00703.x (2012) (Epub ahead of print).
- Christen T, Ni W, Qiu D et al. High-resolution cerebral blood volume imaging in humans using the blood pool contrast agent ferumoxytol. Magn. Reson. Med. doi:10.1002/ mrm.24500 (2012) (Epub ahead of print).
- Varallyay CG, Nesbit E, Fu R et al. High-resolution steady-state cerebral blood volume maps in patients with central nervous system neoplasms using ferumoxytol, a superparamagnetic iron oxide nanoparticle. J. Cereb. Blood Flow Metab. 33(5), 780–786 (2013).
- Chan JH, Tsui EY, Chau LF et al. Discrimination of an infected brain tumor from a cerebral abscess by combined MR perfusion and diffusion imaging. Comput. Med. Imaging Graph. 26(1), 19–23 (2002).
- Erdogan C, Hakyemez B, Yildirim N, Parlak M. Brain abscess and cystic brain tumor: discrimination with dynamic susceptibility contrast perfusion-weighted MRI. J. Comput. Assist. Tomogr. 29(5), 663–667 (2005).
- Ge Y, Law M, Johnson G et al. Dynamic susceptibility contrast perfusion MR imaging of multiple sclerosis lesions: characterizing hemodynamic impairment and inflammatory activity. AJNR Am. J. Neuroradiol. 26(6), 1539–1547 (2005).
- Wen PY, Kesari S. Malignant gliomas in adults. N. Engl. J. Med. 359(5), 492–507 (2008).
- Russell D, Rubinstein L. Tumors of central neuroepithelial origin. In: Pathology of Tumours of the Central Nervous System. Russell D, Rubinstein L (Eds). Williams & Wilkins, MD, USA, 307–571 (1989).
- Brem S, Cotran R, Folkman J. Tumor angiogenesis: a quantitative method for histologic grading. J. Natl Cancer Inst. 48(2), 347–356 (1972).
- Atlas SW. Intraaxial brain tumors. In: Magnetic Resonance Imaging of the brain and spine. Atlas SW (Ed.). Lippincott Williams & Wilkins, PA, USA, 677–685 (2002).
- Maluf FC, Deangelis LM, Raizer JJ, Abrey LE. High-grade gliomas in patients with prior systemic malignancies. Cancer 94(12), 3219–3224 (2002).
- Young GS, Setayesh K. Spin-echo echo-planar perfusion MR imaging in the differential diagnosis of solitary enhancing brain lesions: distinguishing solitary metastases from primary glioma. AJNR Am. J. Neuroradiol. 30(3), 575–577 (2009).
- Ludemann L, Grieger W, Wurm R, Wust P, Zimmer C. Quantitative measurement of leakage volume and permeability in gliomas, meningiomas and brain metastases with dynamic contrast-enhanced MRI. Magn. Reson. Imaging 23(8), 833–841 (2005).
- Lehmann P, Monet P, De Marco G et al. A comparative study of perfusion measurement in brain tumours at 3 Tesla MR: arterial spin labeling versus dynamic susceptibility contrast-enhanced MRI. Eur. Neurol. 64(1), 21–26 (2010).
- Yamashita K, Yoshiura T, Hiwatashi A et al. Arterial spin labeling of hemangioblastoma: differentiation from metastatic brain tumors based on quantitative blood flow measurement. Neuroradiology 54(8), 809–813 (2012).
- Server A, Orheim TE, Graff BA, Josefsen R, Kumar T, Nakstad PH. Diagnostic examination performance by using microvascular leakage, cerebral blood volume, and blood flow derived from 3-T dynamic susceptibility-weighted contrast-enhanced perfusion MR imaging in the differentiation of glioblastoma multiforme and brain metastasis. Neuroradiology 53(5), 319–330 (2011).
- Cha S, Lupo JM, Chen MH et al. Differentiation of glioblastoma multiforme and single brain metastasis by peak height and percentage of signal intensity recovery derived from dynamic susceptibility-weighted contrast-enhanced perfusion MR imaging. AJNR Am. J. Neuroradiol. 28(6), 1078–1084 (2007).
- Law M, Cha S, Knopp EA, Johnson G, Arnett J, Litt AW. High-grade gliomas and solitary metastases: differentiation by using perfusion and proton spectroscopic MR imaging. Radiology 222(3), 715–721 (2002).
- Hartmann M, Heiland S, Harting I et al. Distinguishing of primary cerebral lymphoma from high-grade glioma with perfusion-weighted magnetic resonance imaging. Neurosci. Lett. 338(2), 119–122 (2003).
- Haque S, Law M, Abrey LE, Young RJ. Imaging of lymphoma of the central nervous system, spine, and orbit. Radiol. Clin. North Am. 46(2), 339–361, ix (2008).
- Toh CH, Wei KC, Chang CN, Ng SH, Wong HF. Differentiation of primary central nervous system lymphomas and glioblastomas: comparisons of diagnostic performance of dynamic susceptibility contrast-enhanced perfusion MR imaging without and with contrast-leakage correction. AJNR Am. J. Neuroradiol. 34(6), 1145–1149 (2013).
- Yoo RE, Choi SH, Cho HR et al. Tumor blood flow from arterial spin labeling perfusion MRI: a key parameter in distinguishing high-grade gliomas from primary cerebral lymphomas, and in predicting genetic biomarkers in high-grade gliomas. J. Magn. Reson. Imaging doi:10.1002/ jmri.24026 (2013) (Epub ahead of print).
- Yamashita K, Yoshiura T, Hiwatashi A et al. Differentiating primary CNS lymphoma from glioblastoma multiforme: assessment using arterial spin labeling, diffusion-weighted imaging, and (1)(8)F-fluorodeoxyglucose positron emission tomography. Neuroradiology 55(2), 135–143 (2013).
- Weber MA, Zoubaa S, Schlieter M et al. Diagnostic performance of spectroscopic and perfusion MRI for distinction of brain tumors. Neurology 66(12), 1899–1906 (2006).
- Cheng SY, Huang HJ, Nagane M et al. Suppression of glioblastoma angiogenicity and tumorigenicity by inhibition of endogenous expression of vascular endothelial growth factor. Proc. Natl Acad. Sci. USA 93(16), 8502–8507 (1996).
- Padhani AR, Husband JE. Dynamic contrastenhanced MRI studies in oncology with an emphasis on quantification, validation and human studies. Clin. Radiol. 56(8), 607–620 (2001).
- Whitmore RG, Krejza J, Kapoor GS et al. Prediction of oligodendroglial tumor subtype and grade using perfusion weighted magnetic resonance imaging. J. Neurosurg. 107(3), 600–609 (2007).
- Law M, Meltzer DE, Wetzel SG et al. Conventional MR imaging with simultaneous measurements of cerebral blood volume and vascular permeability in ganglioglioma. Magn. Reson. Imaging 22(5), 599–606 (2004).
- Maeda M, Itoh S, Kimura H et al. Tumor vascularity in the brain: evaluation with dynamic susceptibility-contrast MR imaging. Radiology 189(1), 233–238 (1993).
- Aronen HJ, Gazit IE, Louis DN et al. Cerebral blood volume maps of gliomas: comparison with tumor grade and histologic findings. Radiology 191(1), 41–51 (1994).
- Knopp EA, Cha S, Johnson G et al. Glial neoplasms: dynamic contrast-enhanced T2*-weighted MR imaging. Radiology 211(3), 791–798 (1999).
- Cha S, Knopp EA, Johnson G, Wetzel SG, Litt AW, Zagzag D. Intracranial mass lesions: dynamic contrast-enhanced susceptibilityweighted echo-planar perfusion MR imaging. Radiology 223(1), 11–29 (2002).
- Saitta L, Heese O, Forster AF et al. Signal intensity in T2’ magnetic resonance imaging is related to brain glioma grade. Eur. Radiol. 21(5), 1068–1076 (2011).
- Young R, Babb J, Law M, Pollack E, Johnson G. Comparison of region-of-interest analysis with three different histogram analysis methods in the determination of perfusion metrics in patients with brain gliomas. J. Magn. Reson. Imaging 26(4), 1053–1063 (2007).
- Nguyen TB, Cron GO, Mercier JF et al. Diagnostic accuracy of dynamic contrastenhanced MR imaging using a phase-derived vascular input function in the preoperative grading of gliomas. AJNR Am. J. Neuroradiol. 33(8), 1539–1545 (2012).
- Ludemann L, Hamm B, Zimmer C. Pharmacokinetic analysis of glioma compartments with dynamic Gd-DTPAenhanced magnetic resonance imaging. Magn. Reson. Imaging 18(10), 1201–1214 (2000).
- Ludemann L, Grieger W, Wurm R, Budzisch M, Hamm B, Zimmer C. Comparison of dynamic contrast-enhanced MRI with WHO tumor grading for gliomas. Eur. Radiol. 11(7), 1231–1241 (2001).
- Patankar TF, Haroon HA, Mills SJ et al. Is volume transfer coefficient (Ktrans) related to histologic grade in human gliomas? AJNR Am. J. Neuroradiol. 26(10), 2455–2465 (2005).
- Cha S, Yang L, Johnson G et al. Comparison of microvascular permeability measurements, Ktrans, determined with conventional steady-state T1-weighted and first-pass T2*-weighted MR imaging methods in gliomas and meningiomas. AJNR Am. J. Neuroradiol. 27(2), 409–417 (2006).
- Canale S, Rodrigo S, Tourdias T et al. [Grading of adults primitive glial neoplasms using arterial spin-labeled perfusion MR imaging]. J. Neuroradiol. 38(4), 207–213 (2011). n Discusses using arterial spin labeling in glioma grading.
- Kim MJ, Kim HS, Kim JH, Cho KG, Kim SY. Diagnostic accuracy and interobserver variability of pulsed arterial spin labeling for glioma grading. Acta Radiol. 49(4), 450–457 (2008).
- Kim HS, Kim SY. A prospective study on the added value of pulsed arterial spin-labeling and apparent diffusion coefficients in the grading of gliomas. AJNR Am. J. Neuroradiol. 28(9), 1693–1699 (2007).
- Wolf RL, Wang J, Wang S et al. Grading of CNS neoplasms using continuous arterial spin labeled perfusion MR imaging at 3 Tesla. J. Magn. Reson. Imaging 22(4), 475–482 (2005).
- Lev MH, Ozsunar Y, Henson JW et al. Glial tumor grading and outcome prediction using dynamic spin-echo MR susceptibility mapping compared with conventional contrast-enhanced MR: confounding effect of elevated rCBV of oligodendrogliomas [corrected]. AJNR Am. J. Neuroradiol. 25(2), 214–221 (2004).
- Cao Y, Tsien CI, Nagesh V et al. Survival prediction in high-grade gliomas by MRI perfusion before and during early stage of RT [corrected]. Int. J. Radiat. Oncol. Biol. Phys. 64(3), 876–885 (2006).
- Law M, Oh S, Babb JS et al. Low-grade gliomas: dynamic susceptibility-weighted contrast-enhanced perfusion MR imaging – prediction of patient clinical response. Radiology 238(2), 658–667 (2006).
- Law M, Oh S, Johnson G et al. Perfusion magnetic resonance imaging predicts patient outcome as an adjunct to histopathology: a second reference standard in the surgical and nonsurgical treatment of low-grade gliomas. Neurosurgery 58(6), 1099–1107; discussion 1099–1107 (2006).
- Hirai T, Murakami R, Nakamura H et al. Prognostic value of perfusion MR imaging of high-grade astrocytomas: long-term follow-up study. AJNR Am. J. Neuroradiol. 29(8), 1505–1510 (2008).
- Law M, Young RJ, Babb JS et al. Gliomas: predicting time to progression or survival with cerebral blood volume measurements at dynamic susceptibility-weighted contrastenhanced perfusion MR imaging. Radiology 247(2), 490–498 (2008).
- Bisdas S, Kirkpatrick M, Giglio P, Welsh C, Spampinato MV, Rumboldt Z. Cerebral blood volume measurements by perfusionweighted MR imaging in gliomas: ready for prime time in predicting short-term outcome and recurrent disease? AJNR Am. J. Neuroradiol. 30(4), 681–688 (2009).
- Hu LS, Eschbacher JM, Dueck AC et al. Correlations between perfusion MR imaging cerebral blood volume, microvessel quantification, and clinical outcome using stereotactic analysis in recurrent high-grade glioma. AJNR Am. J. Neuroradiol. 33(1), 69–76 (2012).
- Ducray F, Idbaih A, Wang XW, Cheneau C, Labussiere M, Sanson M. Predictive and prognostic factors for gliomas. Expert Rev. Anticancer Ther. 11(5), 781–789 (2011).
- Law M, Brodsky JE, Babb J et al. High cerebral blood volume in human gliomas predicts deletion of chromosome 1p: preliminary results of molecular studies in gliomas with elevated perfusion. J. Magn. Reson. Imaging 25(6), 1113–1119 (2007).
- Kapoor GS, Gocke TA, Chawla S et al. Magnetic resonance perfusion-weighted imaging defines angiogenic subtypes of oligodendroglioma according to 1p19q and EGFR status. J. Neurooncol. 92(3), 373–386 (2009).
- Minniti G, Salvati M, Arcella A et al. Correlation between O6-methylguanine- DNA methyltransferase and survival in elderly patients with glioblastoma treated with radiotherapy plus concomitant and adjuvant temozolomide. J. Neurooncol. 102(2), 311–316 (2011).
- Gupta A, Omuro AM, Shah AD et al. Continuing the search for MR imaging biomarkers for MGMT promoter methylation status: conventional and perfusion MRI revisited. Neuroradiology 54(6), 641–643 (2012).
- Moon WJ, Choi JW, Roh HG, Lim SD, Koh YC. Imaging parameters of high grade gliomas in relation to the MGMT promoter methylation status: the CT, diffusion tensor imaging, and perfusion MR imaging. Neuroradiology 54(6), 555–563 (2012).
- Henson JW, Gaviani P, Gonzalez RG. MRI in treatment of adult gliomas. Lancet Oncol. 6(3), 167–175 (2005).
- Jacobs AH, Kracht LW, Gossmann A et al. Imaging in neurooncology. NeuroRx 2(2), 333–347 (2005).
- Weber MA, Giesel FL, Stieltjes B. MRI for identification of progression in brain tumors: from morphology to function. Expert Rev. Neurother. 8(10), 1507–1525 (2008).
- Weber MA, Henze M, Tuttenberg J et al. Biopsy targeting gliomas: do functional imaging techniques identify similar target areas? Invest. Radiol. 45(12), 755–768 (2010).
- Stupp R, Mason WP, van den Bent MJ et al. Radiotherapy plus concomitant and adjuvant temozolomide for glioblastoma. N. Engl. J. Med. 352(10), 987–996 (2005).
- Chi AS, Wen PY. Inhibiting kinases in malignant gliomas. Expert Opin. Ther. Targets 11(4), 473–496 (2007).
- Furnari FB, Fenton T, Bachoo RM et al. Malignant astrocytic glioma: genetics, biology, and paths to treatment. Genes Dev. 21(21), 2683–2710 (2007).
- Sathornsumetee S, Reardon DA, Desjardins A, Quinn JA, Vredenburgh JJ, Rich JN. Molecularly targeted therapy for malignant glioma. Cancer 110(1), 13–24 (2007).
- Sathornsumetee S, Rich JN, Reardon DA. Diagnosis and treatment of high-grade astrocytoma. Neurol. Clin. 25(4), 1111–1139, x (2007).
- MacDonald DR, Cascino TL, Schold SC Jr, Cairncross JG. Response criteria for Phase II studies of supratentorial malignant glioma. J. Clin. Oncol. 8(7), 1277–1280 (1990).
- Wen PY, Macdonald DR, Reardon DA et al. Updated response assessment criteria for high-grade gliomas: response assessment in neuro-oncology working group. J. Clin. Oncol. 28(11), 1963–1972 (2010).
- Gallego Perez-Larraya J, Lahutte M, Petrirena G et al. Response assessment in recurrent glioblastoma treated with irinotecanbevacizumab: comparative analysis of the Macdonald, RECIST, RANO, and RECIST + F criteria. Neuro. Oncol. 14(5), 667–673 (2012).
- Henson JW, Ulmer S, Harris GJ. Brain tumor imaging in clinical trials. AJNR Am. J. Neuroradiol. 29(3), 419–424 (2008).
- Reardon DA, Galanis E, Degroot JF et al. Clinical trial end points for high-grade glioma: the evolving landscape. Neuro. Oncol. 13(3), 353–361 (2011).
- Leibel S, Sheline G. Tolerance of the brain and spinal cord to conventional irradiation. In: Radiaiton Injury to the Nervous System. Gutin P, Sheline G (Eds). Raven, NY, USA, 239–256 (1991).
- Lawrence YR, Li XA, El Naqa I et al. Radiation dose-volume effects in the brain. Int. J. Radiat. Oncol. Biol. Phys. 76(Suppl. 3), S20–S27 (2010).
- Fink J, Born D, Chamberlain MC. Radiation necrosis: relevance with respect to treatment of primary and secondary brain tumors. Curr. Neurol. Neurosci. Rep. 12(3), 276–285 (2012).
- Barajas RF, Chang JS, Sneed PK, Segal MR, McDermott MW, Cha S. Distinguishing recurrent intra-axial metastatic tumor from radiation necrosis following gamma knife radiosurgery using dynamic susceptibility-weighted contrastenhanced perfusion MR imaging. AJNR Am. J. Neuroradiol. 30(2), 367–372 (2009).
- Mitsuya K, Nakasu Y, Horiguchi S et al. Perfusion weighted magnetic resonace imaging to distinguish the recurrence of metastatic brain tumors from radiation necrosis after stereotactic radiosurgery. J. Neurooncol. 99(1), 81–88 (2010).
- Barajas RF Jr, Chang JS, Segal MR et al. Differentiation of recurrent glioblastoma multiforme from radiation necrosis after external beam radiation therapy with dynamic susceptibility-weighted contrastenhanced perfusion MR imaging. Radiology 253(2), 486–496 (2009).
- Larsen VA, Simonsen HJ, Law I, Larsson HB, Hansen AE. Evaluation of dynamic contrast-enhanced T1-weighted perfusion MRI in the differentiation of tumor recurrence from radiation necrosis. Neuroradiology 55(3), 361–369 (2013).
- Narang J, Jain R, Arbab AS et al. Differentiating treatment-induced necrosis from recurrent/progressive brain tumor using nonmodel-based semiquantitative indices derived from dynamic contrast-enhanced T1-weighted MR perfusion. Neuro. Oncol. 13(9), 1037–1046 (2011). n Examines the utility of dynamic contrast-enhanced perfusion in distinguishing between recurrent tumor and radiation injury in treated tumors.
- Ozsunar Y, Mullins ME, Kwong K et al. Glioma recurrence versus radiation necrosis? A pilot comparison of arterial spin-labeled, dynamic susceptibility contrast enhanced MRI, and FDG-PET imaging. Acad. Radiol. 17(3), 282–290 (2010).
- de Wit MC, de Bruin HG, Eijkenboom W, Sillevis Smitt PA, van den Bent MJ. Immediate post-radiotherapy changes in malignant glioma can mimic tumor progression. Neurology 63(3), 535–537 (2004).
- Brandsma D, Stalpers L, Taal W, Sminia P, van den Bent MJ. Clinical features, mechanisms, and management of pseudoprogression in malignant gliomas. Lancet Oncol. 9(5), 453–461 (2008).
- Chamberlain MC, Glantz MJ, Chalmers L, van Horn A, Sloan AE. Early necrosis following concurrent Temodar and radiotherapy in patients with glioblastoma. J. Neurooncol. 82(1), 81–83 (2007).
- Brandes AA, Tosoni A, Spagnolli F et al. Disease progression or pseudoprogression after concomitant radiochemotherapy treatment: pitfalls in neurooncology. Neuro. Oncol. 10(3), 361–367 (2008).
- Taal W, Brandsma D, de Bruin HG et al. Incidence of early pseudo-progression in a cohort of malignant glioma patients treated with chemoirradiation with temozolomide. Cancer 113(2), 405–410 (2008).
- Young RJ, Gupta A, Shah AD et al. Potential utility of conventional MRI signs in diagnosing pseudoprogression in glioblastoma. Neurology 76(22), 1918–1924 (2011).
- Brandes AA, Franceschi E, Tosoni A et al. MGMT promoter methylation status can predict the incidence and outcome of pseudoprogression after concomitant radiochemotherapy in newly diagnosed glioblastoma patients. J. Clin. Oncol. 26(13), 2192–2197 (2008).
- Chaskis C, Neyns B, Michotte A, de Ridder M, Everaert H. Pseudoprogression after radiotherapy with concurrent temozolomide for high-grade glioma: clinical observations and working recommendations. Surg. Neurol. 72(4), 423–428 (2009).
- Mangla R, Singh G, Ziegelitz D et al. Changes in relative cerebral blood volume 1 month after radiation-temozolomide therapy can help predict overall survival in patients with glioblastoma. Radiology 256(2), 575–584 (2010).
- Tsien C, Galban CJ, Chenevert TL et al. Parametric response map as an imaging biomarker to distinguish progression from pseudoprogression in high-grade glioma. J. Clin. Oncol. 28(13), 2293–2299 (2010).
- Hygino da Cruz LC Jr, Rodriguez I, Domingues RC, Gasparetto EL, Sorensen AG. Pseudoprogression and pseudoresponse: imaging challenges in the assessment of posttreatment glioma. AJNR Am. J. Neuroradiol. 32(11), 1978–1985 (2011).
- Young RJ, Gupta A, Shah AD et al. MRI perfusion in determining pseudoprogression in patients with glioblastoma. Clin. Imaging 37(1), 41–49 (2013).
- Gahramanov S, Raslan AM, Muldoon LL et al. Potential for differentiation of pseudoprogression from true tumor progression with dynamic susceptibilityweighted contrast-enhanced magnetic resonance imaging using ferumoxytol vs. gadoteridol: a pilot study. Int. J. Radiat. Oncol. Biol. Phys. 79(2), 514–523 (2011).
- Cohen MH, Shen YL, Keegan P, Pazdur R. FDA drug approval summary: bevacizumab (Avastin) as treatment of recurrent glioblastoma multiforme. Oncologist 14(11), 1131–1138 (2009).
- Schiff D, Purow B. Bevacizumab in combination with irinotecan for patients with recurrent glioblastoma multiforme. Nat. Clin. Pract. Oncol. 5(4), 186–187 (2008).
- Kreisl TN, Kim L, Moore K et al. Phase II trial of single-agent bevacizumab followed by bevacizumab plus irinotecan at tumor progression in recurrent glioblastoma. J. Clin. Oncol. 27(5), 740–745 (2009).
- Brandsma D, van den Bent MJ. Pseudoprogression and pseudoresponse in the treatment of gliomas. Curr. Opin. Neurol. 22(6), 633–638 (2009).
- Pope WB, Kim HJ, Huo J et al. Recurrent glioblastoma multiforme: ADC histogram analysis predicts response to bevacizumab treatment. Radiology 252(1), 182–189 (2009).
- Gerstner ER, Chen PJ, Wen PY, Jain RK, Batchelor TT, Sorensen G. Infiltrative patterns of glioblastoma spread detected via diffusion MRI after treatment with cediranib. Neuro. Oncol. 12(5), 466–472 (2010).
- Sorensen AG, Batchelor TT, Zhang WT et al. A ‘vascular normalization index’ as potential mechanistic biomarker to predict survival after a single dose of cediranib in recurrent glioblastoma patients. Cancer Res. 69(13), 5296–5300 (2009).
- Emblem KE, Bjornerud A, Mouridsen K et al. T(1)- and T(2)(*)-dominant extravasation correction in DSC-MRI: part II – predicting patient outcome after a single dose of cediranib in recurrent glioblastoma patients. J. Cereb. Blood Flow Metab. 31(10), 2054–2064 (2011).
- Fellah S, Girard N, Chinot O, Cozzone PJ, Callot V. Early evaluation of tumoral response to antiangiogenic therapy by arterial spin labeling perfusion magnetic resonance imaging and susceptibility weighted imaging in a patient with recurrent glioblastoma receiving bevacizumab. J. Clin. Oncol. 29(11), e308–e311 (2011).
