Research Article - Diabetes Management (2020) Volume 10, Issue 1
The prescription pattern of antidiabetic medication and glycemic control in type 2 diabetes in Iran; A patient- level study
- Corresponding Author:
- Yahya Bayazidi
Department of Pharmacoeconomics and Pharmaceutical Administration
Faculty of Pharmacy
Tehran University of Medical Sciences, Tehran, Iran
E-mail: ybayazidi@gmail.com
Abstract
Type 2 Diabetes (T2DM) is one of the most prevalent chronic diseases which was the seventh leading cause of death in 2016 worldwide [1]. The main goal of drug therapy in diabetic patients is to control their blood glucose levels and consequently to control their complications. As the control of blood glucose gets worse, the patient will encounter a number of micro and macro vascular complications [2,3]. The American Diabetes Association (ADA) recommends that diabetic patients should be treated in such a way that glycosylated hemoglobin (HbA1c) reaches less than 7% [4]. Nevertheless, most diabetic patients still have not achieved the recommended goals [5-8]. Though diet and lifestyle are very effective in controlling blood glucose, but it usually fails and leads to oral drug therapy. If drug therapy fails at the second step, oral multiple-therapy will be applied. Multiple-therapy will get optimized and it will be switched to oral-injectable multiple therapies in the final steps [9]. With widespread changes in medication therapies to reduce hyperglycemia, recommendations for controlling blood glucose levels have changed over the years In regard to these changes in diabetes management, the trend in the utilization of glucose-lowering therapies as well as their ability to control blood glucose are also of great importance [7].The utilization of medication is defined by the WHO as marketing, prescription, distribution and drug usage in the community and particular emphasis has been given to its medical, social and economic consequences. Drug utilization studies try to synchronize the information of drugs consumptions in various types of disease, the outcome of treatment, and quality of care to consider the ultimate goal of whether drug therapy is rational or not [10[.Different studies have shown different patterns of anti-diabetic utilization among different countries [11-14]. For example, Lipska and colleagues examined the pattern of utilization and the ability to achieve control of hyperglycemia in the United States between 2006 and 2013 in different regions of the United States. Their findings, in addition to the big variation in the utilization of blood glucose lowering agents, showed that the proportion of people with HbA1c less than 7% (as an indicator of good control) decreased and poor control (> 9 %) increased during that period of time. They revealed that over the last eight years, despite dramatic changes in the consumption of hyperglycemic agents, the overall blood glucose control was not improved, and poor control exists among nearly a quarter of the youngest patients [9]. Yurgin and his colleagues, also investigated the utilization pattern and the ability to achieve blood glucose control and found that only 52.7% of the patients achieved the targets for HbA1c; and insulin-treated patients were in the worst situation compared to HbA1 targets [8]. In 2012, more than 4.5 million adults in Iran suffered from diabetes. It was anticipated that more than a quarter of them had not yet been diagnosed [15]. The number of Iranian population with diabetes is expected to reach 9.2 million in 2030 (16). Although several studies have been conducted on the pattern of administration of anti-diabetic drugs in Iran [17,18] but none of these studies have been large enough to be generalized to the country. The aim of this study was conducted to evaluate the prescription pattern and their effectiveness in controlling blood glucose in patients with type 2 diabetes in public and private clinics in two of the country's largest provinces; Tehran and Isfahan
Keywords
■ anti-diabetic medication ■prescription pattern ■glycemic control ■type 2 diabetes ■ Iran
Highlights
Type 2 Diabetes (T2DM) is one of the most prevalent chronic diseases which was the seventh leading cause of death in 2016 worldwide [1]. The main goal of drug therapy in diabetic patients is to control their blood glucose levels and consequently to control their complications. As the control of blood glucose gets worse, the patient will encounter a number of micro and macro vascular complications [2,3]. The American Diabetes Association (ADA) recommends that diabetic patients should be treated in such a way that glycosylated hemoglobin (HbA1c) reaches less than 7% [4]. Nevertheless, most diabetic patients still have not achieved the recommended goals [5-8]. Though diet and lifestyle are very effective in controlling blood glucose, but it usually fails and leads to oral drug therapy. If drug therapy fails at the second step, oral multiple-therapy will be applied. Multiple-therapy will get optimized and it will be switched to oral-injectable multiple therapies in the final steps [9]. With widespread changes in medication therapies to reduce hyperglycemia, recommendations for controlling blood glucose levels have changed over the years In regard to these changes in diabetes management, the trend in the utilization of glucose-lowering therapies as well as their ability to control blood glucose are also of great importance [7].The utilization of medication is defined by the WHO as marketing, prescription, distribution and drug usage in the community and particular emphasis has been given to its medical, social and economic consequences. Drug utilization studies try to synchronize the information of drugs consumptions in various types of disease, the outcome of treatment, and quality of care to consider the ultimate goal of whether drug therapy is rational or not [10]. Different studies have shown different patterns of anti-diabetic utilization among different countries [11-14]. For example, Lipska and colleagues examined the pattern of utilization and the ability to achieve control of hyperglycemia in the United States between 2006 and 2013 in different regions of the United States. Their findings, in addition to the big variation in the utilization of blood glucose lowering agents, showed that the proportion of people with HbA1c less than 7% (as an indicator of good control) decreased and poor control (>9%) increased during that period of time. They revealed that over the last eight years, despite dramatic changes in the consumption of hyperglycemic agents, the overall blood glucose control was not improved, and poor control exists among nearly a quarter of the youngest patients [9]. Yurgin et al., also investigated the utilization pattern and the ability to achieve blood glucose control and found that only 52.7% of the patients achieved the targets for HbA1c; and insulintreated patients were in the worst situation compared to HbA1 targets [8]. In 2012, more than 4.5 million adults in Iran suffered from diabetes. It was anticipated that more than a quarter of them had not yet been diagnosed [15]. The number of Iranian population with diabetes is expected to reach 9.2 million in 2030 [16]. Although several studies have been conducted on the pattern of administration of anti-diabetic drugs in Iran [17,18] but none of these studies have been large enough to be generalized to the country. The aim of this study was conducted to evaluate the prescription pattern and their effectiveness in controlling blood glucose in patients with type 2 diabetes in public and private clinics in two of the country’s largest provinces; Tehran and Isfahan.
Methods
This cross-sectional retrospective study was conducted among patients with T2DM in five main diabetes centers in two provinces in Iran; Tehran and Isfahan. Inclusion criteria for the patients included diagnosis of type 2 diabetes, the use of anti-diabetic medications for the past 5 years, the existence of clinical and pharmacological data for the patient over the period, and ongoing referral to the relevant treatment center. For data collection, we first visited the diabetes centers, randomly selected patients’ profile, and extracted the patient’s records that were included. These records were including age, weight, HbA1c, and name and dose of prescribed drugs. Then we checked the profile of the patients and separated the files that were active, and the reason for this was that, firstly, the files and information were needed which should be within the desired time frame, and secondly, if there was a defect in the recorded information, we contacted to the patients and invited them to the centers to amend the recorded data. In the centers where the number of eligible patients were greater than the required numbers, according to the patient’s case number and based on the random number table, the samples were selected randomly; and where the numbers of eligible patients were less than the required number, all statistical population were included to the study. The prescribed medicines, HbA1c level, and the percentage of patients with poor, moderate and good control during the study time were extracted from the patients’ profiles. Antidiabetic medications were classified according to the pharmacological classification. The study was approved by the Ethics Committee (IR.TUMS. PSRC.REC.1396.1991) at Tehran University of Medical Sciences and all the patients provided written informed consent.
■ Statistical analysis
All statistical analysis was performed using StataCorp 2014. Descriptive analysis was performed for each year and various variables. One-way ANOVA was used to evaluate the data by applying 95% CI.
Result
■ Patients and clinical characteristicsFifty-four percent of the participants in the study were women and the mean ± standard deviation of patients’ age was 60.85 ± 9.75 years old, with the minimum and maximum age of 23 and 90 years old. The mean ± standard deviation of patients’ BMI was 29, 19 ± 4.65, with the minimum and maximum of 18.34 and 60.33 kg/ m2 and the diabetes age was 12.43 ± 8.01. The summary characteristics of the T2DM patients are shown in TABLE 1.
Table 1: Baseline characteristics of the patients
| Gender | Number of patients (%) | |
|---|---|---|
| Men | 0.46 | |
| Women | 0.54 | |
| Duration of diabetes illness (year) | ||
| ≤ 10 | 0.48 | |
| >10 | 0.52 | |
| BMI (kg/m2) | ||
| Underweight (<18.5 kg/m2) | 0.0 | |
| Normal range (18.5–24.9 kg/m2) | 0.18 | |
| Overweight (25.0–29.9 kg/m2) | 0.45 | |
| Obese (≥ 30 kg/m2) | 0.37 | |
| Age (years) | ||
| <45 | 0.05 | |
| 45-65 | 0.65 | |
| >65 | 0.30 | |
| The family history of T2DM | ||
| Yes | 0.58 | |
| No | 0.42 | |
| Marital status | ||
| Single | 0.23 | |
| Married | 0.77 | |
■ Treatment pattern of anti-diabetic drugs
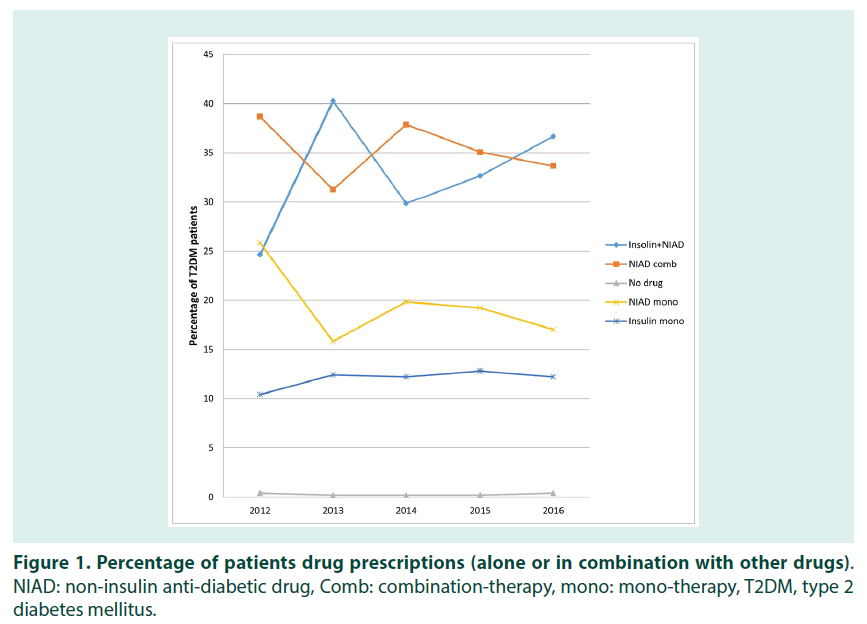
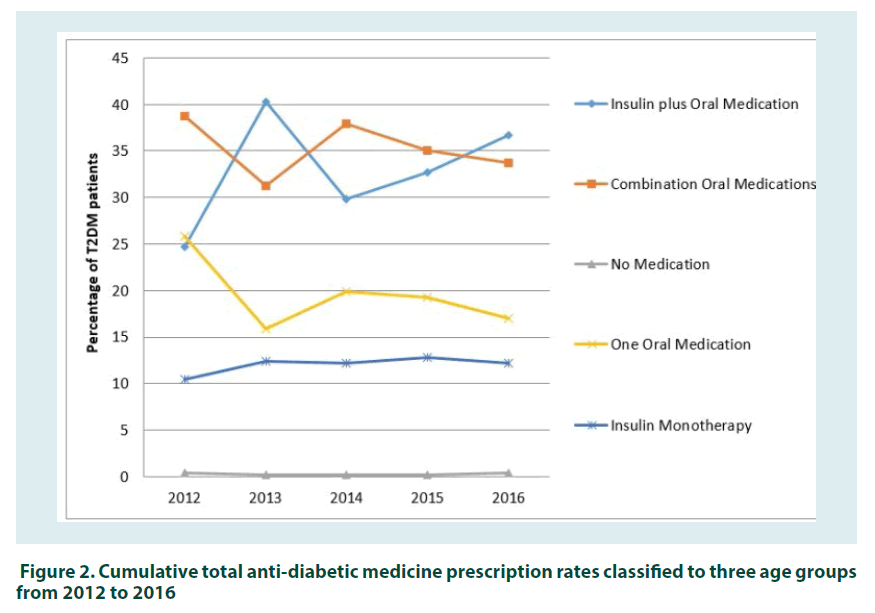
The treatment pattern of the patients was categorized into 5 groups; no medication (group I), single oral medication (group II), oral medications (group III), only insulin therapy (group IV), and combination therapy (insulin plus oral medication) (group V). The highest proportion of diabetic patients in 2012 were in group III (38.67%) followed by group II (25.85%) and then group V (24.64%). In 2013, a massive shift observed in percentage of group V so that it increased to 40.28% (p-value<0.05). However the percentage of group III and II decreased to 31.26 % (p-value<0.05) and 15.83% (p-value>0.05) respectively. In years 2014 and 2015, group III had the most proportion of the total prescriptions (37.87%, p-value>0.05) and the position of group V was changed to second (29.85%, p-value>0.05), but the other groups remained almost unchanged. Again in 2016, group V was the most prescribed anti-diabetic medicines (36.67%). A comparison of double two-step test confirmed that between 2012 and 2016, only changes in group V were statistically significant (p-value<0.05). Group I had the lowest proportion during the study period and its flactuations were not statistically significant. A summary of the distribution pattern of the patients in different groups in 2012-2016, is shown in FIGURE 1.
Figure 1: Percentage of patients drug prescriptions (alone or in combination with other drugs). NIAD: non-insulin anti-diabetic drug, Comb: combination-therapy, mono: mono-therapy, T2DM, type 2 diabetes mellitus.
■ Prescribing pattern in different age groups
In order to evaluate the pattern of prescribing drugs based on age groups, we first divided the drugs into 8 groups, based on their mechanism of action. These groups were insulins, Meglitinides, Dipeptidyl peptidase-4 (DPP4), Sulfonylureas, Thiazolidinediones (TZDs), Alpha-Glucosidase Inhibitors (AGIs), Glucagon-like peptide 1 (GLP1), and Biguanides. Secondly the patients were classified into three main age groups; <45, 45- 65 and >65. Third, the total amount of each anti-diabetic groups in various age groups between 2012 and 2016 were calculated. The summary results of prescribing pattern in different age groups from 2012 to 2016 are shown in FIGURE 2. The results show that Biguanides was the most frequent prescribed medicine in all ages during 2012 to 2016. However, the percentage and trend of the prescription were differing in various age groups. For instance, while the percentage of Biguanides in under 45 years old decreased from 52% to 42% between 2012 and 2016, it remained almost unchanged in the over 65 years old patients at the same time. Nonetheless, the comparison of cumulative consumptions of Biguanides during the study period showed that the variations in all age groups were not statistically significant (p-value>0.05). Insulins was the second most frequent prescribed medicines (30%) in under 45-year group in 2012. Though the percentage of Insulins had some fluctuations between 2012 and 2016, but they remained the second during the study time in under 45-year group. The position of Insulins in the 45-65 age group was also the second, except in 2012. However, in over 65-year age group, Insulins were mainly in the third position, except in 2016. Sulfonylureas were the third most prescribed medicines in under 45-year old group during 2012 and 2014; but their position changed to fourth in the next years. They were the third in 45-65 years’ group but in year 2012. However, sulfonylureas had the second position in the group of over 65 during the study time, except in 2016. This happened because the proportion of patients prescribed sulfonylureas in over 65-year-old group decreased from 27% in 2012 to 17% in 2016. Our results show that Biguanides, Insulins, and Sulfonylureas were three of the most widely used anti-diabetes medicines in all ages, respectively. Although the percentage of their consumption had some changes during the study time, these changes were not statistically significant (p-value>0.05).
■ Glycemic Control
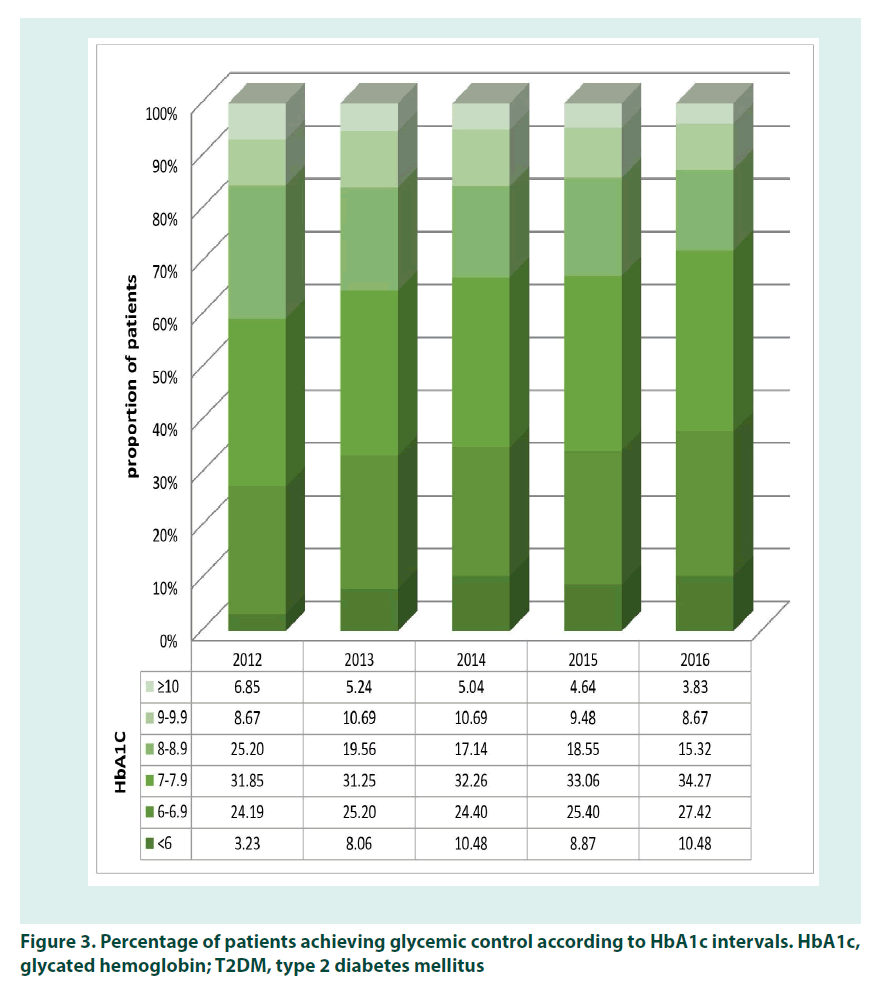
To study HbA1c variations, we divided HbA1c values into the 6 levels; lower than 6%, 6%- 6.9%, 7%-7.9%, 8%-8.9%, 9%-9.9%, and more than 10%. Though the results show that the proportion of patients with good (HbA1c<7%) and moderate (HbA1c<8%) blood glucose control increased and the proportion of patients with poor glycemic control (HbA1c>9%) decreased during the study time, but the changes were not statistically significant (p-value>0.05). At the start of the study, only 27.4% of patients had HbA1c lower than 7%, but these patients increased to 37.9% (p-value>0.05) by 2016. Likewise the total number of moderate and good blood glycemic control increased from 58.9% to 72% (p-value>0.05) in the same time. In 2012 the proportion of patients with poorly controlled blood glucose (more than 9%) was 15.6% of all patients and it decreased to 12.6% in 2016 (p-value>0.05). Nonetheless, the changes in the percentage of patients at each level of HbA1c were not statistically significant in the six-levels of HbA1c with 95% confidence interval and p<0.05. The percentage of patients and their level of HbA1c during the study time are shown in FIGURE 3
Figure 3: Percentage of patients achieving glycemic control according to HbA1c intervals. HbA1c, glycated hemoglobin; T2DM, type 2 diabetes mellitus
■ The trend in Glycemic Control
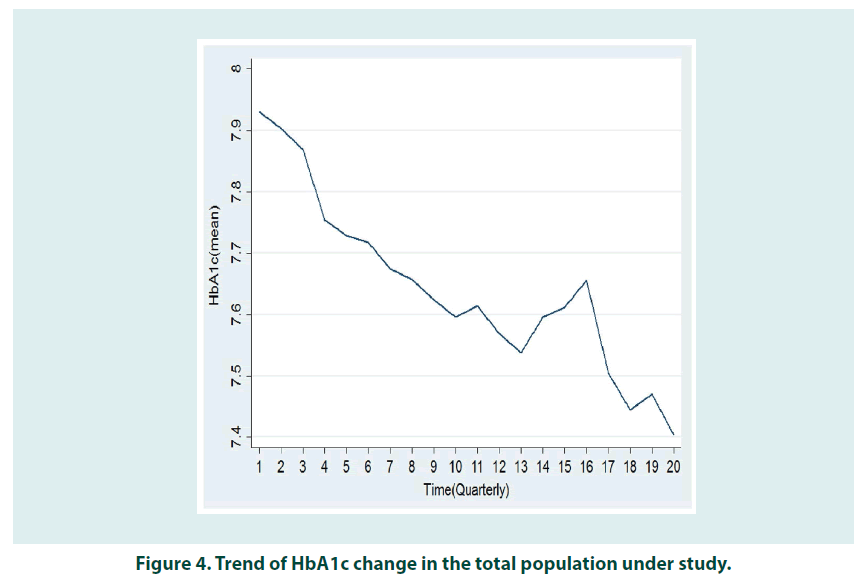
In the first quarter, the average of HbA1c was 7.921 (95% Confidence Interval [CI] 7.81 to 8.03) (Std. Dev. 1.26), in March 2012 and in the last quarter of the study period decreased to 7.40(SD: 0.05) to 7.40 (95% Confidence Interval [CI] 7.27 to 7.52) in March 2017 (SD=0.06) (p-value<0.05). We checked the double-two comparison HbA1C, which included the extracted three-month values. Of the 189 possible scenarios, only HbA1C values at times 1, 2, and 3 with 17, 18, 19 and 20 states, had a significant difference with the confidence level of 95% and p<0.05. In fact, the amount of HbA1C reduction has been significant between the first and the last year and was not significant with the other years.
Discussion
To the best of our knowledge, the current study is one of the few studies that have been conducted with patient-level data for the evaluation of the pattern of anti-diabetes drug prescription and blood glucose changes. Previous studies were focused on a narrow area in a very short time period [17,18]. The aim of this study was to assess the pattern and the effect of anti-diabetes medication in type 2 diabetics at patient level. Our results demonstrated that greater percentage of women had the criteria for inclusion. This result are consistent the results of previous studies which found women to be more worried and likely to seek more care for their disease comparing with men [19,20]. While the pattern of anti-diabetes drugs showed an incremental trend from 2001 to 2012, in 2012 insulins only accounted for 17% of total antidiabetic drugs consumption [21]. One of the most important reasons for this may be an insufficiency of physicians’ awareness about clinical guidelines [22], patient’s worrying about insulin injections [23] and also the high cost and unaffordability of novel insulin in the Iranian pharmaceutical market [23]. However, the Iranian Ministry of Health for the first time considered insulin as one of the drugs that should receive governmental subsidies to make it more accessible and affordable for all diabetes [24]. This policy was implemented by signing a memorandom of understanding between Health Insurance Organizations (HIOs) and ministry of health so that the ministry will pay the extra costs of new insulins to HIOs for coverage of these insulins. This policy affected the prescription pattern of new insulins in Iran in 2013 and led to a sharp increase in insulin consumption (p-value<0.05). Likewise, the combination of insulin with oral medications was increased importantly. Similar to other studies [8,25-27]. Biguanides was the most prescribed drugs in the entire of the study period. Nonetheless it had a decreasing trend in both under 45 and 45-65 age groups; but the trend is almost stable for over 65 (FIGURE 2). Sulfonylureas had a decreasing trend in 45-65 and over 65 age groups. They were the second most commonly prescribed anti diabetes drugs. The decrease in the prescription of sulfonylureas can be due to the fact that some of them increase the risk of severe hypoglycemia and also led to weight gain as the disease progresses and replaced with the other blood glucose lowering agent, such as insulins [28].
Low prescription levels of the DPP4 group during the study period is due to the recent entry of this drug group to Iran’s pharmaceutical market [29]. The second explanation is that these drugs are still not covered by insurance organizations, thus the most of physicians refuse to prescribe DPP4 to protect their patients from the high costs of these drugs. This is why there are very few studies were conducted on the effectiveness of this drug group in the Iranian population [30,31]. The downward trend for insulin after 2013 suggests that the high cost of insulin was not the main reason for its low use, but the problem may be low awareness of the patients and the doctors; however, more precise studies are needed to clarify the exact cause of this decline. Decreasing HbA1c over time is one of the main goals of all care programs in patients with T2DM. If the amount of reduction is significant, this reduction has to lead to an optimum level of HbA1c, which is less than 7% [32]. Our study showed that the percentage of patients with poor glycemic control (more than 9%) was reduced. Although the percentage of patients with HbA1c less than 7% (good glycemic control) increased from 27.4% to 37.9%, this parentage in both (at the beginning of the study and at the end of the study) is much lower than other studies. Shahraz and colleague showed that this proportion from 2007 to 2014 was more than 54% of all patients [33]. However, the increase or decrease in the percentage of the level of HbA1C in the patients were not significant for any of the cut-offs. The amount of achievement of HbA1c control is shown in FIGURE 4. In addition to the importance of changes in the proportion of the patients in each interval (cut-offs) over the time, these changes could also show the effectiveness of the medication therapy for controlling blood glucose. Lawrence and colleague examined the use of insulin and their effect on HbA1c in a 4-year period and showed that after four years, HbA1C has been reduced by 1.2%- 2.4%; And nearly 40% of patients with HbA1c level higher than 9%, has fallen below 7% at the end of the study [34]. Blomenthal and colleagues also examined HbA1c changes over a ten-year period, and showed that the level of HbA1C higher than 11% had dropped by 3.2% during the study period. Likewise, HbA1C higher than 10-11 and 9-10 % was reduced by 1.7 and 1.2% respectively [35]. The results of our study showed a very small reduction in the amount of HbA1C (0.521%) over the five years. These achievements are not only very small compared with other studies, but also are considerably far from the defined goals by most of the clinical guidelines [4]; however the differences between the level of HbA1c in the first year compared to the last year was statistically significant. Since our results are only from patients who were continuously monitored, we can expect that managing diabetes is much worse in the rest of the patient. It is showed that the gap between the actual level of HbA1c and its optimum level can increase the risk of micro and macro vascular complications [36,37] and consequently can decrease the quality of life of the patients and impose considerable costs to both the patients and health system.
Conclusion
Our retrospective study showed the pattern of administration of diabetic drugs did not change during the five years significantly, and did not have an appropriate impact on HbA1c control. This can increase the risk of micro and macro vascular complications, decreasing the quality of life of the patients and consequently imposing considerable costs to the patients and the health system. This can increase the risk of micro and macro vascular complications, decreasing the quality of life of the patients and consequently imposing considerable costs to the patients and the health system. It is quite expected that the Hba1c control in the whole diabetic patients are worse than the studied patients. These findings suggest that the diabetes cares in Iran need to be improved promptly and appropriately.
Limitations
Limited number of eligible patients in diabetes centers, uncompleted patients’ profiles, and limited number of provinces studied were three main limitations of our study.
References
- https://www.who.int/news-room/fact-sheets/detail/diabetes.
- https://www.idf.org/e-library/epidemiology-research/diabetes-atlas/19-atlas-6th-edition.html
- Stratton I, Adler A, Neil H et al. Association of glycaemia with macrovascular and microvascular complications of type 2 diabetes (UKPDS 35): Prospective observational study. BMJ. 321(7258), 405-412 (2000).
- American Diabetes Association. 6. Glycemic targets: Standards of medical care in diabetes—2018. Diabetes. Care. 41(S1), S55-S64 (2018).
- Karter A, Moffet H, Liu J et al. Achieving good glycemic control: initiation of new antihyperglycemic therapies in patients with type 2 diabetes from the Kaiser Permanente Northern California Diabetes Registry. Am. J. Manag. Care. 11(4), 262-270 (2005).
- Dhanaraj E, Raval A, Yadav R et al. Prescribing pattern of antidiabetic drugs and achievement of glycemic control in T2DM patients tertiary care hospital in North India. Int. J. Diabetes. Dev. Ctries. 33(3),140-146 (2013).
- Lipska K, Yao X, Herrin J et al. Trends in drug utilization, glycemic control, and rates of severe hypoglycemia, 2006–2013. Diabetes. Care. 40(4), 468-475 (2017).
- Yurgin N, Secnik K, Lage M. Antidiabetic prescriptions and glycemic control in German patients with type 2 diabetes mellitus: A retrospective database study. Clin. Ther. 29(2), 316-325 (2007).
- Turner R, Cull C, Frighi V, Holman RR, Group UPDS. Glycemic control with diet, sulfonylurea, metformin, or insulin in patients with type 2 diabetes mellitus: progressive requirement for multiple therapies (UKPDS 49). JAMA. 281(21), 2005-2012 (1999).
- http://www.fao.org/3/a-ac911e.pdf
- Melander A, Folino-Gallo P, Walley T et al. Utilisation of antihyperglycaemic drugs in ten European countries: different developments and different levels. Diabetologia. 49(9), 2024-2029 (2006).
- Doro P, Benko R, Kosik E et al. Utilization of oral antihyperglycemic drugs over a 7–year period (1998–2004) in a Hungarian population and adherence to drug therapy. Eur. J. Clin. Pharmacol. 61(12), 893-897 (2005).
- Baviera M, Monesi L, Marzona I et al. Trends in drug prescriptions to diabetic patients from 2000 to 2008 in Italy's Lombardy Region: a large population-based study. Diabetes.Res.Clin.Pract. 93(1), 123-130 (2011).
- Filion K, Joseph L, BoivinJ et al. Trends in the prescription of anti‐diabetic medications in the United Kingdom: a population‐based analysis. Pharmacoepidemiol. Drug. Saf. 18(10), 973-976 (2009).
- Esteghamati A, Etemad K, Koohpayehzadeh J et al. Trends in the prevalence of diabetes and impaired fasting glucose in association with obesity in Iran: 2005–2011. Diabetes. Res. Clin. Pract. 103(2), 319-327 (2014).
- Javanbakht M, Mashayekhi A, Baradaran H et al. Projection of diabetes population size and associated economic burden through 2030 in Iran: evidence from micro-simulation Markov model and Bayesian meta-analysis. Plos.One. 10(7), e0132505 (2015).
- Soleymani F, Farshchi A, Haerizadeh M. PDB69 Prescription Pattern Study of Type 2 Diabetes Mellitus in Iran. Value. Health. 14(7), A484 (2011).
- Yusefzadeh G, Sepehri G, Goodarzi H et al. Prescription pattern study in type 2 diabetes mellitus in diabetic out patients in private clinics in Kerman, Iran. Br. J. Med. Med. Res. 4(32), 5144 (2014).
- Anderson R, Fitzgerald J, Oh M. The relationship between diabetes-related attitudes and patients' self-reported adherence. Diabetes. Educ. 19(4), 287-292 (1993).
- Sharpe P, Clark N, Janz N. Differences in the impact and management of heart disease between older women and men. Women. Health. 17(2), 25-43 (1991).
- Sarayani A, Rashidian A, Gholami K. Low utilisation of diabetes medicines in Iran, despite their affordability (2000–2012):A time-series and benchmarking study. BMJ. Open. 4(10), e005859 (2014).
- Peimani M, Tabatabaei-Malazy O, Heshmat H et al. Knowledge, Attitude and Practice of physicians in the field of diabetes and its complications: A pilot study. IJDLD. 9,10 (2010).
- Shakibazadeh E, Larijani B, Shojaeezadeh D et al. Patients’ perspectives on factors that influence diabetes self-care. Iran. J. Public. Health. 40(4),146 (2011).
- Noshad S, Afarideh M, Heidari B et al. Diabetes care in Iran: Where we stand and where we are headed. Ann. Glob. Health. 81(6), 839-850 (2015).
- Vengurlekar S, Shukla P, Patidar P et al. Prescribing pattern of antidiabetic drugs in Indore city hospital. Indian. J. Pharm. Sci. 70(5), 637 (2008).
- Abdi S, Churi S, Kumar Y. Study of drug utilization pattern of antihyperglycemic agents in a South Indian tertiary care teaching hospital. Indian. J. Pharmacol. 44(2), 210-214 (2012).
- Das P, Das B, Rauniar G et al. Drug utilization pattern and effectiveness analysis in diabetes mellitus at a tertiary care centre in eastern Nepal. Indian. J. Physiol. Pharmacol. 55(3), 272-280 (2011).
- Singh A, Singh R. Is gliclazide a sulfonylurea with difference? A review in 2016. Expert. Rev. Clin. Pharmacol. 9(6), 839-851 (2016).
- Khaloo P, Komeleh S, Alemi H et al. Sitagliptin vs. pioglitazone as add-on treatments in patients with uncontrolled type 2 diabetes on the maximal dose of metformin plus sulfonylurea. J. Endocrinol. Invest. 1-7 (2018).
- Zonoozi S, Barnard M, Prescott E et al. Effectiveness and safety of sitagliptin in patients with beta-thalassaemia major and diabetes mellitus: a case series. Mediterr. J. Hematol. Infect. Dis. 9(1) 2017.
- Keshavarz K, Lotfi F, Sanati E et al. Linagliptin versus sitagliptin in patients with type 2 diabetes mellitus: a network meta-analysis of randomized clinical trials. Daru. 25(1), 23 (2017).
- American Diabetes Association. Standards of medical care in diabetes—2018 abridged for primary care providers. Diabetes. Care. 36(1), 14-37. (2018).
- Shahraz S, Pittas A, Saadati M et al. Change in testing, awareness of hemoglobin A1c result, and glycemic control in US adults, 2007-2014. JAMA. 318(18), 1825-1827 (2017).
- Blonde L, Marre M, Vincent M et al. Insulin regimens and glycemic control in different parts of Europe over 4 years after starting insulin in people with type 2 diabetes: Data from the CREDIT non-interventional study. Diabetes. Res. Clin. Pract. 133, 150-158 (2017).
- Blumenthal K, Larkin M, Winning G et al. Changes in glycemic control from 1996 to 2006 among adults with type 2 diabetes: a longitudinal cohort study. BMC. Health. Serv. Res. 10(1), 158 (2010).
- Advance Collaborative Group. Intensive blood glucose control and vascular outcomes in patients with type 2 diabetes. N. Engl. J. Med. 358(24), 2560-2572 (2008).
- Selvin E, Marinopoulos S, Berkenblit G et al. Meta-analysis: Glycosylated hemoglobin and cardiovascular disease in diabetes mellitus. Ann. Intern. Med. 141(6), 421-431 (2004).
