Research Article - Neuropsychiatry (2016) Volume 6, Issue 6
The visualization analysis of scientific research team in neuropsychiatry field
- Corresponding Author:
- Ying Wu
School of Humanities and Social Sciences, Shanxi Medical University, Taiyuan 030001, China
Telephone: +8603514135095
Fax: 0351-4135095
Abstract
With the increasing of scientific collaboration in recent years, the research team has been the most important floor entity in science. Neuropsychiatry as a new branch between neurology and psychiatry has focused on scientific collaboration of research teams. In this study, we used coauthorship to analyze dominant research teams and used author bibliographic coupling analysis to study potential research teams by the software Sci. After comparing analysis by the visualization of mapping knowledge domain, we can further detect the structure of research teams in this field in order to offer reasonable suggestions for the development of scientific research and the communication of knowledge in neuropsychiatry field.
Keywords
Neuropsychiatry, Scientific research team, Visualization
Introduction
In recent years, the increasing of collaboration has become one of the most necessary features of research process [1]. Increasingly, scientific research has been carried out with research teams which are the most important work floor entity in science [2]. Co-authorship network analysis has been widely used to study the collaboration of scientific research team in many fields. With the development of discipline in recent years, psychotic symptoms of disease research have developed a new branch –neuropsychiatry which becomes the bridge between neurology and psychiatry. However, few researchers have focused on neuropsychiatry. So, It is necessary to analyze it through scientific collaboration of research teams in this field [3,4]. Scientific research teams included dominant and potential teams. In this study, we used co-authorship to analyze dominant scientific research teams and used author bibliographic-coupling analysis to study potential research teams. Then after comparing analysis, we can further detect the structure of research teams in this field in order to offer reasonable suggestions for the development of scientific research and the communication of knowledge in neuropsychiatry field.
Methods
There was no especial neuropsychiatry classification in Journal Citation Report (JCR), so we collected our data from 5 core journals which had the top 5 Impact Factor in both neurology and psychiatry field according to JCR. They were Molecular Psychiatry (IF:13.314); Biological psychiatry (IF:11.212); Journal of Neurology Neurosurgery and Psychiatry (IF:6.431); Neuropsychopharmacology (IF:6.339); Journal of Psychiatry & Neuroscience (IF:5.570); CNS Drugs (IF:4.910). We retrieved total records from 2007 to 2015. The time was divided into three time perioods (2007-2009, 2010-2012, and 2013-2015).
Bibliographic coupling analysis was come up with firstly in “Bibio-graphic coupling between scientific papers” by American scholar MM. Kessler in 1963.In the 1980s, Vladntz and Cook published “Biliographic coupling and subject relateness” which has demonstrated the correlation between bibliographic coupling and the subject [5,6]. Bibliographic coupling includes paper bibliographic coupling, author bibliographic coupling and Journal bibliographic coupling, et al. In this study, we mainly used author bibliographic coupling analysis which is that if more than two authors cite the same reference, the relationship among these authors is coupling. The strength of coupling is measured by the number of the references. The more is the number of the co-cited references, the more similar is the direction of study.
At present, more popular information visual analysis software mainly include: Sci2, UCINET, Bibexcel, Gephi, VOSviewer, Citespace and Pajek. In this study, we used the software Sci2 to visual the mapping knowledge domain in which we can detect collaborative relationship vividly by the size of nodes and coupling intensity in clustered authors. Sci2 which built the mapping knowledge and its advantage in visualization was developed by Katy Borner and her team in Indiana University [7]. It can be used to build a variety of network matrix and has a strong drawing function. The National Science Foundation (NSF), The National Institutes of Health (NIH), The US Department of Agriculture (USDA) and the National Oceanic and atmospheric Administration (NOAA) all used Sci2 for data visual analysis.
Results
▪ From 2007 to 2009
The analysis on dominant scientific research teams
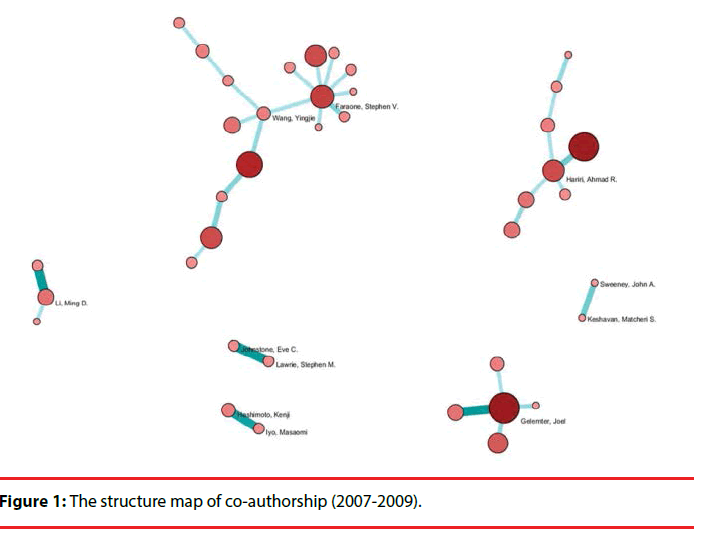
There were totally 2844 bibliographic data. The network included 13786 nodes and 74796 lines. The weight was 1 to 9. In order to highlight the core author and lessen the scale of network, we set the number of authored works more than 50, delete isolated nodes and get 7 sub-networks including 39 nodes and 32 lines through MSTPathfinder Algorithm (Figure 1). The biggest sub network included 17 nodes. Table 1 of the co-authorship from 2007 to 2009 was as listed. In sub-network 1, there were two core authors named Faraone, Stephen V. working in SUNY Upstate Medical University and Wang, Ying jie working in Pittsburgh University. These scientific research institutions as the core in the whole sub-network collaborated with American and Chinese scientific research institutions widely. In sub-network 2, the core author was Hariri, Ahmad R. working in Pittsburgh University which collaborated with NIMH intimately. In sub-network 3, the core author was Gelernter, Joel from Yale University which collaborated with American scientific research institutes intimately. In sub-network 4, the core author was Li, Ming D. who collaborated with Ma, Jennie both working in University of Virginia frequently. They also collaborated with Xi An Jiao Tong University. In sub-network 5, there were two authors named Johnstone, Eve C. and Lawrie, Stephen M. both working in University of Edinburgh. In sub-network 6, Hashimoto, Kenji and Iyo, Masaomi working in Chiba University collaborated each other up to 9 times. In sub-network 7, Sweeney, John A. working in University of Illinois and Keshavan, Matcheri S. working in Wayne State University belonged to interagency collaboration.
| Sub network |
Number of nodes | Core author | Other authors | Maximum Number of authored works | Maximum Weight |
|---|---|---|---|---|---|
| 1 | 17 | Wang, Yingjie | Manji, Husseini K.; Charney, Dennis S.; Drevets, Wayne C.; McMahon, Francis J.; Holsboer, Florian; Geyer, Mark A.; Hen, Rene; Rauch, Scott L. | 17 | 3 |
| Faraone, Stephen V. | Biederman, Joseph; Peltonen, Leena; Owen, Michael J.; Kendler, Kenneth S.; Walsh, Dermot; Maier, Wolfgang; O'Neill, Francis A. | 15 | 3 | ||
| 2 | 8 | Hariri, Ahmad R. | Weinberger, Daniel R.; Glahn, David C.; Thompson, Paul M.; Heinz, Andreas; McGuire, Philip K.; Pine, Daniel S.; Goldman, David | 19 | 4 |
| 3 | 5 | Gelernter, Joel | Nestler, Eric J.; Kranzler, Henry R.; Duman, Ronald Stanton; Krystal, John Harrison | 20 | 9 |
| 4 | 3 | Li, Ming D. | Ma, Jennie Z.; Wang, Lei | 11 | 9 |
| 5 | 2 | Johnstone, Eve C.; Lawrie, Stephen M. | 9 | 9 | |
| 6 | 2 | Hashimoto, Kenji; Iyo, Masaomi | 10 | 8 | |
| 7 | 2 | Sweeney, John A.; Keshavan, Matcheri S. | 8 | 4 |
Table 1: The authors’ detail of co-authorship network (2007-2009).
The analysis on potential scientific research teams
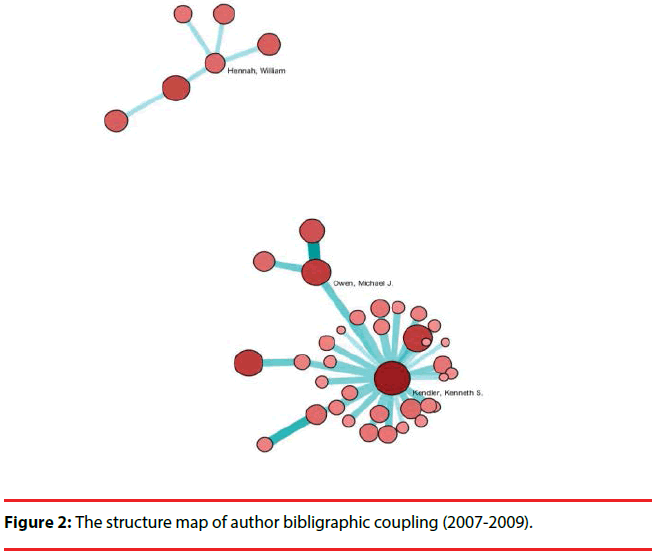
The network included 13786 nodes and 229918 lines. The weight was 1 to 160. In order to highlight the core author and lessen the scale of network, we set the weight more than 80, delete isolated nodes and get 2 sub networks including 41 nodes and 39 lines through MST-Pathfinder Algorithm (Figure 2). The biggest sub network included 35 nodes. Table 2 of the author bibliographic coupling from 2007 to 2009 was as listed. In sub-network 1, the core authors were Kendler, Kenneth S. working in Virginia Commonwealth University .They were coupling relationship and their research direction was the gene of schizophrenia. These coupling authors were widely in America, Canada, Australia, France, China, etc. Laurent, Claudine and Mallet, Jacques had the highest coupling strength. Through citing references, their common foci were related genes of schizophrenia and antipsychotic drugs for nerve center. In the second network, the core author was Hennah, William working in National Public Health Institute in Finland who were connected with coupling authors from Finland. The references which they cited not only had high contact ratio but also they really collaborated to publish papers together. It indicated their research direction was consistent mainly engaged in genes of mental disease and the study of neural pathway.
| Sub network |
Number of nodes | Core author | Other authors | Maximum Number of authored works | Maximum Weight |
|---|---|---|---|---|---|
| 1 | 35 | Kendler, Kenneth S. | Laurent, Claudine; Mallet, Jacques; Maier, Wolfgang;Lasseter, V. K.; Jay, M.; Alexander, Mohab;Wormley, Brandon;Gejman, Pablo V;Silverman, Jeremy M.;Ribble, R.; Levinson, Douglas F.;Nertney, D.;Holmans, P. A.; Liang, Kung-yee;Dikeos, D.;Mowry, B.; J Pulver, Ann E.; Papadimitriou, G.; Riley, B.; O'Neill, A.; Walsh, Dermot;Duan, J.;Wildenauer, D. B.; Norton, N.; Sanders, A. R.;Nestadt, Gerald;Lerer, F. B.; Crowe, Raymond R.; Godard, S.; Schwab, Sibylle G.;Albus, M. | 14 | 138 |
| Owen, Michael J. | O'Donovan, Michael C.; Williams, Nigel M. | 9 | 160 | ||
| 2 | 6 | Hennah, William | Suvisaari, Jaana;Partonen, Timo;Loennqvist, Jouko;Peltonen, Leena;Paunio, Tiina; | 6 | 85 |
Table 2: The authors’ detail of author bibligraphic coupling network (2007-2009).
▪ From 2010 to 2012
The analysis on domonant scientific research teams
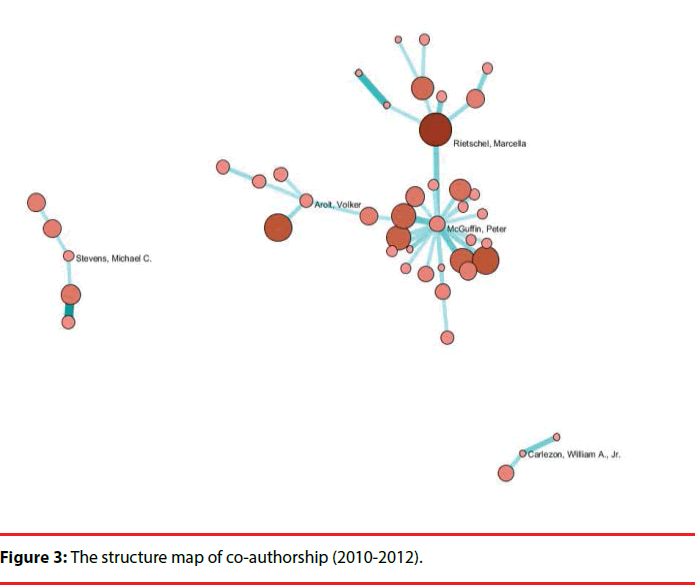
There were totally 2435 bibliographic data. The network included 13876 nodes and 97468 lines. The weight was 1 to 10. In order to highlight the core author and lessen the scale of network, we set the number of authored works more than 50, delete isolated nodes and get 3 sub-networks including 44 nodes and 41 lines through MSTPathfinder Algorithm (Figure 3). The biggest sub-networks included 36 nodes. Table 3 of the co-authorship from 2010 to 2012 was as listed. In sub-networks 1, there were 3 core authors named McGuffin, Peter working in King Coll London, Rietschel, Marcella working in Heidelberg University in Germany and Arolt, Volker working in University of Munster in Germany. McGuffin, Peter was the core author in this sub-network who collaborated with researchers in England, Germany, Scotland, Iceland, etc. The collaborators of Rietschel, Marcella also come from European country and he ever collaborated with McGuffin, Peter. The collaborators of Arolt, Volker almost come from Germany except for one from America. In the sub-network 2, the core author was Stevens, Michael C. working in Yale University and some collaborators come from Yale University, the others from other American universities. In subnetwork 3, the core author was . from Harvard University. His collaborator named Cohen, Bruce M also come from Harvard University and the other collaborator come from Mount Sinai School of Medicine in America.
| Sub network |
Number of nodes | Core author | Other authors | Maximum Number of authored works | Maximum Weight |
|---|---|---|---|---|---|
| 1 | 36 | McGuffin, Peter | Noethen, Markus M.;Maier, Wolfgang;van, den Berg Leonard H.;Andreassen, Ole A.;Werge, Thomas;Boomsma, Dorret I.;Sullivan, Patrick F.;Franke, Barbara;O'Donovan, Michael C.;Craddock, Nick;Djurovic, Srdjan;Rujescu, Dan;Ophoff, Roel A.;Penninx, Brenda W. J. H.;Gill, Michael;Weickert, Cynthia Shannon;Melle, Ingrid;St, Clair David;Kirov, G;Cichon, Sven;Owen, Michael J. | 19 | 5 |
| Rietschel, Marcella | Giegling, Ina;Kendler, Kenneth S.;Tiemeier, Henning;Bullmore, Edward T.;Peltonen, Leena;Robbins, Trevor W.;Weinberger, Daniel R.;Hofman, Albert | 24 | 7 | ||
| Arolt, Volker | Holsboer, Florian;Lesch, Klaus-Peter;Faraone, Stephen V.;Mueller-Myhsok, Bertram | 19 | 2 | ||
| 2 | 5 | Stevens, Michael C. | Slifstein, Mark;Krystal, John H.;Gelernter, Joel;Kranzler, Henry R. | 14 | 10 |
| 3 | 3 | Carlezon, William A., Jr. | Cohen, Bruce M.;Nestler, Eric J. | 12 | 4 |
Table 3: The authors’ detail of co-authorship network (2010-2012).
The analysis on potential scientific research teams
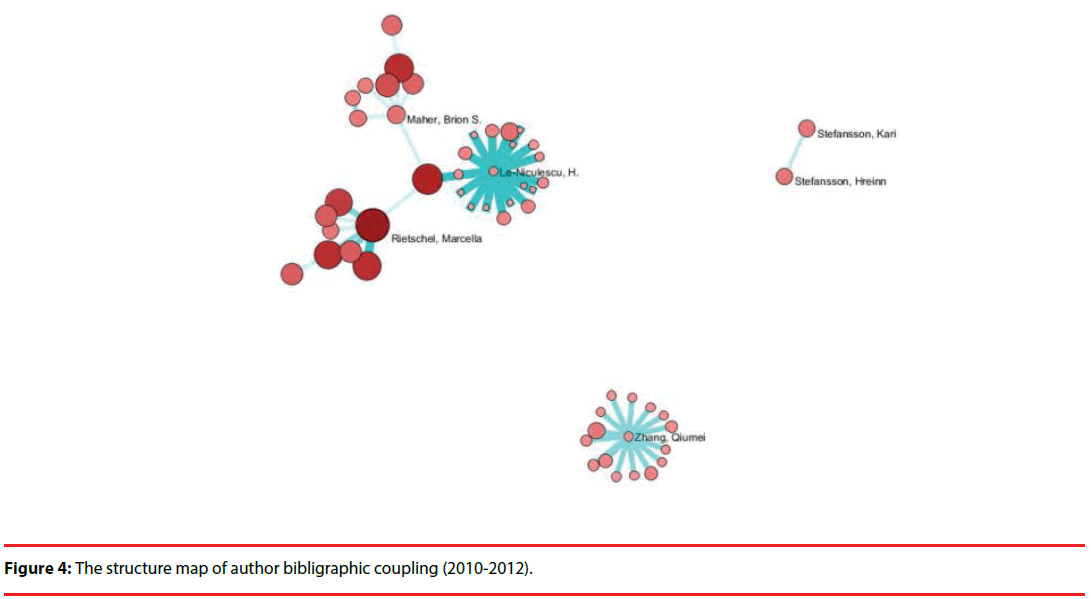
The network included 13876 nodes and 358549 lines. The weight was 1 to 206. In order to highlight the core author and lessen the scale of network, we set the weight more than 150, delete isolated nodes and get 2 sub-network including 54 nodes and 51 lines through MSTPathfinder Algorithm (Figure 4). The biggest sub-network included 36 nodes. Table 4 of the author bibliographic coupling from 2007 to 2009 was as listed. In sub-network 1, the core authors were Le-Niculescu, H. working in Indiana University, Maher, Brion S. working in Virginia Commonwealth University, O’ Donovan Michael C. and Rietschel, Marcella, both working in Cardiff University and Le-Niculescu, H.working in Heidelberg University in Germany. The coupling authors were mainly distributed in America and European countries such as England, Germany, etc. From Figure 4, O’ Donovan Michael C. who linked the three authors played an important role in the sub-network. Le-Niculescu, H. and Corvin, Aiden had the highest coupling strength. Their common foci were related genes of schizophrenia and the gene of major histocompatibility complex (MHC) for the role of neural plasticity. In the sub network 2, the core author named Zhang, Qiumei working in Jining Medical University in China collaborated with almost research institutes in China and a few in American. Zhang, Qiumei and Li, Jing had the highest coupling strength the research direction was the effect on working memory and brain morphology. In sub-network 3, there were two authors named Stefansson, Hreinn and Stefansson, Kari both from Hospital Reykjavik of National University in Iceland. They had close relationship, their cited references had high contact ratio and they published papers together. Through the references, they mainly studied related genes of schizophrenia and brainexpressed genes.
| Sub network |
Number of nodes | Core author | Other authors | Maximum Number of authored works | Maximum Weight |
|---|---|---|---|---|---|
| 1 | 36 | Le-Niculescu, H. | Ayalew, M.;Levey, D. F.;Jain, N.;Changala, B.;Patel, S. D.;Winiger, E.;Breier, A.;Shekhar, A.;Amdur, R.;Koller, D.;Nurnberger, J. I.;Corvin, Aiden.;Geyer, M.;Tsuang, M. T.;Salomon, D.;Schork, N. J.;Fanous, A. H.;O'Donovan, M. C.;Niculescu, A. B. | 7 | 206 |
| Maher, Brion S. | Kendler, Kenneth S.;Owen, Michael J.;Gill, Michael;Purcell, Shaun;Sklar, Pamela;Morris, Derek W.;Holmans, Peter | 17 | 153 | ||
| O'Donovan, Michael C. | 19 | 153 | |||
| Rietschel, Marcella | Sigurdsson, Engilbert;Rujescu, Dan;St Clair, David;Cichon, Sven;Werge, Thomas;Noethen, Markus M.;Giegling, Ina | 24 | 206 | ||
| 2 | 16 | Zhang, Qiumei | Chen, Min;Xu, Zhansheng;Zhai, Jinguo;Bao, Xin;Gu, Huang;Shen, Qiuge;Cheng, Lina;Chen, Xiongying;Wang, Keqin;Deng, Xiaoxiang;Ji, Feng;Liu, Chuanxin;Li, Jing;Dong, Qi;Chen, Chuansheng | 6 | 175 |
| 3 | 2 | Stefansson, Hreinn;Stefansson, Kari | 6 | 156 |
Table 4: The authors’ detail of author bibligraphic coupling network (2010-2012).
▪ From 2013 to 2015
The analysis on domonant scientific research teams
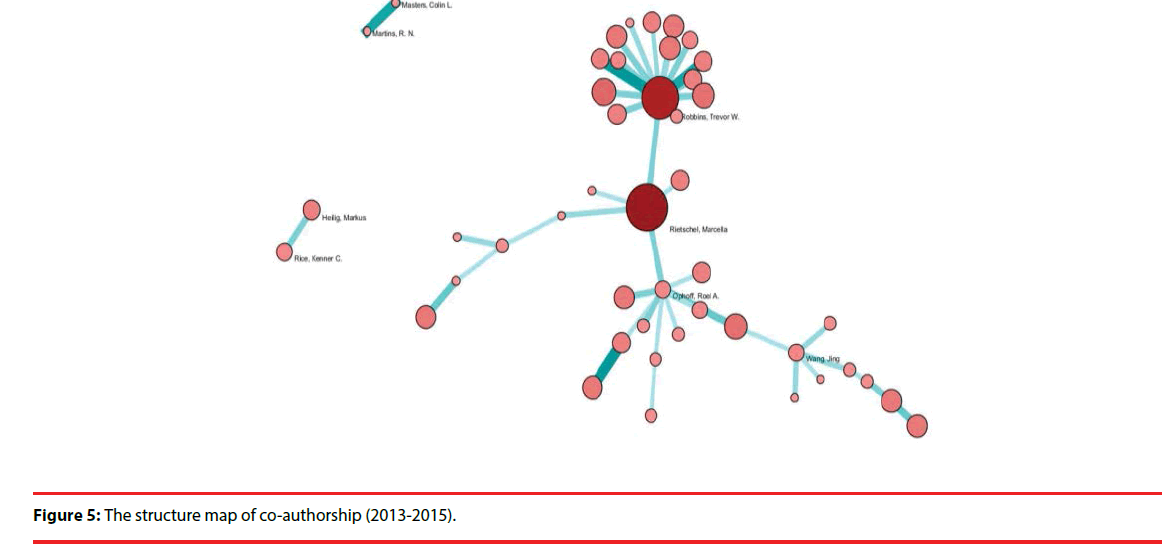
There were totally 2361 bibliographic data. The network included 16209 nodes and 190806 lines. The weight was 1 to 14. In order to highlight the core author and lessen the scale of network, we set the number of authored works more than 50, delete isolated nodes and get 3 sub-network including 46 nodes and 43 lines through MSTPathfinder Algorithm (Figure 5). The biggest sub-network included 35 nodes. Table 5 of the author bibliographic coupling from 2013 to 2015 was as listed. In sub-network 1, there were four authors. Robbins, Trevor W. working in University of Cambridge who collaborated with researchers almost from England, a few from Germany, Ireland, etc. The collaborators of Rietschel, Marcella working in Heidelberg University in Germany come from European countries. The collaborators of Ophoff, Roel A. working in Utrecht University widely came from European countries and Wang, Jing from Harvard University collaborated with researchers from American Universities. In sub-network 2, there were only 2 authors named Martins, R. N. working in Edith Cowan University and Masters, Colin L. working in The University of Melbourne in Australia. That the line linking them was darker indicated they collaborated each other closely. In sub-network 3, the two authors named Heilig, Markus and Rice, Kenner C. came from NIAAA (National Institute on Alcohol Abuse and Alcoholism) and National Institute of Drug Abuse in America.
| Sub network |
Number of nodes | Core author | Other authors | Maximum Number of authored works | Maximum Weight |
|---|---|---|---|---|---|
| 1 | 42 | Robbins, Trevor W. | Bullmore, Edward Thomas;Heinz, Andreas;Flor, Herta;Nees, Frauke;Banaschewski, Tobias;Paus, Tomas;Voon, Valerie;Schumann, Gunter;Mann, Karl;Gallinat, Juergen;Barker, Gareth J.;Buechel, Christian;Smolka, Michael N.;Garavan, Hugh | 24 | 8 |
| Rietschel, Marcella | Arolt, Volker;Kugel, Harald;Boomsma, Dorret I.;Yang, Jing;Mann, J. John;Gong, Qi-Yong;Li, Jennifer | 28 | 4 | ||
| Ophoff, Roel A. | Martin, Nicholas G.;Noethen, Markus M.;Mattheisen, Manuel;O'Donovan, Michael C.;Sklar, Pamela;Zhang, Yanan;Wang, Yumei;Owen, Michael J.;Cichon, Sven;Gill, Michael | 13 | 8 | ||
| Wang, Jing | Potenza, Marc N.;Pearlson, Godfrey D.;Glahn, David C.;Deary, Ian J.;Hofman, Albert;van, Duijn Cornelia M.;Ikram, M. Arfan | 13 | 4 | ||
| 2 | 2 | Martins, R. N.;Masters, Colin L. | 9 | 7 | |
| 3 | 2 | Heilig, Markus;Rice, Kenner C. | 12 | 3 |
Table 5: The authors’ detail of co-authorship network (2013-2015).
The analysis on potential scientific research teams
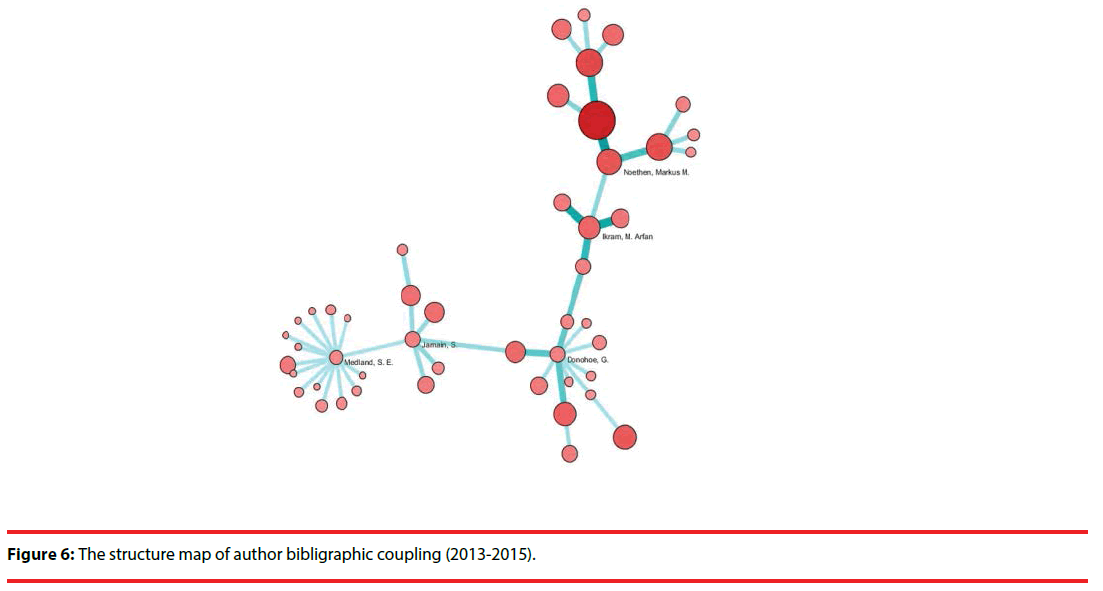
The network included 16209 nodes and 282187 lines. The weight was 1 to 265. In order to highlight the core author and lessen the scale of network, we set the weight more than 150,delete isolated nodes and get a coupling network including 48 nodes and 47 lines through MSTPathfinder Algorithm (Figure 6). Table 6 of the author bibliographic coupling from 2013 to 2015 was as listed. There were 5 core authors and they were Medland, S. E. in QIMR Berhgofer Medical Research Institute in Australia, Jamain, S. working in Fdn FondaMental in France, Donohoe, G. working in University of Dublin in Ireland, Ikram, M. Arfan working in Netherlands Consortium Hlth Ageing and Noethen, Markus M working in University of Bonn in Germany. The coupling authors mainly distributed in America, Canada, Australia and several European countries such as Britain, France, Germany, etc. The core authors connected directly or indirectly only through the one coupling author and all coupling authors constitute the large network. Noethen, Markus M. and Rietschel, Marcella had the highest coupling strength and their common foci were the genes of Alzheimer’s disease and cognitive ageing.
| Sub network |
Number of nodes | Core author | Other authors | Maximum Number of authored works | Maximum Weight |
|---|---|---|---|---|---|
| 1 | 48 | Medland, S. E. | Stein, J. L.;Etain, B.;Shi, L.;Hibar, D. P.;Shi, H.;Lin, Q.;Lewis, Cathryn M.;Vasquez, A. Arias;Czamara, Darina;Hargreaves, A.;Thompson, Paul M.;Launer, Lenore J.;Hultman, C.;Henry, C. | 6 | 163 |
| Jamain, S. | Landen, Mikael;Bergen, SE;Sullivan, Patrick F.;Bellivier, F.;Leboyer, Marion | 8 | 183 | ||
| Donohoe, G. | Corvin, Aiden;Schulze, Thomas G.;Gill, Michael;Franke, Barbara;Gan, L.;Toga, A. W.;Martin, Nicholas G.;Luo, X-j;Li, Ming;Su, B.;Morris, D. W. | 12 | 214 | ||
| Ikram, M. Arfan | Wright, M. Jerry, Jr.; Bis, Joshua C.; Seshadri, Sudha | ||||
| Noethen, Markus M. | Rietschel, Marcella;Mattheisen, Manuel;Heinz, Andreas;Walter, Henriette;Erk, Susanne;Meyer-Lindenberg, Andreas;Cichon, Sven;Debette, Stephanie;Fornage, Myriam;Mueller-Myhsok, Bertram | 28 | 265 | ||
Table 6: The authors’ detail of author bibligraphic coupling network (2013-2015).
Discussion
Scientific research team is scientific research group who shared the resources of scientific research group and worked together, but these researchers probably do not belong to the same agency. The most important feature of scientific research was cooperation and the scientific research has become a scientific research main part, especially the natural scientific research. Medical research is not also exceptional, more and more medical scientific research achievements of output was the result of team work. The study used the software Sci2 to analyze the scientific research teams during above three stages in neuropsychiatry field. We can detect the following rules.
a. The network had the situation of continuous polymerization. Both the authorship network and the author coupling network had the convergence, decrease, increase of network and the increasing of core authors’ direct relationship. It indicated the authors were connected stronger and the team working was more important. At the same time, it can be seen the research direction of most research literature had the status of convergence. It asked authors to pay attention to the new research hotspots including interdisciplinary collaboration based on strengthening the team collaboration in order to push neuropsychiatry into the direction of development healthily and rapidly.
b. The core authors replaced and the scientific research area shifted frequently. Only Rietschel, Marcella was the core author in the two stages. It indicated that neuropsychiatry developed rapidly and people of talent come forth in large number. In other words, the core authors were American researchers in the first stage. But in the second and third stage, the core authors were European researchers, of course American and Australian researchers also occupied certain proportion. Researchers in different countries and regions in the world should also strengthen collaboration with leading scientific research regions to improve scientific research level.
c. The co-authorship network and the coupling network had superposition, but a big difference. The prolific authors in the coauthorship network had a real collaborated relationship, but high coupling authors in coupling network had not probably real collaborated relationship. If a few authors not only had high coupling relationship but also real collaborated relationship, they belonged to the same research direction and research team. For example, Hennah, Willam as the core author of research team at the first stage and Stefansson, Hreinn and Stefansson, Kari as the core author of research team in the second stage. There were few scientific research teams. In this study, the above research team really existed, but a few. It required that the authors in coupling network strengthened academic exchanges and direct collaboration.
In this way, we can change the potential research team into the dominant research team in order to use the advantages of scientific research teams efficiently and produce more scientific research achievements.
Acknowledgements
The authors gratefully acknowledge the support for this study from “Analysis on Scientific Collaboration and Trends Prediction of Research Fronts in Psychiatry Field (No. 71503152)”, awarded by National Natural Science Foundation of China. This study is also supported by Program for the Outstanding Innovative Teams of Higher Learning Institutions of Shanxi (OIT).
References
- Qi Yu, Shao H, Duan Z. Research groups of oncology co-authorship network in China. Scientometrics89(1), 553-567 (2011).
- Van Raan AFJ. Scaling Rules in the science system: Influence of field-specific citation characteristics on the impact of research groups. J.Am. Soc. Inform. Sci. Technol59(4), 565–576 (2008).
- Stuart CY, Robert EH. Neuro-psychiatry and the future of psychiatry and neurology. Am. J. Psychiatry159(8), 1261 (2002).
- Sabsbin M. Tuming point of twentieth-century American psychiatry.Am. J. Psychiatry147(8), 1267 (1990).
- Ma RM, Ni CQ. Author Coupling Analysis: An Exploratory Study on a New Approachto Discover Intellectual Structure of a Discipline. J. Lib. Sci. China38(198), 4-11(2012).
- Vladutz G, Cook J. Bibliographic Coupling and Subject relatedness. American Society for Information Science Proceedings of the 47th ASIS Annual Meeting. Philadelphia: Institute for Science Information204-207 (1984).
- Sci2 Tool [EB /OL] (2013).
