Review Article - Imaging in Medicine (2011) Volume 3, Issue 1
Update on liver MRI at 3T
Sriyesh Krishnan1 and Elizabeth M Hecht†1
1Department of Radiology, University of Pennsylvania School of Medicine, 3400 Spruce St, Philadelphia, PA, 19104, USA
- *Corresponding Author:
- Elizabeth M Hecht
Department of Radiology
University of Pennsylvania School of Medicine 3400 Spruce St, Philadelphia
PA, 19104, USA
Tel.: +1 215 615 6560
Fax: +1 215 662 3037
E-mail: elizabeth.hecht@uphs.upenn.edu
Abstract
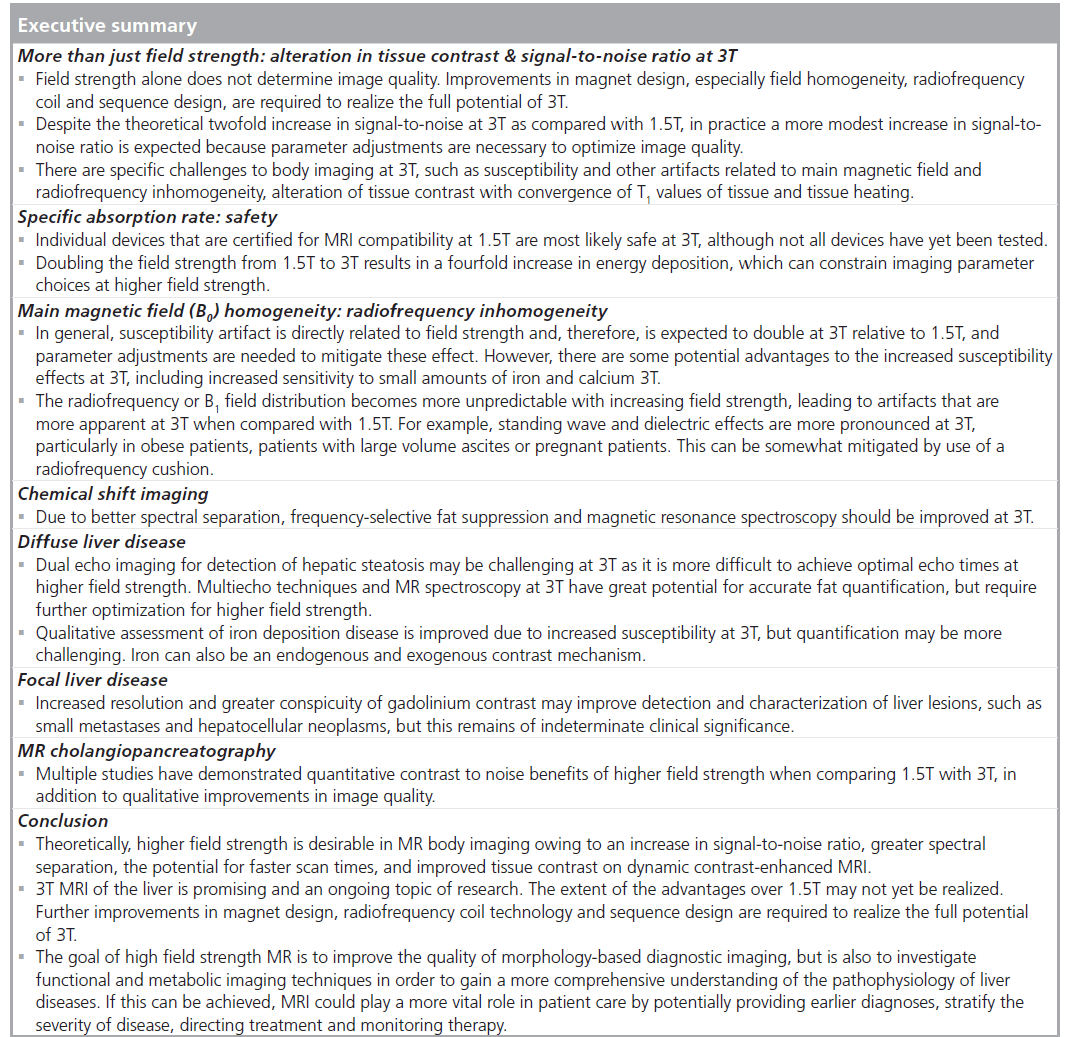
3T MRI of the liver has become widely available and is routinely utilized in the clinical setting, but published scientific data comparing 1.5T with 3T is limited. Theoretically, higher field strength is desirable in body imaging owing to an increase in signal-to-noise ratio, greater spectral separation, the potential for faster scan times and improved tissue contrast on dynamic contrast-enhanced MRI. Yet, there are specific challenges to body imaging at 3T. Despite the theoretical benefits of higher field strength, tradeoffs are often required to achieve optimal image quality, for example increasing bandwidth to reduce chemical shift artifact and thereby sacrificing signal-to-noise. In some instances, such as pregnancy or in the setting of high-volume ascites, 1.5T field strength may be preferred. This article highlights the challenges and necessary adjustments required to effectively image the liver at 3T, while discussing recent studies and ongoing advances in highfield imaging as it impacts the diagnosis and monitoring of diffuse and focal liver diseases.
Keywords
3T; diffuse liver disease; focal liver disease; high-field MRI; liver
In recent years, the introduction of high-field MR magnets into routine clinical practice has been met with great optimism. While many benefits of 3T were readily apparent in neurologic and musculoskeletal MRI, the benefits were not immediately evident for body imaging. In fact, as conveyed in many comprehensive reviews [1–3], 3T imaging poses significant challenges as compared with 1.5T imaging for abdominal and pelvic applications. In addition, even several years after the introduction of 3T imaging into the clinical realm, published scientific data comparing 3T with 1.5T for body imaging remain limited. Theoretically, higher field strength body MRI is desirable because of an increase in signal-tonoise ratio (SNR), greater spectral separation, the potential for faster scan times and improved tissue contrast on dynamic contrast-enhanced MRI. However, despite the theoretical benefits of 3T, tradeoffs are often required to achieve optimal image quality. In some instances, such as pregnancy or in the setting of high-volume ascites, 1.5T field strength may be preferred. This article highlights some of the special considerations that are necessary to effectively image the liver at 3T, while discussing recent studies and advances in high-field imaging as it impacts the diagnosis and monitoring of diffuse and focal liver diseases.
More than just field strength
While high field strength is potentially advantageous for body imaging applications, high field alone does not improve image quality or patient throughput. Homogeneity of the main magnetic field (static field, or B0) and radiofrequency (RF) pulses (B1) is very important for high-quality imaging, and is more challenging to achieve with increasing field strength. Coil design, gradient performance, and RF transmitter and sequence design also significantly impact the overall quality of output from a MR scanner regardless of field strength.
Of course, basic parameter and protocol changes are necessary when shifting protocols from 1.5T to 3T imaging. Simply maintaining current 1.5T sequence parameters, even when possible, does not optimize image quality for 3T and may even result in poor lesion conspicuity or decreased image contrast.
Alteration in tissue contrast at 3T
With increasing field strength, the T1 relaxation time of tissue is prolonged. However, the extent of T1 prolongation is different for various tissues at 3T, resulting in altered relative T1 tissue contrast. Tissue contrast can be both positively or negatively affected as a result of higher field strength, depending on the circumstances and tissues involved [4–6]. In general, increasing field strength and lengthening T1 ultimately leads to a convergence of T1 values amongst tissues, thus impacting sequence design and parameter selection. For example, for routine gradient echo imaging at 3T, it is necessary to lengthen the repetition time and adjust the flip angle in order to maximize tissue contrast. Interestingly, the T1 relaxation of gadolinium chelate contrast agents is also prolonged at higher field strengths, but to a lesser degree relative to background parenchyma. This suggests that the contrast between gadolinium chelates and background tissue will increase at higher field strength, which may lead to greater lesion conspicuity [7,8]. Unfortunately, the T2* effects of gadolinium chelates are more pronounced at higher field strength, and therefore a lower dose or a decreased rate of contrast administration may be necessary to avoid artifacts related to the T2-shortening effects of these contrast agents [8].
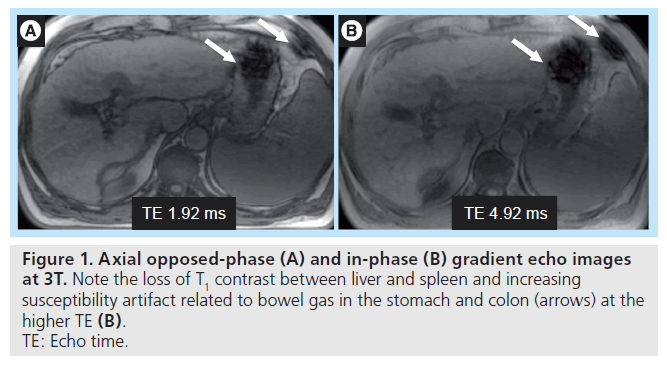
With increasing field strength, T1 relaxation times lengthen, while T2 relaxation shortens but to a lesser degree. Nonetheless, susceptibility (T2*) effects become more pronounced with increasing field strength (Figure 1). T2* effects lead to B0 field in homogeneity, especially at air–tissue interfaces or in the region of indwelling metallic devices and surgical clips [9]. Simple parameter adjustments should be made to mitigate these artifacts, including increasing the receiver bandwidth and thereby permitting a shorter repetition time, which in turn allows a shorter echo time (TE), decreasing echo train length (ETL), and smaller voxel size. Localized shimming should also be employed. As a result of faster T2 relaxation, fast-spin echo or turbo-spin echo sequences are more affected by blurring artifacts at 3T than at 1.5 T [10]. Minimizing TE and ETL can help reduce T2 blur, while parallel imaging can further help minimize ETL.
Figure 1. Axial opposed-phase (A) and in-phase (B) gradient echo images at 3T. Note the loss of T1 contrast between liver and spleen and increasing susceptibility artifact related to bowel gas in the stomach and colon (arrows) at the higher TE (B). TE: Echo time.
Signal-to-noise ratio
The primary motivation for imaging at higher field strength is the promise of increased SNR. In theory, the SNR is directly proportional to field strength, resulting in an expected twofold increase in SNR at 3T relative to a 1.5T magnet. As noted above, imaging at higher field strength leads to an increase in the T1 relaxation time and a decrease in the T2 relaxation time of tissues. In order to optimize image contrast and minimize artifacts, parameter adjustments are necessary, including increasing bandwidth, and such adjustments necessarily compromise a degree of the overall gain in SNR that could be achieved by imaging at 3T [2]. In practice, the resulting SNR increase when imaging at 3T is typically in the range of 1.6- to 1.8-fold greater when compared with 1.5T, rather than twofold [2].
Nonetheless, there are many potential advantages to even this smaller degree of SNR gain. The additional signal-to-noise can be utilized in several different ways, including trading SNR to achieve shorter scan acquisition time or to increase spatial resolution. The combination of baseline increased SNR at 3T and innovative coil design permits the implementation of higher order parallel imaging, including multidirectional parallel imaging, higher than typically used in 1.5T.
Specific absorption rate
A major drawback of imaging at 3T is an increase in the specific absorption rate (SAR) due to increased energy deposition at higher field strength. SAR is directly proportional to the square of the field strength, therefore doubling the field strength from 1.5T to 3T results in a fourfold increase in energy deposition. Given theoretical concerns for tissue damage from excess heating, SAR levels must be carefully monitored to ensure the patient is not adversely affected during the course of a scan. Current US FDA guidelines limit SAR to 4 W/kg over the entire body for up to 15 min, or 8 W/kg over any specific area in the head and torso for up to 5 min [101].
Specific absorption rate limits can easily be met when employing RF-intensive pulse sequences, such as half Fourier single-shot, fast-spin echo or T2-weighted, turbo-spin echo. When SAR limits are reached a choice has to be made, and often the number of slices or flip angle must be reduced to limit power deposition to the patient, thereby reducing coverage and compromising image contrast, respectively. There are several other alternative parameter adjustments that can be employed in order to mitigate SAR, including increasing repetition time and increasing RF pulse duration. Parallel imaging is also recommended to reduce SAR. Unfortunately, these adjustments will also decrease SNR and alter tissue contrast. Ultimately, innovative coil and sequence design are needed to improve image quality.
T2 sequences tend to be more SAR intensive and thus more challenging to employ at 3T. As mentioned above, reducing flip angle can help reduce SAR, but lowering the flip angle significantly will compromise signal and contrast. RF pulse amplitude can be reduced, leading to longer RF pulses and longer echo trains at the expense of lengthening acquisition time and increasing T2 blur. Variable-rate selective excitation-type sequences have the potential to reduce SAR by modifying the amplitude and shape of the RF pulse maintaining image contrast [11]. Variable flip angle techniques, such as sampling perfection with application optimizing contrasts using flip angle evolutions, hyperechoes and transitions between pseudo steady states, can also mitigate SAR by manipulating the flip angle to increase ETL and effective TE [12–14]. These techniques may be employed with parallel imaging to further reduce SAR and T2 blur.
Safety
According to the most recent guidelines from the US FDA, there is no significant inherent risk from a static magnetic field when imaging clinical patients older than 1 month of age on a high field strength magnet up to 8T [101].
However, any metallic object or implantable device can potentially be adversely affected when placed in a high field strength magnet. Individual devices that are certified for MRI compatibility at 1.5T are likely to be safe at 3T, although this has not necessarily been proven. Various resources publish MRI compatibility for individual devices, allowing for verification of safety prior to image acquisition, including the Institute for Magnetic Resonance Imaging Safety, Education and Research website [102]. Of the more than 2300 devices tested on the website, over 900 have been certified at 3T or higher field strength [15]. While promising, the possibility exists that a device that is ‘weakly’ ferromagnetic at 1.5T will have significant interaction with a high strength magnetic field such as 3T [16].
There are additional safety concerns when imaging during pregnancy, and while imaging at 1.5T is generally considered safe, the effect of higher field strength on a fetus is unknown. Some have suggested that first trimester MRI should be avoided if clinically possible to help limit SAR concerns for the fetus. Another consideration is the potential for noise-related damage to the hearing of a fetus after 24 weeks, as there is no adequate way to provide hearing protection for the fetus [17]. At this time, it appears prudent to image all pregnant patients on a 1.5T magnet if available, both for potential (unproven) safety concerns and also due to increased artifacts that are encountered when imaging the gravid amniotic fluid-filled uterus at higher field strength. Of course, the benefits and risks must be weighed and discussed with each patient, particularly if the imaging alternative exposes the fetus to radiation.
Main magnetic field (B0) homogeneity
Magnetic susceptibility artifact relates to the ability of a substance to distort the main magnetic field. In general, susceptibility artifact is directly related to field strength and, therefore, is expected to double at 3T relative to 1.5T [2]. The increased susceptibility can be partially alleviated by increasing bandwidth and consequently minimizing TE, but at the cost of SNR. Specifically, the distortion predominantly occurs at air–tissue interfaces, such as bowel–gas and heart–lung, and around metallic clips and prostheses. For this reason, for example, bowel imaging at 3T poses additional challenges, particularly if using air contrast. Parameter adjustments, including minimizing voxel size, TE and ETL, possibly in conjunction with parallel imaging, as well as increasing bandwidth can also be helpful. However, certain sequences are more vulnerable to these effects, including steady-state free precession and echo planar imaging commonly used in the liver for diffusion-weighted imaging (DWI). Localized shimming may help improve image quality, particularly for steady-state free precession sequences.
Alternatively, one can accentuate the positive, noting that imaging at 3T increases sensitivity to small amounts of iron (e.g., in iron deposition diseases or when using iron-containing ferromagnetic contrast agents), calcium, and to foci of gas within the biliary tree or peritoneal cavity. Sensitivity to iron-containing contrast agents, such as ultra-small superparamagnetic iron oxides (SPIOs), are expected to increase at 3T, which may increase conspicuity of abnormal lymph nodes as well as diffuse and focal liver diseases.
Blood oxygenation level dependent (BOLD) contrast imaging is another technique with potential at high field. BOLD detects blood flow without the use of exogenous contrast agents. The technique is sensitive to the local susceptibility effects induced by iron within the heme of deoxyhemoglobin. Alterations in the ratio of oxy- (diamagnetic) to deoxy-hemoglobin (paramagnetic) may be appreciated on MR, reflecting subtle microvascular differences in oxygen demand and regional oxygenation. The BOLD effect is typically used for functional brain imaging, but is also being explored for measuring hypoxia in response to therapy for abdominal neoplasms. One animal study explored the feasibility of using BOLD for assessing treatment response following chemoembolization therapy for hepatocellular carcinoma (HCC) [18]. This technique inherently suffers from lower SNR, so higher field strength would be favorable for this imaging technique, although quantification becomes progressively more challenging with either iron-based imaging technique, due to the increase in susceptibility at increasing field strength.
RF inhomogeneity
As field strength increases, RF homogeneity becomes more difficult to achieve and maintain. The Larmor frequency of protons (i.e., hydrogen nuclei) is approximately 64 MHz at 1.5T and increases to 128 MHz at 3T. While the precessional frequency needed to excite protons increases, the wavelength of the RF pulse in a conductive medium decreases and is further reduced by interaction with human tissue due to its high electrical permittivity. The RF or B1field distribution becomes more unpredictable with
increasing field strength, leading to artifacts that are more apparent at 3T when compared with 1.5T.
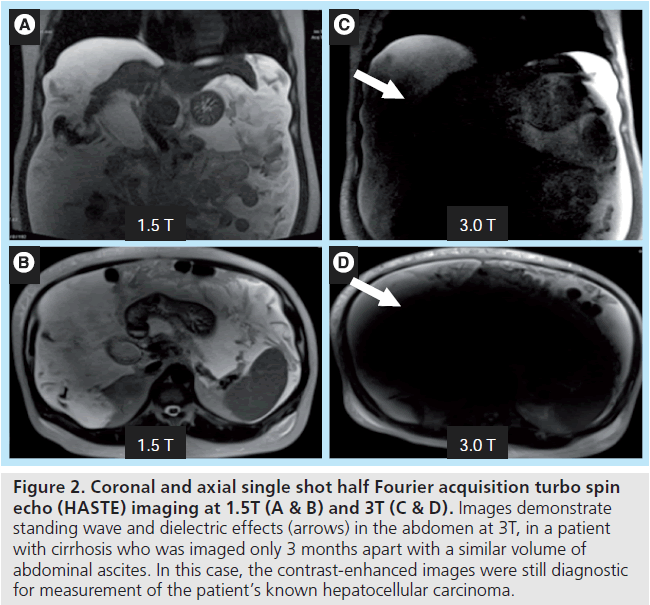
A particularly obtrusive combination of artifacts can arise when attempting to image a larger patient or a fluid-filled abdominal cavity, often patients with either large volume ascites due to liver failure/cirrhosis or a gravid uterus (Figure 2). Patient geometry and composition stimulates two disruptive artifacts, ‘standing wave’ and ‘dielectric’ effects, which can occur concomitantly. The higher frequency B1 transmit field used at 3T, designed for use at 128 MHz, has a modified (shorter) wavelength of approximately 30 cm in water-containing tissues as compared with 1.5T. When the field of view of the study approximates this wavelength, and as the geometry of the patient gets closer to filling this field of view, there can be marked variations in the brightness/darkness of the image due to constructive and destructive interference by the standing wave [2].
Figure 2. Coronal and axial single shot half Fourier acquisition turbo spin echo (HASTE) imaging at 1.5T (A & B) and 3T (C & D). Images demonstrate standing wave and dielectric effects (arrows) in the abdomen at 3T, in a patient with cirrhosis who was imaged only 3 months apart with a similar volume of abdominal ascites. In this case, the contrast-enhanced images were still diagnostic for measurement of the patient’s known hepatocellular carcinoma.
In addition, there are ‘conducting artifacts’ or ‘dielectric effects’ caused by increased RF field attenuation in a patient with ascites or amniotic fluid. In this setting, the increased conductivity of the tissues leads to formation of RF eddy currents that oppose the overall RF magnetic field, resulting in signal attenuation [19]. These artifacts are typically overcome with the easy solution of placing an RF cushion over the patient. Essentially, this cushion contains material with a high dielectric constant and a low conductivity medium, which serves to displace the artifact away from critical structures by altering the patient’s geometry and changing the phase of the RF standing waves [20].
Commercially used postprocessing filters can also serve to mask the effect but do not solve the problem. Innovations in coil design are required to address the problem of RF inhomogeneity. If the coils can be automatically adjusted to compensate for tissue–coil interactions, then highfield MR examinations can be tailored to the patient. Transmit parallel imaging techniques are also promising, and may be used to optimize RF waveforms to accelerate imaging, improve signal homogeneity and reduce SAR.
Additional control of field homogeneity may be achieved using newly described techniques for transmit parallel imaging [21,22]. These techniques excite entirely distinct patterns in each element of a transmit coil array by driving each coil with a distinct current waveform, rather than merely with a distinct amplitude and phase, as in the case of RF shimming. Suitably optimized waveforms may be designed to accelerate complex RF pulses, but also to improve signal homogeneity and reduce SAR [22,23].
Chemical shift imaging
There are two distinct kinds of chemical shift artifact. A chemical shift of the first kind is related to characteristic differences in precessional (Larmor) frequency between fat and water protons. Since a frequency gradient is employed in order to spatially encode information along a given axis (i.e., the frequency encoding dimension), the chemical shift artifact results in a misregistration of fat and water protons along this axis. The magnitude of this difference in frequency is proportional to the field strength of the magnet, and thus is increased at 3T with the pixel width of the artifact twice that at 1.5T for the same bandwidth. Therefore, even higher bandwidths are required at 3T to diminish this artifact at the cost of SNR.
Chemical shift artifact of the second kind is related to signal loss (intravoxel phase-cancellation) in the setting of intravoxel fat and water. Essentially, signals from fat and water within a single voxel causes signal dropout at a given echo time, while at another TE the signal from fat and water are additive. This artifact provides the basis for chemical shift imaging, where inphase (additive) and opposed-phase (subtractive) images are created at specifically chosen TEs. The specific TEs required for in-phase and opposed-phase gradient echo imaging vary by field strength. The Larmor frequency at 3T is twice that at 1.5T, leading to double the spectral separation between fat and water protons, resulting in faster optimal echo times. At 1.5T, the optimal TEs are 2.2 ms (opposed-phase images) and 4.4 ms (in-phase images). At 3T, the optimal TEs are 1.14 (opposed-phase) and 2.28 ms (in-phase).
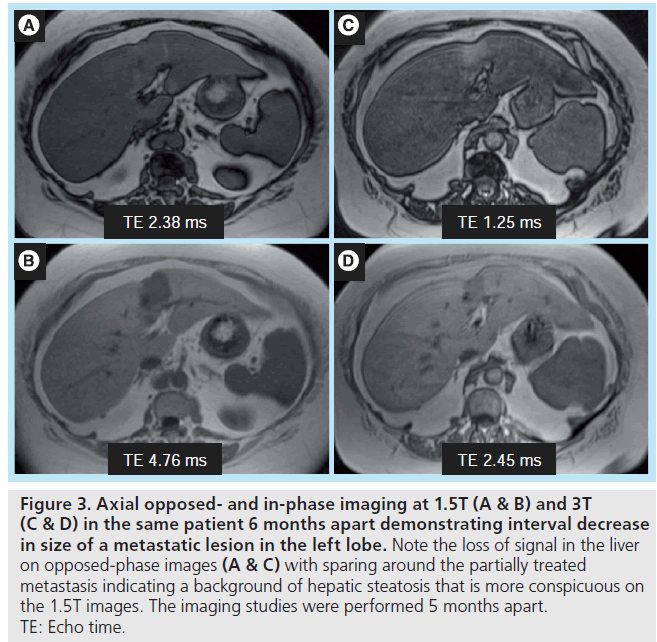
The sensitivity to detecting intravoxel fat is also affected by the chosen TE. Depending on the 3T system and imaging parameters, imaging with the optimal TEs of 1.14 and 2.28 ms may not be possible in a single dual echo breath hold sequence due to bandwidth constraints. One solution is to perform out-of-phase imaging at 1.14 ms, with in-phase imaging at the second echo, 4.56 ms. Based upon the chosen combination of TEs, signal intensity thresholds for detecting intravoxel fat need to be adjusted appropriately, whether imaging at 1.5T or 3T, as had been demonstrated in evaluation of adrenal adenomas [24–26]. In addition, owing to increased precessional frequency at 3T, the TEs at which fat and water protons are in-phase and opposed-phase are more closely spaced at higher field strength. The qualitative detection of liver steatosis at the shortest TE combination possible may be more challenging, especially when there are small amounts of fat (Figure 3). The quantitative threshold for detecting intravoxel fat will also most likely need to be reduced.
Figure 3. Axial opposed- and in-phase imaging at 1.5T (A & B) and 3T (C & D) in the same patient 6 months apart demonstrating interval decrease in size of a metastatic lesion in the left lobe. Note the loss of signal in the liver on opposed-phase images (A & C) with sparing around the partially treated metastasis indicating a background of hepatic steatosis that is more conspicuous on the 1.5T images. The imaging studies were performed 5 months apart. TE: Echo time.
Importantly, at 3T it is especially critical to acquire the opposed-phase data at the shorter TE due to the confounding effects of T2*, which inevitably leads to ambiguity in determining the presence of fat or iron in tissue. If opposed-phase imaging is performed at a longer TE compared with in-phase imaging, signal loss may be due to either susceptibility effects from iron deposition or intravoxel fat content.
There are two major advantages to the increase in spectral separation at 3T. Increased spectral separation between fat and water protons is favorable for frequency-selective fat suppression techniques. Improved fat suppression could lead to increased lesion conspicuity and decreased artifacts related to inhomogeneous fat suppression. Greater spectral separation between metabolite peaks, combined with higher signal-to-noise at 3T, is very favorable for 1H proton MR spectroscopy. MR spectroscopy has been of limited use at 1.5T because of the long scan times and poor spectral resolution. Higher SNR and spectral separation could lead to shorter scan times and small voxel size imaging, particularly if combined with parallel imaging and respiratory navigator techniques. The potential challenges include increasing susceptibility effects, RF inhomogeneity and shorter T2 relaxation.
Diffuse liver disease
Hepatic steatosis
Nonalcoholic fatty liver disease is an increasingly common cause of chronic liver disease in children and adults in the USA, and can progress to nonalcoholic steatohepatitis. Patients with nonalcoholic steatohepatitis are at increased risk for developing cardiovascular and hepatic complications, including cirrhosis, hepatic failure and HCC [27–32].
While there are qualitative and semiquantitative approaches for quantification of liver steatosis at MR, there is increasing demand for an accurate and reproducible quantitative method in order to diagnose, grade and monitor therapy in the setting of liver steatosis.
At MRI, typically, hepatic steatosis is detected with dual echo (in- and opposed-phase) imaging, marked by signal loss on opposed-phase images. However, this method is primarily qualitative, or at most semiquantitative. The inherent problem with a dual echo approach is ambiguity in distinguishing between fatdominant versus water-dominant fatty tissue, because only the magnitude of signal intensity is reconstructed, not the phase data. It does not correct for T1 and T2* relaxation effects, nor is it sensitive to all chemical moieties of fat [28]. Multiecho gradient echo is very promising for resolving the fat–water ambiguity problem, as it acquires both magnitude and phase data, and it can also serve as a mechanism for achieving more homogeneous fat suppression. However, T2* correction is required when greater than three echoes are acquired. The iterative decomposition of water and fat with echo asymmetry and least-squares estimation (IDEAL) method is a multiecho technique that can quantify fat, generates fat-only, water-only, in-phase and opposed-phased image data sets from a single acquisition [33], and may be used to produce an alternative, robust method of fat suppression [34].
T1 effects also need be considered when performing these gradient echo techniques because lipid has a relatively short T1, and stronger T1 weighting will suppress water signal and amplify fat signal. Low flip angle imaging is preferred when using this technique. Another method of interest is the multi-interference technique, which uses the multi-echo approach with T2* correction but also corrects for multiple fat peaks based on reference spectroscopic data [35].
Interestingly, multiecho fat quantification techniques also permits T2* mapping, which can be used to estimate iron content in the liver [36–38]. However, iron quantification at 3T becomes even more challenging owing to susceptibility effects [39]. While multi-echo T2* approaches can be successful at detecting liver, fat or iron content when there is combined disease, detection and quantification is more difficult. Thus, novel approaches to decomposition are actively being pursued [40,41].
Proton MR spectroscopy is considered the most accurate method to quantify fat in the liver [42,43], but it is typically limited to singlevoxel assessment due to acquisition time and respiratory motion. These obstacles may be partially overcome at 3T due to the greater spectral separation and higher SNR. With the higher SNR, parallel imaging could be implemented more easily, and can either further shorten scan time or permit higher resolution imaging. Respiratory navigated proton MR spectroscopic techniques are also favorable for body imaging, particularly at 3T.
Hemochromatosis
There are two distinct forms of hemochromatosis, primary (genetic) hemochromatosis and secondary hemochromatosis, both of which are marked by abnormal iron deposition in the liver and other organs. Genetic hemochromatosis, caused by a mutation on chromosome six, is an autosomal recessive disease with increased gastrointestinal resorption of iron leading to subsequent hepatic, pancreatic and myocardial deposition. In advanced cases, genetic hemochromatosis can lead to cirrhosis and increase risk for HCC. Secondary hemochromatosis is frequently caused by iron overload due to multiple blood transfusions for anemia, and in contrast to primary hemochromatosis, affects the spleen and bone marrow with relative sparing of the pancreas and myocardium.
At MRI, hepatic iron deposition is demonstrated by lower-than-expected signal intensity on T2 and T2* imaging. Gradient echo T2* imaging is most sensitive to detecting hepatic iron deposition. Skeletal muscle, which does not take up iron, provides a useful reference standard and hemochromatosis can be reliably diagnosed if hepatic parenchyma is lower in signal intensity than a normal spleen. The distribution of iron among extrahepatic organs can be useful for distinguishing between primary and secondary forms of the disorder. Dual echo in-phase and opposed-phase imaging can also be used to detect hepatic iron deposition with a loss in signal intensity within the liver on the longer TE acquisition.
Given the increased susceptibility artifact, secondary to iron deposition at higher field, imaging at 3T should provide a theoretical benefit in evaluation of iron deposition disease. However, quantification becomes increasingly difficult with increasing field strength due to susceptibility effects. Nonetheless, qualitative assessment will likely be improved at 3T, and iron can be used as an endogenous and exogenous contrast mechanism. HCC does not contain iron and becomes quite conspicuous in a background of diffuse liver iron deposition. When compared with the same TE at 1.5T and 3T, a liver with iron content will lose more signal due to susceptibility effects at 3T, causing an HCC to most likely become more conspicuous even in the absence of any contrast administration (Figure 4).
Figure 4. Patient with cirrhosis and hepatocellular carcinoma. Axial fat suppressed T2 turbo spin echo image at 3T (A) demonstrates diffuse low signal intensity in the liver and spleen as compared with skeletal muscle, with a focal T2 hyperintense hepatocellular (HCC) in the left lobe (arrow). Corresponding axial opposed-phase (B) and in-phase (C) images, performed at a TE of 1.3 and 4.6 ms respectively, demonstrate signal loss in the liver and spleen on the longer TE sequence due to iron deposition. Note the long TE sequence, the increased conspicuity of the HCC against the background diffuse iron deposition in the liver. Also note a curvilinear focus of signal loss (short arrow) within the HCC on the opposed-phase image, indicating the presence of microscopic lipid with the HCC. TE: Echo time.
Liver fibrosis & cirrhosis
Chronic liver diseases, such as chronic hepatitis C and nonalcoholic fatty liver disease, can lead to liver fibrosis, cirrhosis, end-stage liver disease and HCC, and are on the rise in the USA and worldwide [44]. Chronic liver diseases will greatly impact the healthcare system as a significant cause of morbidity, and mortality and healthcare cost [45]. Liver biopsy has limitations, including sampling error, reproducibility and risk of serious complications. Noninvasive, quantitative methods of detecting fibrosis and chronic liver disease are critical for early diagnosis and monitoring of therapeutic interventions. In addition to morphologic changes, studies have explored 1H spectroscopy, diffusion, perfusion weighted imaging and MR elastography for detection of physiologic changes of fibrosis. These individual approaches, or a combination, may offer a more quantitative approach and serve as biomarkers of fibrosis, but data at 3T as compared with 1.5T are limited [46].
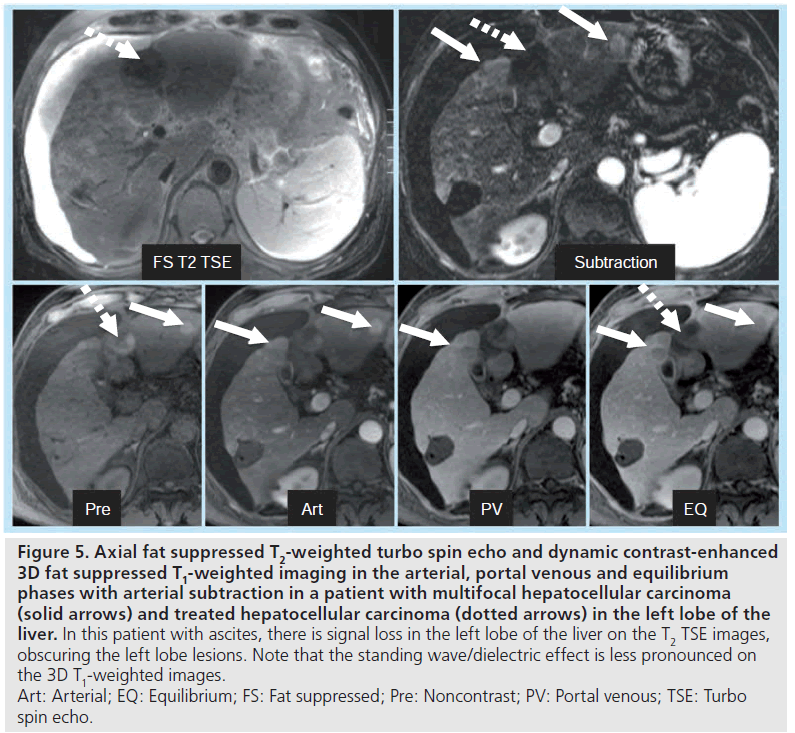
Figure 5. Axial fat suppressed T2-weighted turbo spin echo and dynamic contrast-enhanced 3D fat suppressed T1-weighted imaging in the arterial, portal venous and equilibrium phases with arterial subtraction in a patient with multifocal hepatocellular carcinoma (solid arrows) and treated hepatocellular carcinoma (dotted arrows) in the left lobe of the liver. In this patient with ascites, there is signal loss in the left lobe of the liver on the T2 TSE images, obscuring the left lobe lesions. Note that the standing wave/dielectric effect is less pronounced on the 3D T1-weighted images. Art: Arterial; EQ: Equilibrium; FS: Fat suppressed; Pre: Noncontrast; PV: Portal venous; TSE: Turbo spin echo.
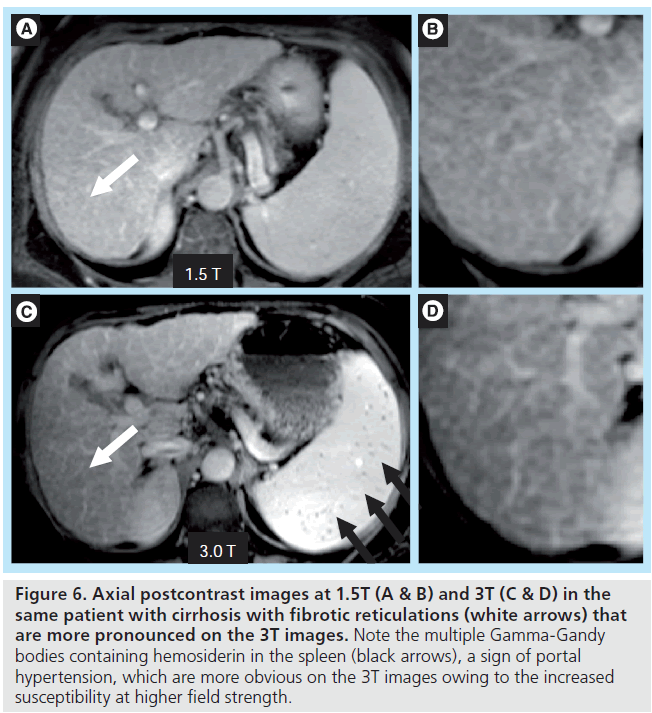
The primary downside of MRI at 3T in cirrhosis occurs in patients with large-volume ascites. The combination of abdominal distention and a f luid-filled abdomen leads to potentially severe standing wave and dielectric effect artifacts. These artifacts can be partially overcome by using an RF cushion and by relying more on dynamic contrast-enhanced 3D gradient echo imaging than on T2-weighted sequences (Figure 5). 3T offers the potential for higher resolution imaging and greater conspicuity of gadolinium chelate enhancement, and therefore the morphologic changes of cirrhosis may be more easily detected (Figure 6). Advanced shimming techniques can also be employed. However, in the setting of known ascites, 1.5T imaging may be preferred if available.
Figure 6. Axial postcontrast images at 1.5T (A & B) and 3T (C & D) in the same patient with cirrhosis with fibrotic reticulations (white arrows) that are more pronounced on the 3T images. Note the multiple Gamma-Gandy bodies containing hemosiderin in the spleen (black arrows), a sign of portal hypertension, which are more obvious on the 3T images owing to the increased susceptibility at higher field strength.
Focal liver disease
Focal nodular hyperplasia versus adenoma
Focal nodular hyperplasia (FNH) represents benign hyperplasia of normal hepatic parenchyma that is thought to be secondary to an underlying congenital arteriovenous malformation. FNH is very common, second only to hemangiomas among benign hepatic tumors. FNH classically presents as an incidental finding in a woman of reproductive age. Complications of FNH are rare, and typically these lesions do not require intervention.
A hepatic adenoma is a benign neoplasm that can develop or grow in response to hormonal stimulation as seen in women of reproductive age on oral contraceptives. They are also associated with the use of anabolic steroids and in the setting of glycogen storage diseases. Patients are usually asymptomatic and the tumor is often detected incidentally. Hepatic adenomas can contain lipids and are frequently surrounded by a fibrous pseudocapsule. The primary complication of a hepatic adenoma is hemorrhage. Rarely, malignant transformation of these lesions has been reported.
On MRI, FNH and adenomas can both enhance homogenously on the arterial phase, but FNH tends to become isointense to liver parenchyma on subsequent phases. When larger in size, a central scar may be seen, which classically demonstrates a low signal on T1 and hyperintensity on T2 with delayed enhancement. By contrast, hepatic adenomas demonstrate a pseudocapsule on delayed imaging and may contain fat, hemorrhage or areas of necrosis. While it is sometimes difficult to differentiate between these two lesions, studies have demonstrated the benefits of using hepatobiliary contrast agents, such as gadoxetate disodium or gadobenate dimeglumine. FNH retains some malformed biliary ducts, typically enhancing on the delayed hepatobiliary phase, whereas adenomas do not. Grazioli et al. found that by using intravenous gadobenate dimeglumine and delayed hepatobiliary phase imaging, the overall accuracy for the differentiation of FNH from hepatic adenomas and liver adenomatosis was 98% [47].
At 3T, higher resolution imaging and greater contrast between gadolinium chelates and background liver may be advantageous for detection and distinction of these tumors, although it is unclear if this is of clinical significance. The increased sensitivity at higher field strength to small amounts of intralesional fat and hemorrhage/ hemosiderin may also be beneficial.
Hepatic metastases versus hemangiomas
The detection of small hepatic metastases is important for accurate staging and management of a patient with known cancer, and this task can be even more challenging due to the high prevalence of small benign hepatic lesions. Hepatic hemangiomas are particularly common and are present in up to 20% of the population. Most hemangiomas are very small and generally asymptomatic, often incidentally detected at imaging. Even in the setting of known malignancy, there is still considerable likelihood that an incidentally noted small lesion is a benign lesion, such as a hemangioma rather than a metastasis [48].
On MRI, hepatic hemangiomas are homogeneously T1 hypointense and homogeneously T2 hyperintense, while larger lesions may be complicated by hemorrhage, thrombosis, internal septations and cystic degeneration. By contrast, lesions that follow the signal intensity of the spleen on multiple sequences are considered suspicious for metastases. Exceptions to this appearance include lesions complicated by hemorrhage as well as melanoma metastases. Smaller mucinous or partially treated metastases can be easily mistaken for cysts or benign hemangiomas on standard sequences, but dynamic contrastenhanced imaging combined with heavily T2-weighted sequences with longer echo times can sometimes distinguish these lesions.
Classically, hemangiomas demonstrate peripheral, nodular, discontinuous enhancement with centripetal progression. Smaller hemangiomas may demonstrate uniform arterial-phase enhancement, while larger lesions may hypoenhance centrally. Smaller, hypervascular metastases may also demonstrate a similar uniform ‘flash-filling’ pattern. However, these lesions generally do not demonstrate persistent enhancement on 5‑min delayed-phase images. Larger hypervascular metastases frequently have continuous peripheral enhancement. Hemangiomas frequently have progressive enhancement into the portal venous phase, at which time some metastases may begin to washout. It is important to note that other entities, such as intrahepatic cholangiocarcinoma, also classically demonstrate delayed enhancement, as well as some HCCs, so this phase alone cannot be used to distinguish hemangiomas from malignancy.
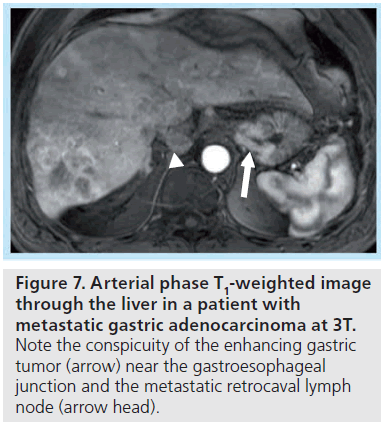
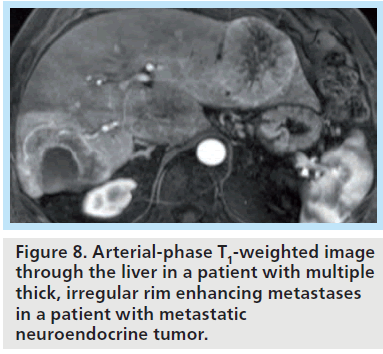
At 3T, differentiation of smaller lesions may benefit from the increased signal-to-noise afforded at higher field strength, with the resulting ability to generate thin-section, highresolution images (Figures 7 & 8). The ability to distinguish the two classes of lesions based upon differences in early enhancement with a hepatobiliary agent such as gadoxetate disodium has been recently demonstrated at 3T [49]. DWI has also shown promise for detection of malignancy, and may benefit from imaging at higher field strength, as discussed further below.
Figure 7. Arterial phase T1-weighted image through the liver in a patient with metastatic gastric adenocarcinoma at 3T. Note the conspicuity of the enhancing gastric tumor (arrow) near the gastroesophageal junction and the metastatic retrocaval lymph node (arrow head).
Figure 8. Arterial-phase T1-weighted image through the liver in a patient with multiple thick, irregular rim enhancing metastases in a patient with metastatic neuroendocrine tumor.
Hepatocellular carcinoma
Hepatocellular carcinoma is the most common primary malignant tumor of the liver. The incidence of HCC varies widely in different regions of the world, at least in part due to the varying prevalence of one of its main risk factors, hepatitis B or C infection. HCC generally occurs in patients who have suffered chronic liver injury, classically in the setting of cirrhosis. A notable exception is the fibrolamellar variant of HCC, an extremely rare subtype.
On MRI, smaller HCCs that are in the range of 1 to 2 cm are frequently isointense and difficult to discern on both T1 and T2 imaging, but can be detected based on homogeneous arterial-phase enhancement following contrast administration. Larger HCCs demonstrate heterogeneous arterial-phase enhancement, often due to complications such as necrosis or hemorrhage, but generally have rapid washout and are hypointense relative to background liver on portal venous phase imaging. HCCs greater than 2 cm also frequently have a fibrous pseudocapsule, which enhances on delayed phase postcontrast imaging.
Diffusion-weighted imaging has been shown to be sensitive for the presence of hepatic fibrosis and cirrhosis [46,50–53], and also aids in the detection of potential malignant lesions [51,52]. However, there are also potential concerns for DWI at 3T, including the impact of field strength on calculated apparent diffusion coefficient values [54], which could affect quantitative thresholds. While the higher baseline SNR at 3T would in theory improve DWI image quality and permit higher b-value imaging, often in practice with current sequences, DWI is vulnerable to susceptibility effects and image quality is degraded by distortion. To date, no studies have demonstrated substantial benefit of DWI at 3T compared with 1.5T. Further optimization of DWI at 3T is warranted, as the typical single-shot, spin-echo, echoplanar imaging sequences used for diffusion are low spatial resolution and prone to artifacts related to field inhomogeneity. Improvements in parallel imaging, RF coil design and alternative sequence options, such as non-Cartesian acquisition techniques, are needed to optimize image quality and reproducibility at 3T.
MR spectroscopy has been used for neurologic applications and has been under limited exploration for oncologic applications in the body, such as distinguishing between benign and malignant lesions, assessment of tumor grade and response to therapy. Greater spectral separation between metabolite peaks combined with higher SNR at 3T is advantageous for MR spectroscopy. Ex vivo proton MR spectroscopy has demonstrated elevated choline and decreased lipid in HCC compared with cirrhotic and normal liver [55]. Kuo et al. prospectively investigated the change in metabolites within HCC with transarterial chemoembolization (TACE) [56]. They examined the ratio of choline to lipid before and after treatment and had a 90% technical success rate at 3T in 43 patients and eight volunteers. While malignant tumors did demonstrate elevated choline compared with normal liver and benign tumors, the mean choline/lipid ratios between malignancy and background liver compared with benign tumors and background liver did not reach statistical significance. The choline to lipid ratio did decrease within tumors following TACE. There were several limitations of this study, including lack of an external reference standard for quantification of metabolites and the confounding effects of iodized oil infused during TACE and necrosis within tumor. A subsequent study showed the promise of using proton MR spectroscopy and DWI for assessing early response of HCC to TACE, with a significant increase in apparent diffusion coefficient and a decrease in hepatic choline levels [57]. However, in terms of differentiating between benign and malignant lesions, proton spectroscopy appears less promising. In a study by Fischbach et al., the authors demonstrated the feasibility of breath-hold proton MR spectroscopy, but found no difference between the choline content of malignant liver lesions versus background liver. In addition, in patients and normal volunteers, normal liver tissue showed a wide variability in choline-containing compounds [58].
Finally, as discussed above, increased susceptibility effects can be a positive aspect of 3T. This feature of higher field strength may improve lesion conspicuity in the context of intravenously administered iron containing contrast agents such as SPIO or ultrasmall SPIO nanoparticles, which are reticuloendothelial-specific contrast agents. The iron content leads to distortion of the local magnetic field and causes signal loss on T2-weighted imaging; therefore, tumors that demonstrate T2 prolongation, such as HCC, will become more conspicuous. Unfortunately, at the present time, these contrast agents are not clinically used in the USA and are not US FDA approved, but they have shown promise for assessment of liver fibrosis and detection of HCC. Pitfalls include well-differentiated HCC, which may contain Kupffer cells and could enhance similarly to background liver [59], and liver fibrosis, which could exhibit heterogeneous uptake and thereby mimic malignancy. However, in a recent study by Park et al. at 3T, there was better conspicuity of hepatic lesions on a T2*-weighted sequence compared with a T2-weighted sequence. The authors were able to distinguish well-differentiated HCC from dysplastic nodules with a sensitivity of 57%, specificity of 96% and accuracy of 72%, based on the imaging feature of inhomogeneous high signal intensity on T2* in HCC [60]. SPIO contrasts agents may be used in combination with gadolinium chelate agents, and a recent study evaluating double contrast-enhanced MRI of the liver at 3T showed promising results with a sensitivity of 89% (ranging from 64 to 99% depending on lesion size) and overall specificity of 97% [61]. The results were improved over previous earlier reports at 1.5T, but direct comparison with SPIO contrast agents at 3T with state of the art 1.5T imaging is yet to be performed.
MR cholangiopancreatography
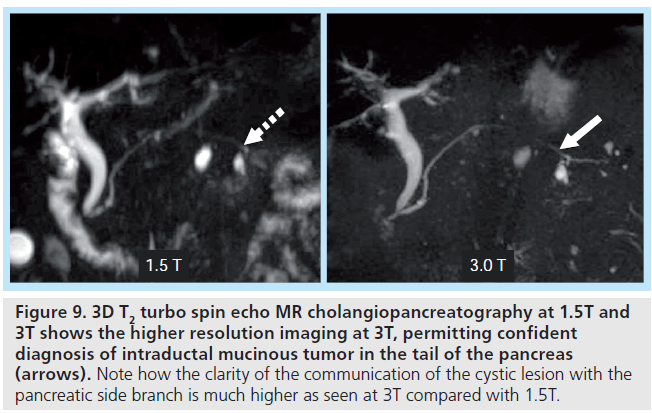
2D and 3D MR cholangiopancreatography techniques are essential for evaluation of the intrahepatic biliary tree in potential liver donors and for congenital abnormalities as well as in infectious/inf lammatory disease processes, such as primary sclerosing cholangitis, and in malignancy, such as cholangiocarcinoma. MR cholangiopancreatography is important for the diagnosis of subtle tumors, demonstrating irregular bile duct narrowing with peripheral ductal dilatation. Multiple studies have demonstrated quantitative contrast to noise benefits of higher field strength when comparing 1.5T to 3T, in addition to qualitative improvements in image quality [2,25,62–64]. This theoretical benefit can be maximized by employing parallel imaging in combination with variable RF pulse techniques, such as variable-rate selective excitation [11], and variable flip-angle techniques, such as sampling perfection with application optimizing contrasts using flip angle evolutions [62]. Increased contrast and signal-to-noise permits higher resolution imaging, benefiting evaluation of focal masses, evaluation of the biliary and pancreatic duct anatomy (Figure 9), and ascertaining the relationship between the ducts and the pathologic processes.
Figure 9. 3D T2 turbo spin echo MR cholangiopancreatography at 1.5T and 3T shows the higher resolution imaging at 3T, permitting confident diagnosis of intraductal mucinous tumor in the tail of the pancreas (arrows). Note how the clarity of the communication of the cystic lesion with the pancreatic side branch is much higher as seen at 3T compared with 1.5T.
Conclusion
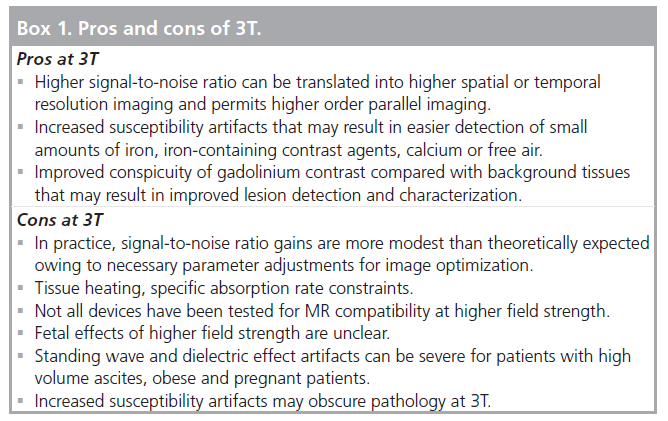
High-field liver imaging has significant potential but also has limitations (Box 1). There are limited studies that have compared 1.5T and 3T for liver imaging, and field strength alone is just one factor that affects image quality of MR. A state of the art 1.5T magnet can demonstrate as good and sometimes better quality when compared with 3T in certain patients, including in obese patients or patients with massive ascites. Advances in coil and sequence design in combination with higher field strength will likely further improve the image quality at 3T and overcome some of the challenges, but it remains to be seen if it will significantly affect diagnosis, treatment planning or patient outcome. In general, 3T offers higher SNR, which can be used for higher spatial resolution, greater spectral separation, and theoretically better conspicuity between gadolinium chelates and background tissue. These factors suggest that 3T may prove superior to 1.5T for certain applications such as oncologic imaging.
Future perspective
Further investigation is still needed to determine whether imaging at 3T will positively or negatively impact liver lesion detection, characterization and ultimately patient outcomes when compared with 1.5T. Unfortunately, this type of investigation is difficult as many institutions do not have both 1.5T and 3T magnets readily available, or cannot find funding to image patients on both scanners within a short time span. In addition, there is much more to MR scanning than just the field strength. There are multiple parameters that impact image quality and comparing image quality is not necessarily a sufficient goal. The objective of moving to highfield and ultrahigh-field MRI should not simply be to maintain the image quality standards of 1.5T imaging, but rather to improve quality and even go several steps further by advancing imaging beyond just morphologic assessment. By moving toward functional and physiologic imaging, in an effort to gain a better understanding of disease processes, there is hope for further impacting diagnosis and therapy for individual patients. While 1.5T and 3T MRI may remain preferable for many routine clinical applications, ultrahigh field may emerge as the next step for specific clinical indications that require functional or physiologic assessment using advanced spectroscopy, susceptibility-weighted imaging or alternative nuclei.
Financial & competing interests disclosure
The authors have no relevant affiliations or financial involvement with any organization or entity with a financial interest in or financial conflict with the subject matter or materials discussed in the manuscript. This includes employment, consultancies, honoraria, stock ownership or options, expert testimony, grants or patents received or pending, or royalties.
No writing assistance was utilized in the production of this manuscript.
Bibliography
Papers of special note have been highlighted as:
* of interest
**of considerable interest
- Lee VS, Hecht EM, Taouli B, Chen Q, Prince K, Oesingmann N: Body and cardiovascular MR imaging at 3.0 T. Radiology 244, 692–705 (2007).
- Merkle EM, Dale BM: Abdominal MRI at 3.0 T: the basics revisited. AJR Am. J. Roentgenol. 186, 1524–1532 (2006).
- Merkle EM, Dale BM, Paulson EK: Abdominal MR imaging at 3T. Magn. Reson. Imaging Clin. N. Am. 14, 17–26 (2006). & Excellent clinical review of the challenges of imaging at 3T.
- de Bazelaire CM, Duhamel GD, Rofsky NM, Alsop DC: MR imaging relaxation times of abdominal and pelvic tissues measured in vivo at 3.0 T: preliminary results. Radiology 230, 652–659 (2004). & Prospectively studies normal volunteers and demonstrates the effects of increasing field strength on T1 and T2 relaxation times on abdominal and pelvic tissue.
- Stanisz GJ, Odrobina EE, Pun J et al.: T1, T2 relaxation and magnetization transfer in tissue at 3T. Magn. Reson. Med. 54, 507–512 (2005).
- Takahashi M, Uematsu H, Hatabu H: MR imaging at high magnetic fields. Eur. J. Radiol. 46, 45–52 (2003).
- Edelman RR, Salanitri G, Brand R et al.: Magnetic resonance imaging of the pancreas at 3.0 tesla: qualitative and quantitative comparison with 1.5 tesla. Invest. Radiol. 41, 175–180 (2006).
- Trattnig S, Pinker K, Ba-Ssalamah A, Nobauer-Huhmann I-M: The optimal use of contrast agents at high field MRI. Eur. Radiol. 16, 1280–1287 (2006).
- Lewin JS, Duerk JL, Jain VR, Petersilge CA, Chao CP, Haaga JR: Needle localization in MR-guided biopsy and aspiration: effects of field strength, sequence design, and magnetic field orientation. AJR Am. J. Roentgenol. Am. J. Roentgenol. 166, 1337–1345 (1996).
- Constable RT, Gore JC: The loss of small objects in variable TE imaging: implications for FSE, RARE, and EPI. Magn. Reson. Med. 28, 9–24 (1992).
- Hargreaves BA, Cunningham CH, Nishimura DG, Conolly SM: Variable-rate selective excitation for rapid MRI sequences. Magn. Reson. Med. 52, 590–597 (2004).
- Hennig J, Scheffler K: Hyperechoes. Magn. Reson. Med. 46, 6–12 (2001).
- Hennig J, Weigel M, Scheffler K: Multiecho sequences with variable refocusing flip angles: optimization of signal behavior using smooth transitions between pseudo steady states (TRAPS). Magn. Reson. Med. 49, 527–535 (2003).
- Lichy MP, Wietek BM, Mugler JP 3rd et al.: Magnetic resonance imaging of the body trunk using a single-slab, 3D, T2-weighted turbo-spin-echo sequence with high sampling efficiency (SPACE) for high spatial resolution imaging: initial clinical experiences. Invest. Radiol. 40, 754–760 (2005).
- Gauden AJ, Phal PM, Drummond KJ: MRI safety; nephrogenic systemic fibrosis and other risks. J. Clin. Neurosci. 17, 1097–1104 (2010).
- Shellock FG: Reference Manual MRI Safety Devices and Implants 2008. Biomedical Research Publishing Group, Los Angeles, CA, USA (2008).
- Crook N, Robinson L: A review of the safety implications of magnetic resonance imaging at field strengths of 3 Tesla and above. Radiology 15, 351–356 (2009).
- Deng J, Rhee TK, Sato KT et al.: In vivo diffusion-weighted imaging of liver tumor necrosis in the VX2 rabbit model at 1.5 Tesla. Invest. Radiol. 41, 410–414 (2006).
- Soher BJ, Dale BM, Merkle EM: A review of MR physics: 3T versus 1.5T. Magn. Reson. Imaging Clin. N. Am. 15, 277–290 (2007). & More technical review of the challenges of imaging at 3T.
- Franklin KM, Dale BM, Merkle EM: Improvement in B1-inhomogeneity artifacts in the abdomen at 3T MR imaging using a radiofrequency cushion. J. Magn. Reson. Imaging 27, 1443–1447 (2008).
- Katscher U, Bornert P, Leussler C, van den Brink JS: Transmit SENSE. Magn. Reson. Med. 49, 144–150 (2003).
- Zhu Y: Parallel excitation with an array of transmit coils. Magn. Reson. Med. 51, 775–784 (2004).
- Zhang Z, Yip CY, Grissom W, Noll DC, Boada FE, Stenger VA: Reduction of transmitter B1 inhomogeneity with transmit SENSE slice-select pulses. Magn. Reson. Med. 57, 842–847 (2007).
- Fujiyoshi F, Nakajo M, Fukukura Y, Tsuchimochi S: Characterization of adrenal tumors by chemical shift fast low-angle shot MR imaging: comparison of four methods of quantitative evaluation. AJR Am. J. Roentgenol. Am. J. Roentgenol. 180, 1649–1657 (2003).
- Merkle EM, Schindera ST: MR imaging of the adrenal glands: 1.5T versus 3T. Magn. Reson. Imaging Clin. N. Am. 15, 365–372 (2007).
- Schindera ST, Soher BJ, Delong DM, Dale BM, Merkle EM: Effect of echo time pair selection on quantitative analysis for adrenal tumor characterization with in-phase and opposed-phase MR imaging: initial experience. Radiology 248, 140–147 (2008).
- Angulo P, Lindor KD: Non-alcoholic fatty liver disease. J. Gastroenterol. Hepatol. 17(Suppl.), S186–S190 (2002).
- Cassidy FH, Yokoo T, Aganovic L et al.: Fatty liver disease: MR imaging techniques for the detection and quantification of liver steatosis. Radiographics 29, 231–260 (2009). & Comprehensive technical review of MR quantification methods for fatty liver disease.
- Ekstedt M, Franzen LE, Mathiesen UL et al.: Long-term follow-up of patients with NAFLD and elevated liver enzymes. Hepatology 44, 865–873 (2006).
- Guiu B, Loffroy R, Hillon P, Petit JM: Magnetic resonance imaging and spectroscopy for quantification of hepatic steatosis: urgent need for standardization! J. Hepatol. 51, 1082–1083; author reply 1083–1084 (2009).
- Szczepaniak LS, Nurenberg P, Leonard D et al.: Magnetic resonance spectroscopy to measure hepatic triglyceride content: prevalence of hepatic steatosis in the general population. Am. J. Physiol. Endocrinol. Metab. 288, E462–468 (2005).
- Wieckowska A, McCullough AJ, Feldstein AE: Noninvasive diagnosis and monitoring of nonalcoholic steatohepatitis: present and future. Hepatology 46, 582–589 (2007).
- Reeder SB, Hargreaves BA, Yu H, Brittain JH: Homodyne reconstruction and IDEAL water-fat decomposition. Magn. Reson. Med. 54, 586–593 (2005).
- Fuller S, Reeder S, Shimakawa A et al.: Iterative decomposition of water and fat with echo asymmetry and least-squares estimation (IDEAL) fast spin-echo imaging of the ankle: initial clinical experience. AJR Am. J. Roentgenol. 187, 1442–1447 (2006).
- Yokoo T, Bydder M, Hamilton G et al.: Nonalcoholic fatty liver disease: diagnostic and fat-grading accuracy of low-flip-angle multiecho gradient-recalled-echo MR imaging at 1.5 T. Radiology 251, 67–76 (2009).
- Alustiza JM, Artetxe J, Castiella A et al.: MR quantification of hepatic iron concentration. Radiology 230, 479–484 (2004).
- St Pierre TG, Clark PR, Chua-Anusorn W: Measurement and mapping of liver iron concentrations using magnetic resonance imaging. Ann. NY Acad. Sci. 1054, 379–385 (2005).
- St Pierre TG, Clark PR, Chua-Anusorn W et al.: Noninvasive measurement and imaging of liver iron concentrations using proton magnetic resonance. Blood 105, 855–861 (2005).
- Storey P, Thompson AA, Carqueville CL, Wood JC, de Freitas RA, Rigsby CK: R2* imaging of transfusional iron burden at 3T and comparison with 1.5T. J. Magn. Reson. Imaging 25, 540–547 (2007).
- Boll DT, Marin D, Redmon GM, Zink SI, Merkle EM: Pilot study assessing differentiation of steatosis hepatis, hepatic iron overload, and combined disease using two-point dixon MRI at 3T: in vitro and in vivo results of a 2D decomposition technique. Am. J. Roentgenol. 194, 964–971 (2010).
- Hines CD, Yu H, Shimakawa A, McKenzie CA, Brittain JH, Reeder SB: T1 independent, T2* corrected MRI with accurate spectral modeling for quantification of fat: validation in a fat-water-SPIO phantom. J. Magn. Reson. Imaging 30, 1215–1222 (2009).
- Szczepaniak LS, Nurenberg P, Leonard D et al.: Magnetic resonance spectroscopy to measure hepatic triglyceride content: prevalence of hepatic steatosis in the general population. Am. J. Physiol. Endocrinol. Metab. 288, E462–E468 (2005).
- Thomsen C, Becker U, Winkler K, Christoffersen P, Jensen M, Henriksen O: Quantification of liver fat using magnetic resonance spectroscopy. Magn. Reson. Imaging 12, 487–495 (1994).
- Taouli B, Ehman RL, Reeder SB: Advanced MRI methods for assessment of chronic liver disease. Am. J. Roentgenol. 193, 14–27 (2009).
- Wong J, McQuillan G, McHutchison J, Poynard T: Estimating future hepatitis C morbidity, mortality, and costs in the United States. Am. J. Public Health 90, 1562–1569 (2000).
- Taouli B, Koh D-M: Diffusion-weighted MR imaging of the liver. Radiology 254, 47–66 (2010).
- Grazioli L, Morana G, Kirchin MA, Schneider G: Accurate differentiation of focal nodular hyperplasia from hepatic adenoma at gadobenate dimeglumine-enhanced MR imaging: prospective study. Radiology 236, 166–177 (2005).
- Schwartz LH, Gandras EJ, Colangelo SM, Ercolani MC, Panicek DM: Prevalence and importance of small hepatic lesions found at CT in patients with cancer. Radiology 210, 71–74 (1999).
- Goshima S, Kanematsu M, Watanabe H et al.: Hepatic hemangioma and metastasis: differentiation with gadoxetate disodiumenhanced 3-T MRI. Am. J. Roentgenol. 195, 941–946 (2010).
- Lewin M, Poujol-Robert A, Boelle P-Y et al.: Diffusion-weighted magnetic resonance imaging for the assessment of fibrosis in chronic hepatitis C. Hepatology 46, 658–665 (2007).
- Patel J, Sigmund EE, Rusinek H, Oei M, Babb JS, Taouli B: Diagnosis of cirrhosis with intravoxel incoherent motion diffusion MRI and dynamic contrast-enhanced MRI alone and in combination: preliminary experience. J. Magn. Reson. Imaging 31, 589–600 (2010).
- Parikh T, Drew SJ, Lee VS et al.: Focal liver lesion detection and characterization with diffusion-weighted MR imaging: comparison with standard breath-hold T2-weighted imaging. Radiology 246, 812–822 (2008).
- Hecht EM, Lee RF, Taouli B, Sodickson DK: Perspectives on body MR imaging at ultrahigh field. Magn. Reson. Imaging Clin. N. Am. 15, 449–465 (2007). & Perspective on future directions of imaging at even higher field.
- Dale BM, Braithwaite AC, Boll DT, Merkle EM: Field strength and diffusion encoding technique affect the apparent diffusion coefficient measurements in diffusion-weighted imaging of the abdomen. Invest. Radiol. 45, 104–108 (2010).
- Soper R, Himmelreich U, Painter D et al.: Pathology of hepatocellular carcinoma and its precursors using proton magnetic resonance spectroscopy and a statistical classification strategy. Pathology 34, 417–422 (2002).
- Kuo YT, Li CW, Chen CY, Jao J, Wu DK, Liu GC: In vivo proton magnetic resonance spectroscopy of large focal hepatic lesions and metabolite change of hepatocellular carcinoma before and after transcatheter arterial chemoembolization using 3.0-T MR scanner. J. Magn. Reson. Imaging 19, 598–604 (2004).
- Chen CY, Li CW, Kuo YT et al.: Early response of hepatocellular carcinoma to transcatheter arterial chemoembolization: choline levels and MR diffusion constants – initial experience. Radiology 239, 448–456 (2006).
- Fischbach F, Schirmer T, Thormann M, Freund T, Ricke J, Bruhn H: Quantitative proton magnetic resonance spectroscopy of the normal liver and malignant hepatic lesions at 3.0 Tesla. Eur. Radiol. 18, 2549–2558 (2008).
- Tanimoto A, Kuribayashi S: Application of superparamagnetic iron oxide to imaging of hepatocellular carcinoma. Eur. J. Radiol. 58, 200–216 (2006).
- Park HS, Lee JM, Kim SH et al.: Differentiation of well-differentiated hepatocellular carcinomas from other hepatocellular nodules in cirrhotic liver: value of SPIO-enhanced MR imaging at 3.0 Tesla. J. Magn. Reson. Imaging 29, 328–335 (2009).
- Yoo HJ, Lee JM, Lee MW et al.: Hepatocellular carcinoma in cirrhotic liver: double-contrast-enhanced, high-resolution 3.0T-MR imaging with pathologic correlation. Invest. Radiol. 43, 538–546 (2008).
- Arizono S, Isoda H, Maetani YS et al.: High spatial resolution 3D MR cholangiography with high sampling efficiency technique (SPACE): comparison of 3T vs. 1.5T. Eur. J. Radiol. 73, 114–118 (2010).
- Isoda H, Kataoka M, Maetani Y et al.: MRCP imaging at 3.0 T vs. 1.5 T: preliminary experience in healthy volunteers. J. Magn. Reson. Imaging 25, 1000–1006 (2007).
- Schindera ST, Miller CM, Ho LM, DeLong DM, Merkle EM: Magnetic resonance (MR) cholangiography: quantitative and qualitative comparison of 3.0 Tesla with 1.5 Tesla. Invest. Radiol. 42, 399–405 (2007).
References
- Guidance for Industry and FDA Staff: Criteria for Significant Risk Investigations of Magnetic Resonance Diagnostic Devices www.fda.gov/MedicalDevices/ DeviceRegulationandGuidance/ GuidanceDocuments/ucm072686.htm
- MRIsafety.com, the official site of the Institute for Magnetic Resonance Safety, Education, and Research www.mrisafety.com
